PaperRight is a manual budgeting tool. It's based on 50/30/20 principles. We keep it super simple and centered on just 4 metrics - your daily burn rate and your needs, wants, and savings buckets.
Setting Up Your Monthly Income
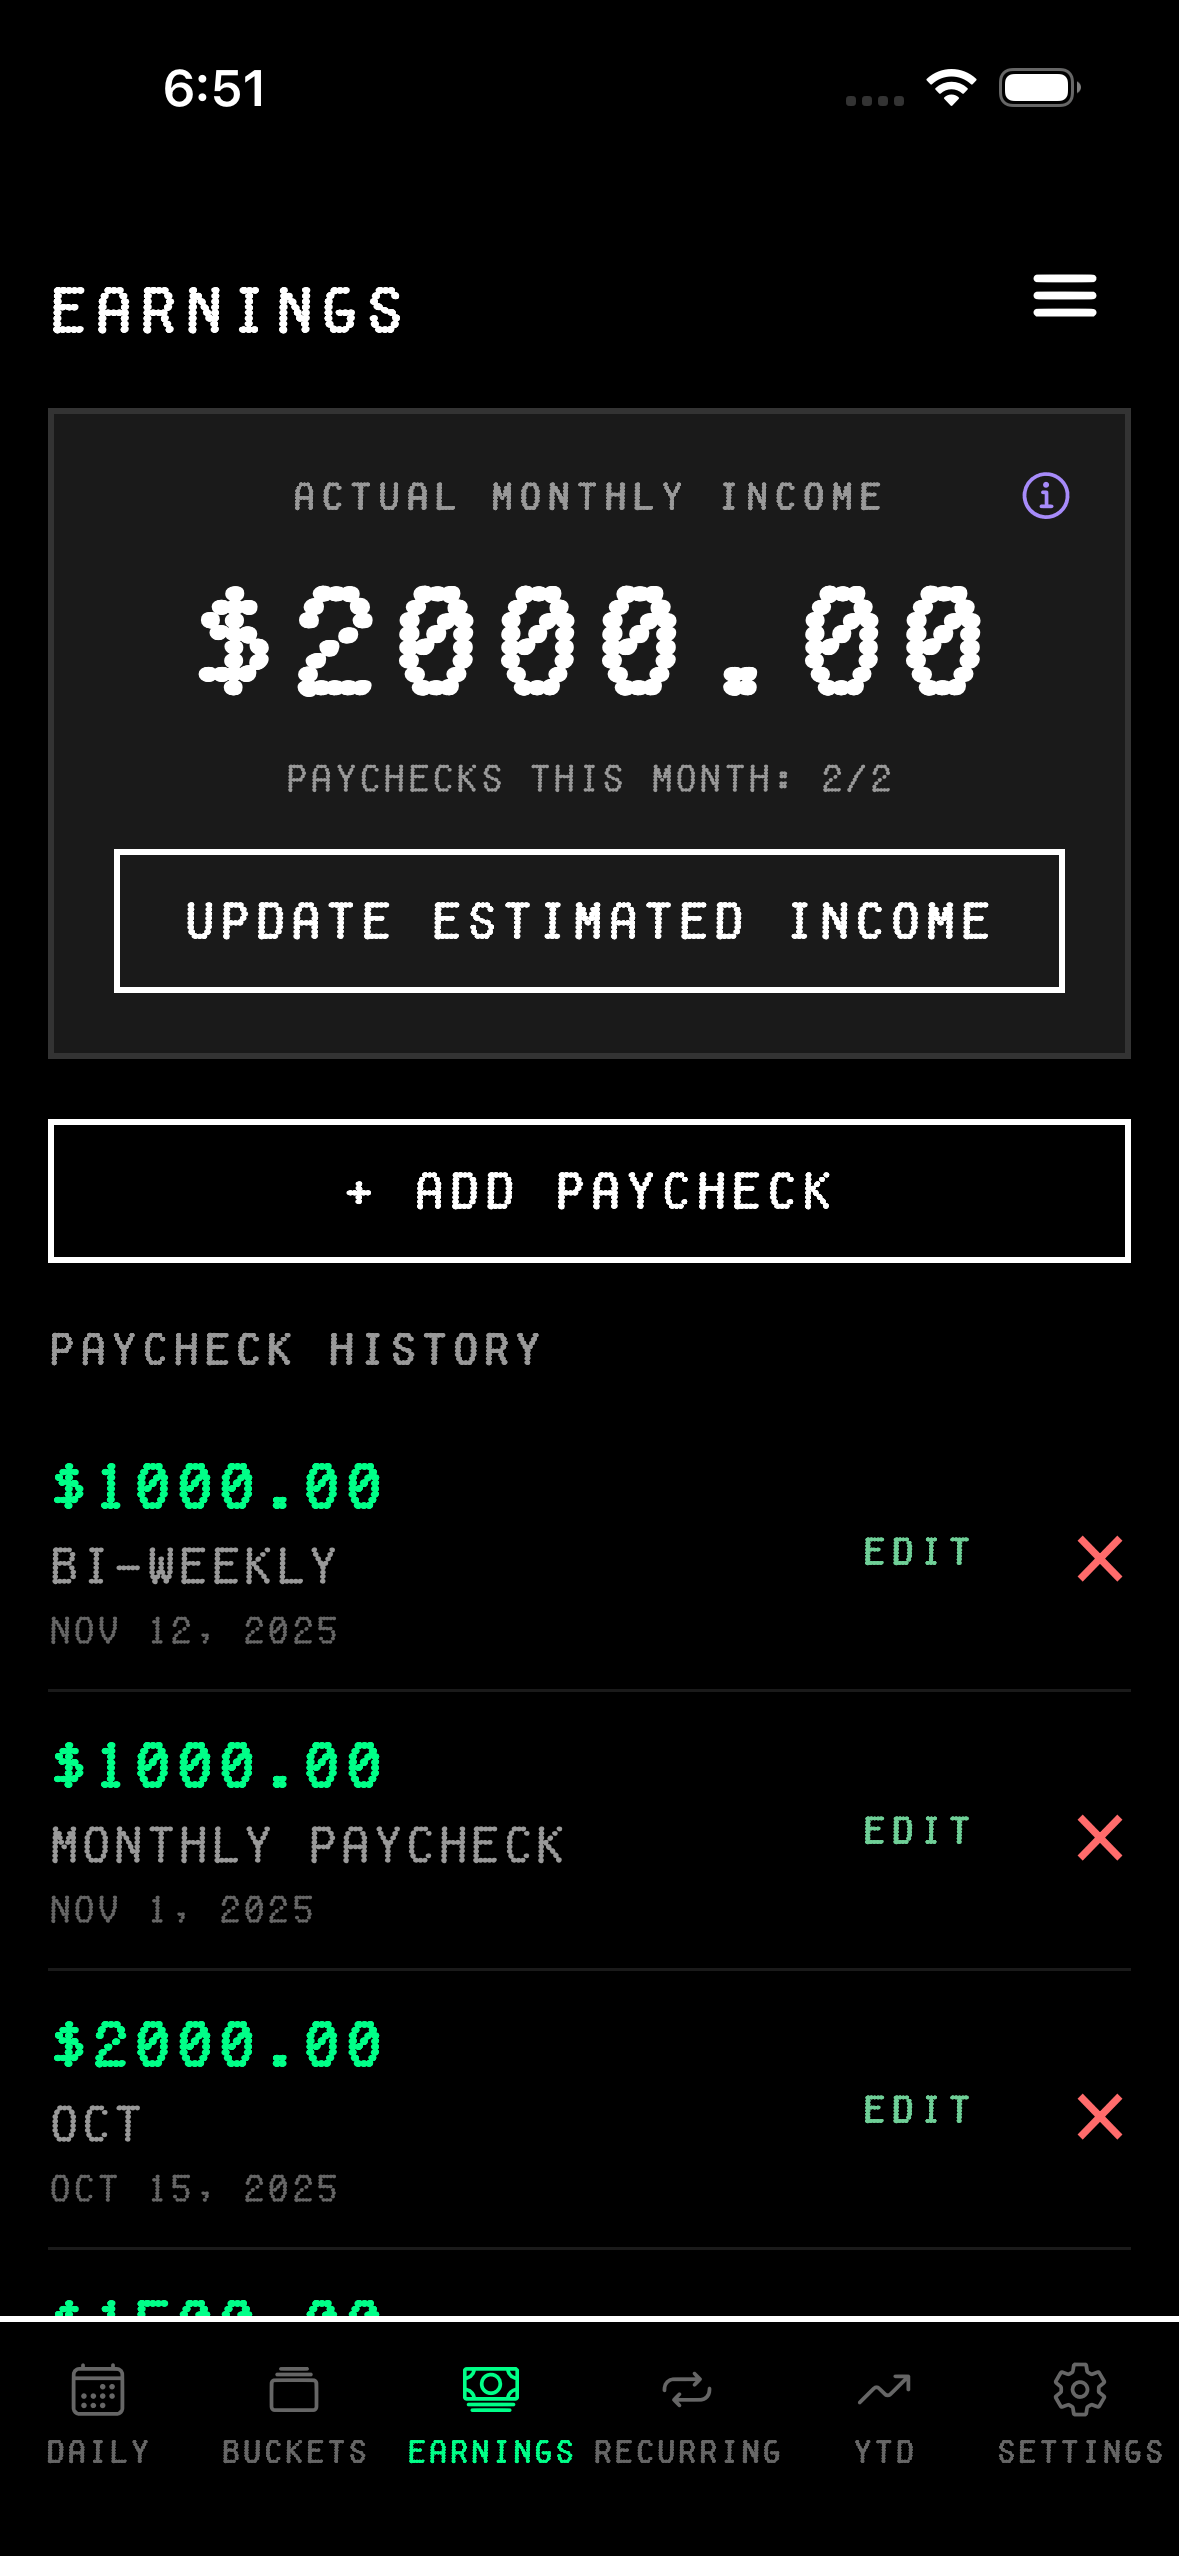
Start by entering your estimated monthly income in the earnings tab. This is the foundation for everything else in the app. You're setting up your budget buckets based on what you expect to make each month. The app uses this number to split your money into three categories following the 50/30/20 rule: half for needs, 30% for wants, and 20% for savings.
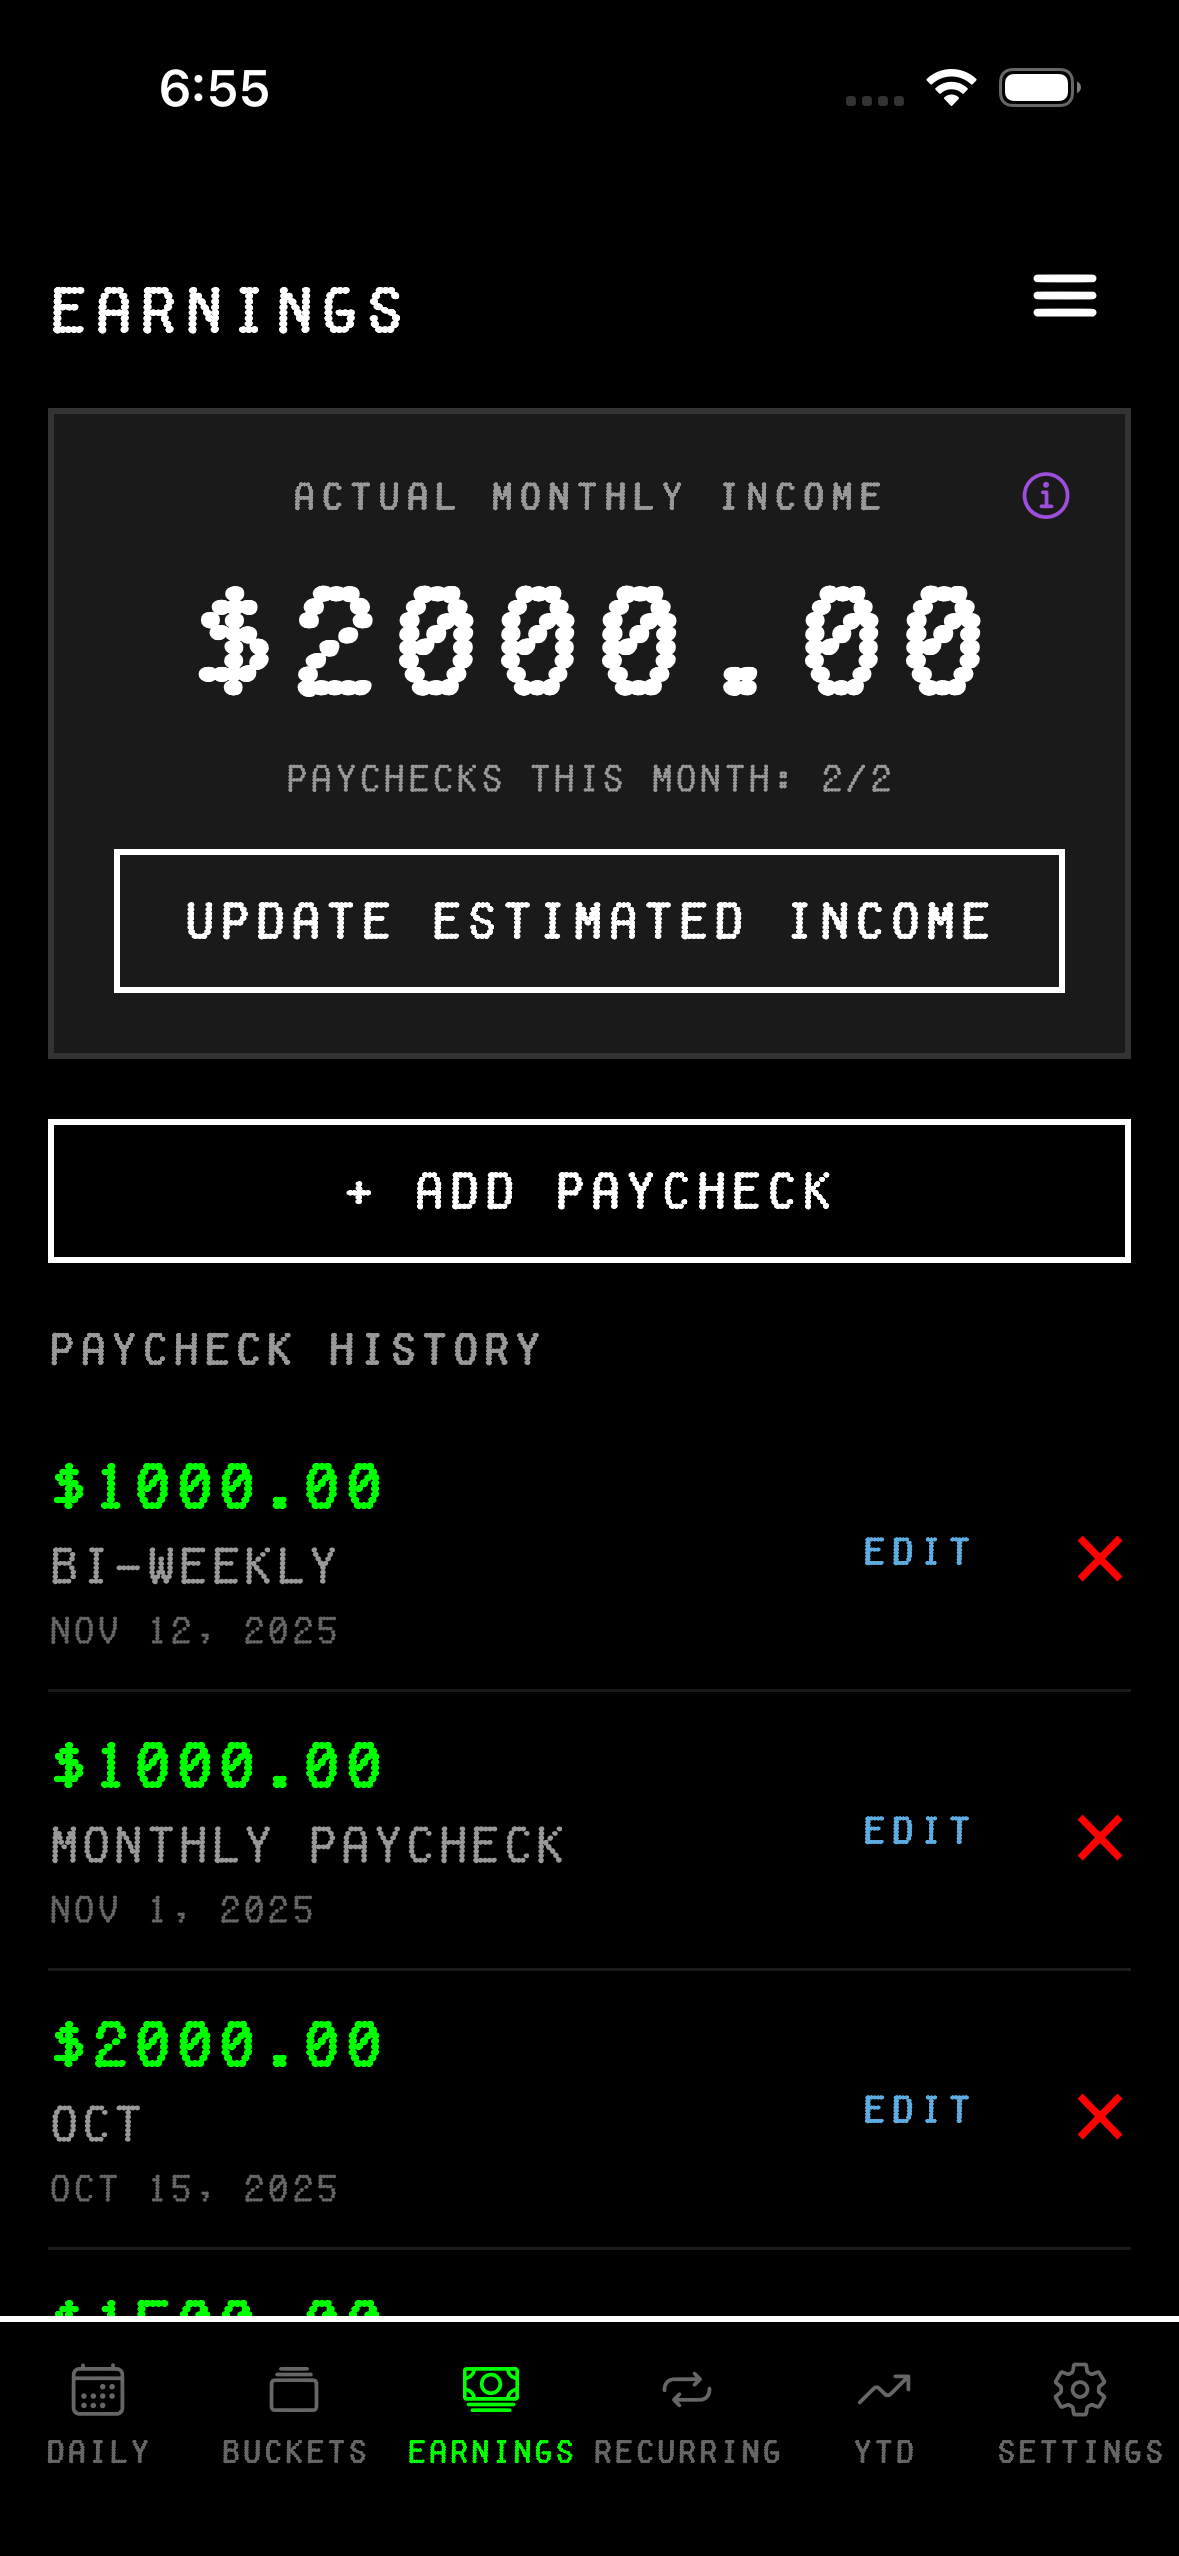
Don't worry too much about getting this number perfect right away. As you log actual paychecks throughout the month, the app will replace your estimate with real data. Think of the estimate as your starting point that gets refined as the month goes on.
Understanding Your Buckets
Once you've entered your income, head over to the Buckets tab. This is where you'll see how your money is divided up. The app shows you three buckets: needs, wants, and save. Each bucket tells you how much you have allocated and how much you've actually spent so far. Basic users get the standard 50/30/20 split, but if you're on the pro plan, you can adjust these percentages to whatever works for your situation.
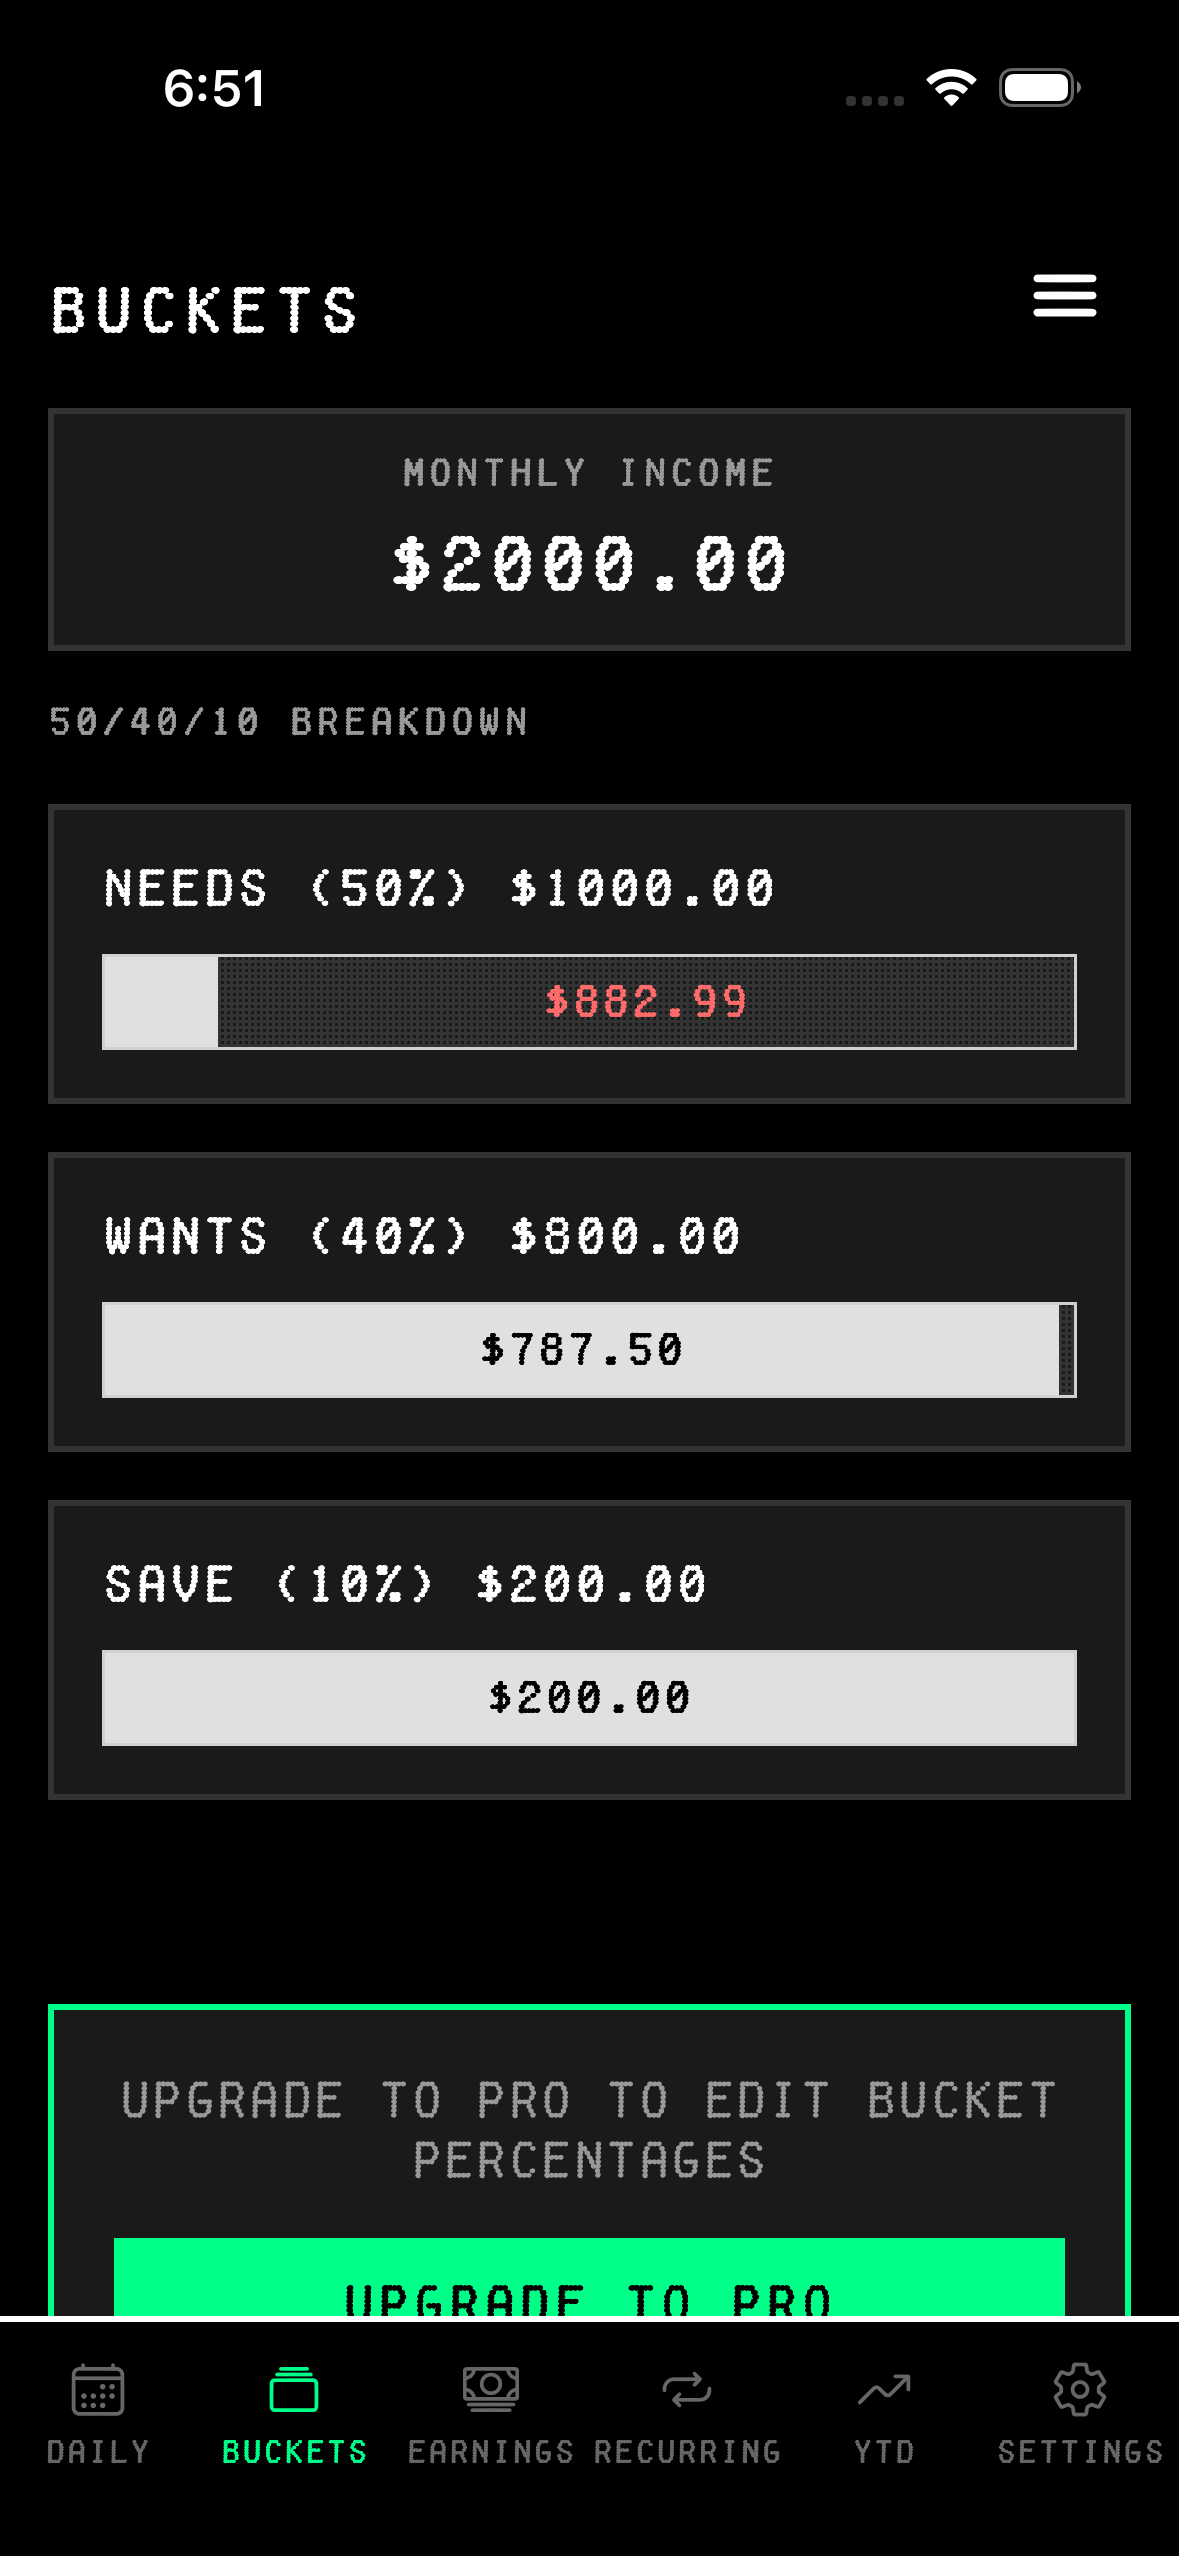
The bars inside each bucket show you visually where you stand. Black fills in as you spend money in that category, while white shows what's left. The red numbers in the black section tell you exactly how much you've used up. If you go over your budget, you'll see a yellow warning message letting you know you've crossed the line. Your goal should be to keep your spending inside each bucket's limits and never touch your savings allocation. The app keeps track of this in real-time as you log expenses, so you always know if you're staying on track or blowing past your limits.
Adding Recurring Expenses
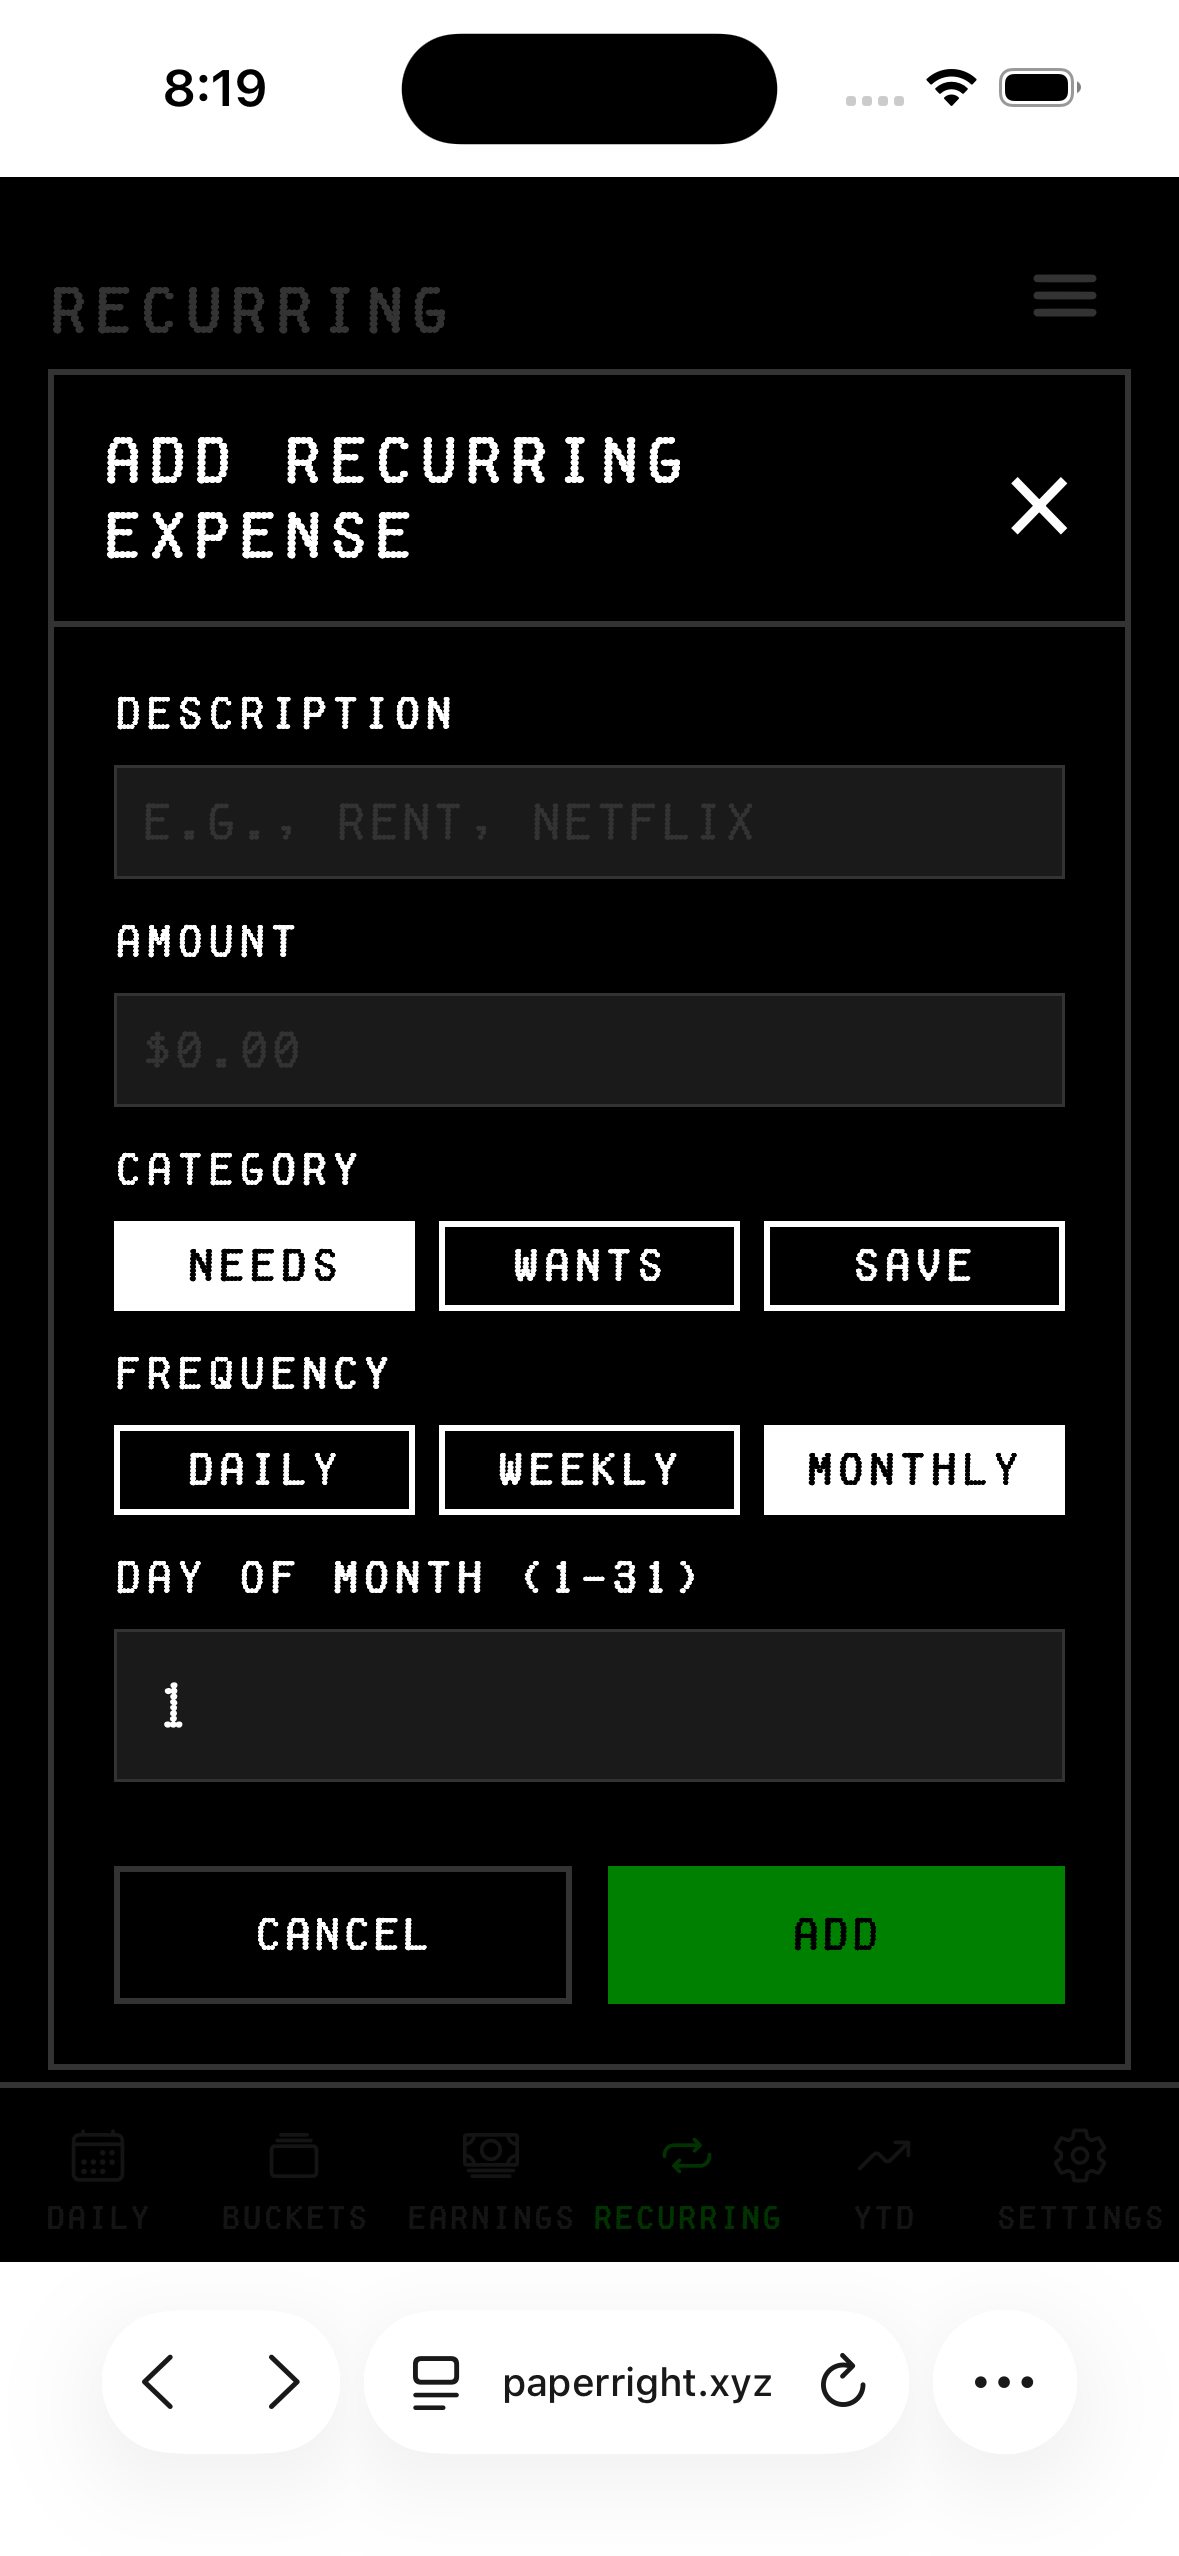
Most of us have bills that hit every month like clockwork. Rent, subscriptions, insurance—these are your recurring expenses. Go to the Recurring tab and add each one. You'll give it a description, an amount, and pick whether it's a need, want, or something you're saving for.
You can also set the frequency. Some things are monthly, others might be weekly or daily. You can even pick a specific day of the month if a bill always hits on the 15th or the 1st. The app will automatically factor these into your daily burn rate, which we'll get to in a second.
Once you've added all your recurring expenses, you'll see them listed out with their monthly totals. The app shows you how much is hitting your account on a regular basis, and you can edit or delete any of them if things change.
Your Daily Burn Rate
This is the main number you'll check every day. Your daily burn rate is how much you can spend per day without going over budget. The app calculates this by taking your monthly expenses—both one-time and recurring—and dividing by 30 days. It always uses 30 days, even in February or 31-day months, to keep the number consistent.
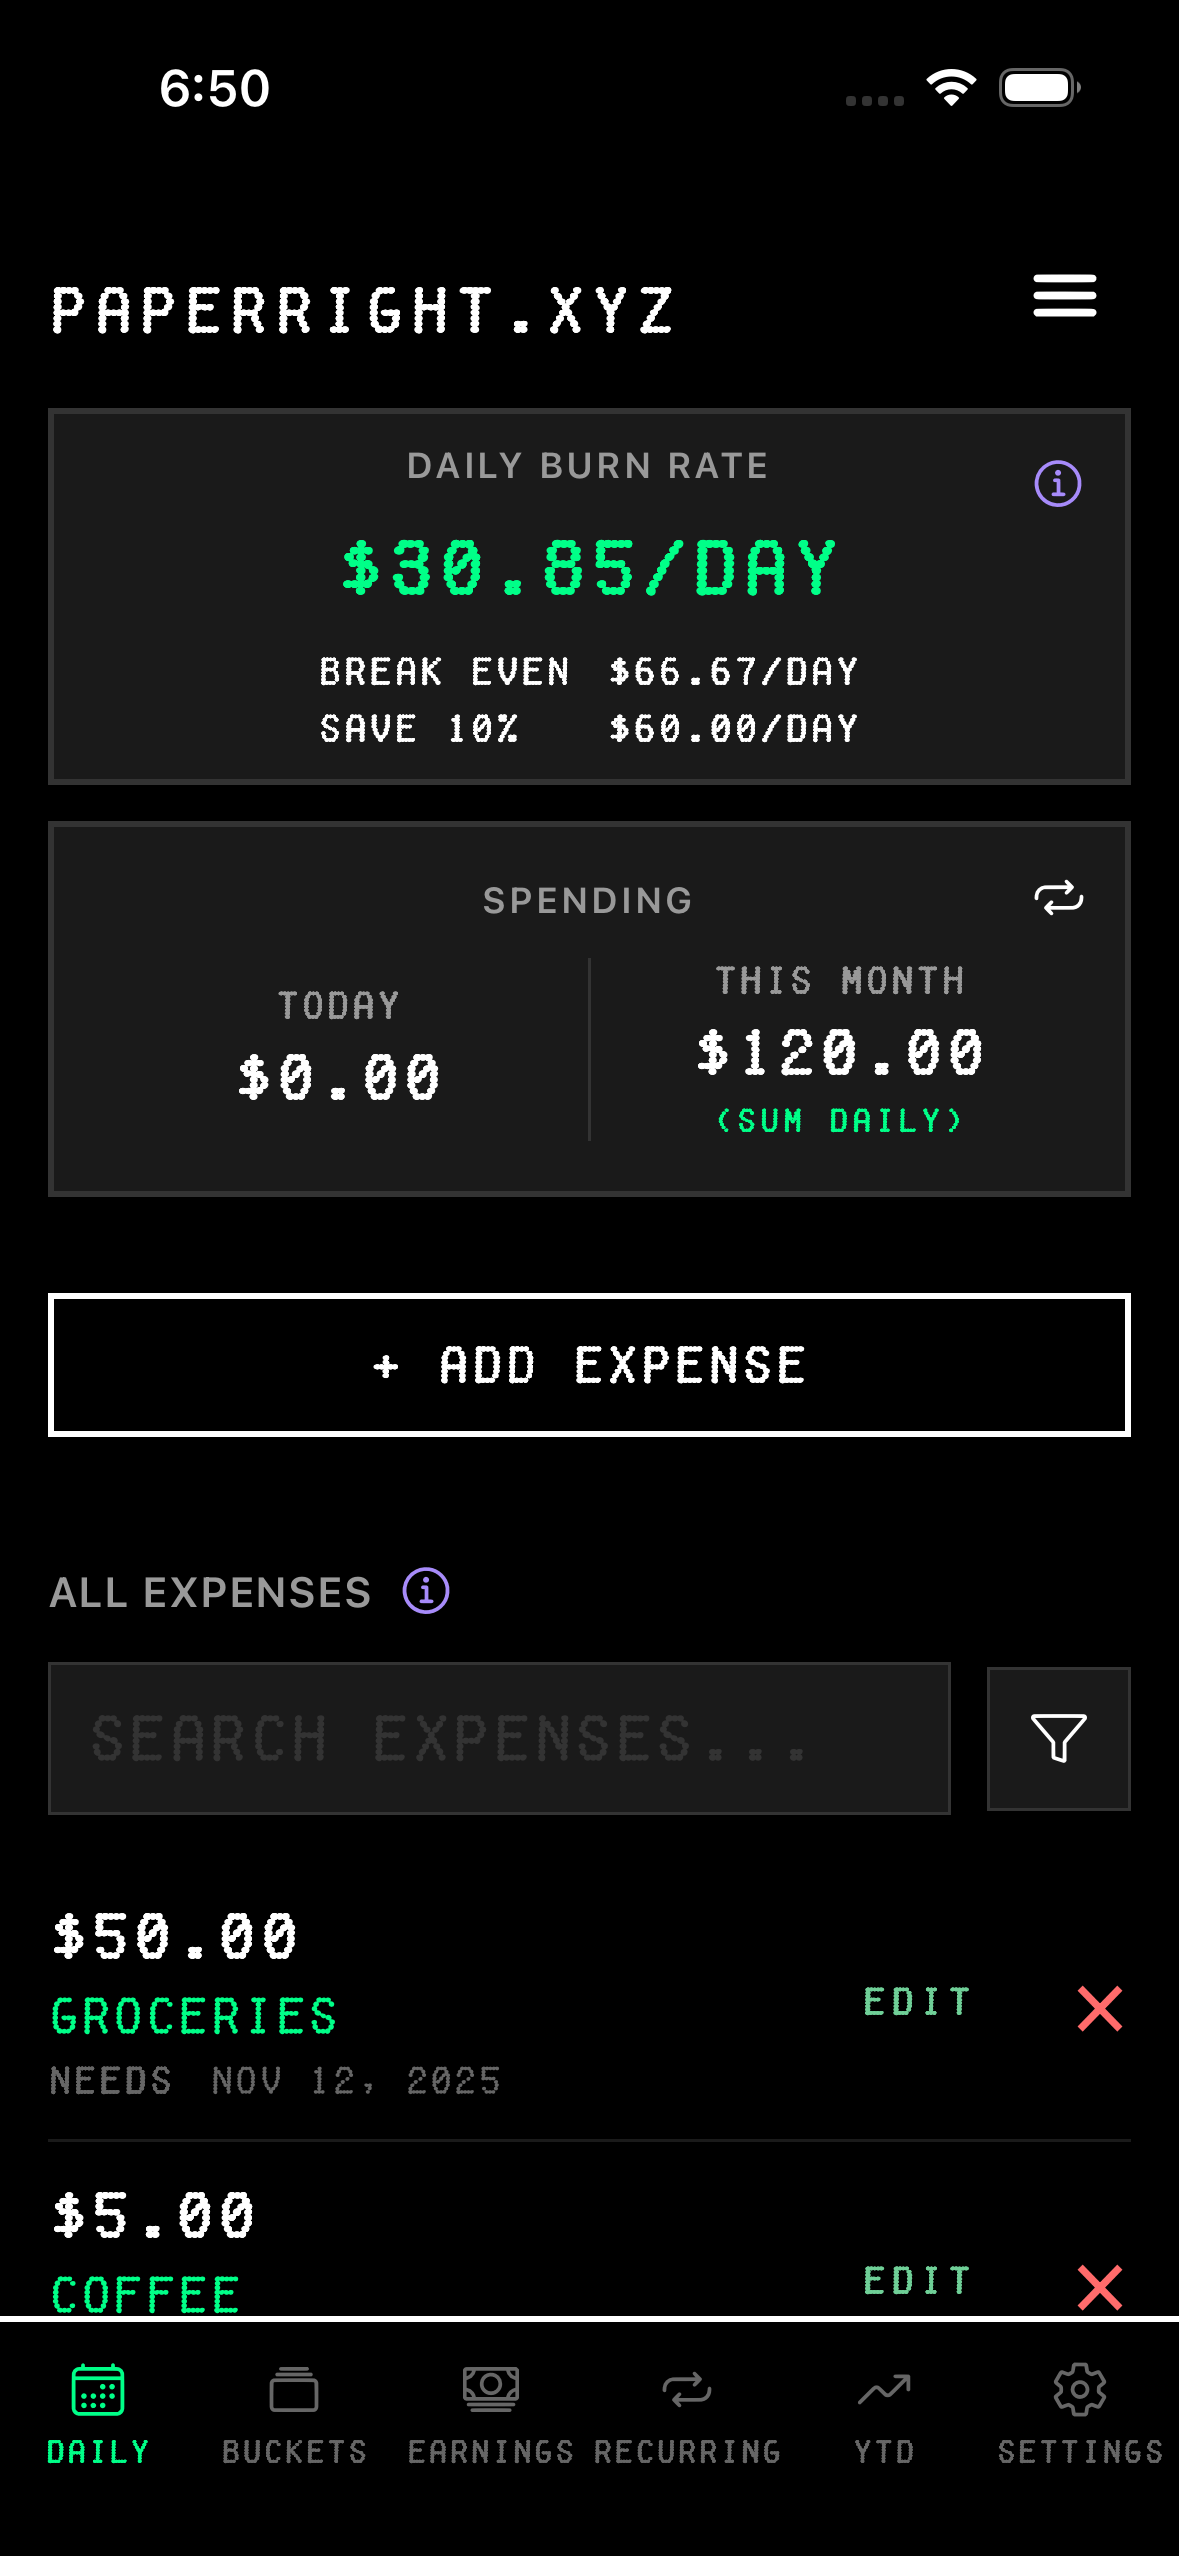
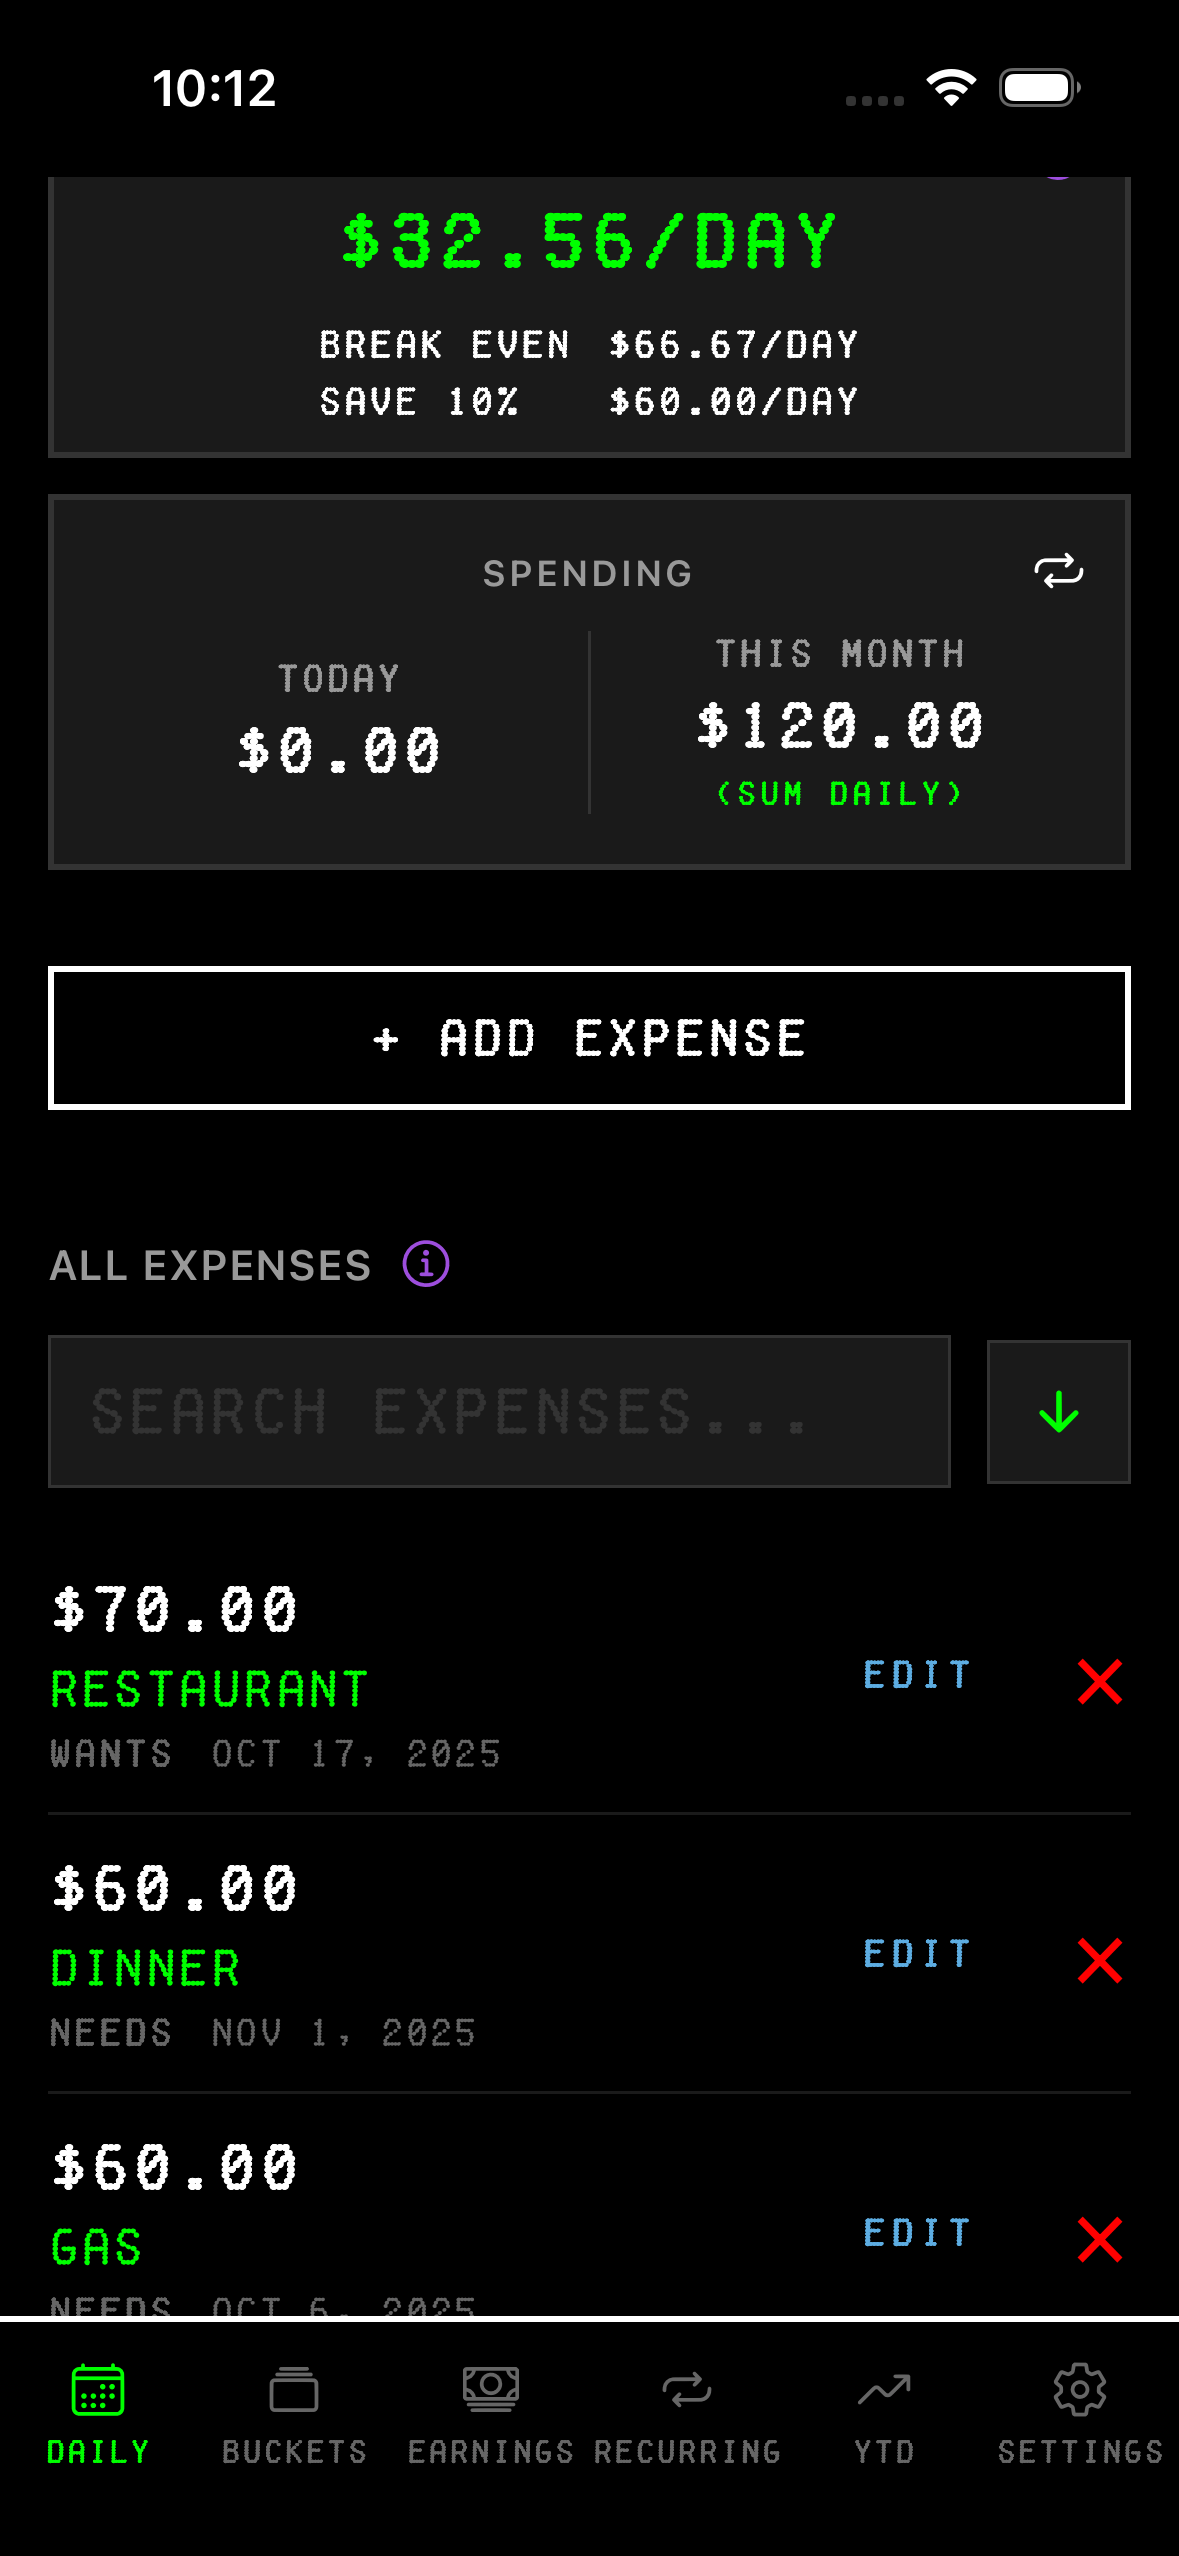
You'll see three numbers on the Daily tab: your current burn rate, what you'd need to break even, and what you'd need to hit your savings bucket. If you're spending less than your burn rate, you're on track. If you're over, you're burning too hot and need to pull back.
When you add a one-time expense—say you spend $10 on coffee—your burn rate goes up by $0.33 per day because that $10 gets spread across 30 days. If you add a recurring expense like a $3,000 per month rent payment, that adds $100 to your daily burn rate. The math is simple, but it keeps you aware of how every purchase affects your daily spending average.
Searching Your Expenses
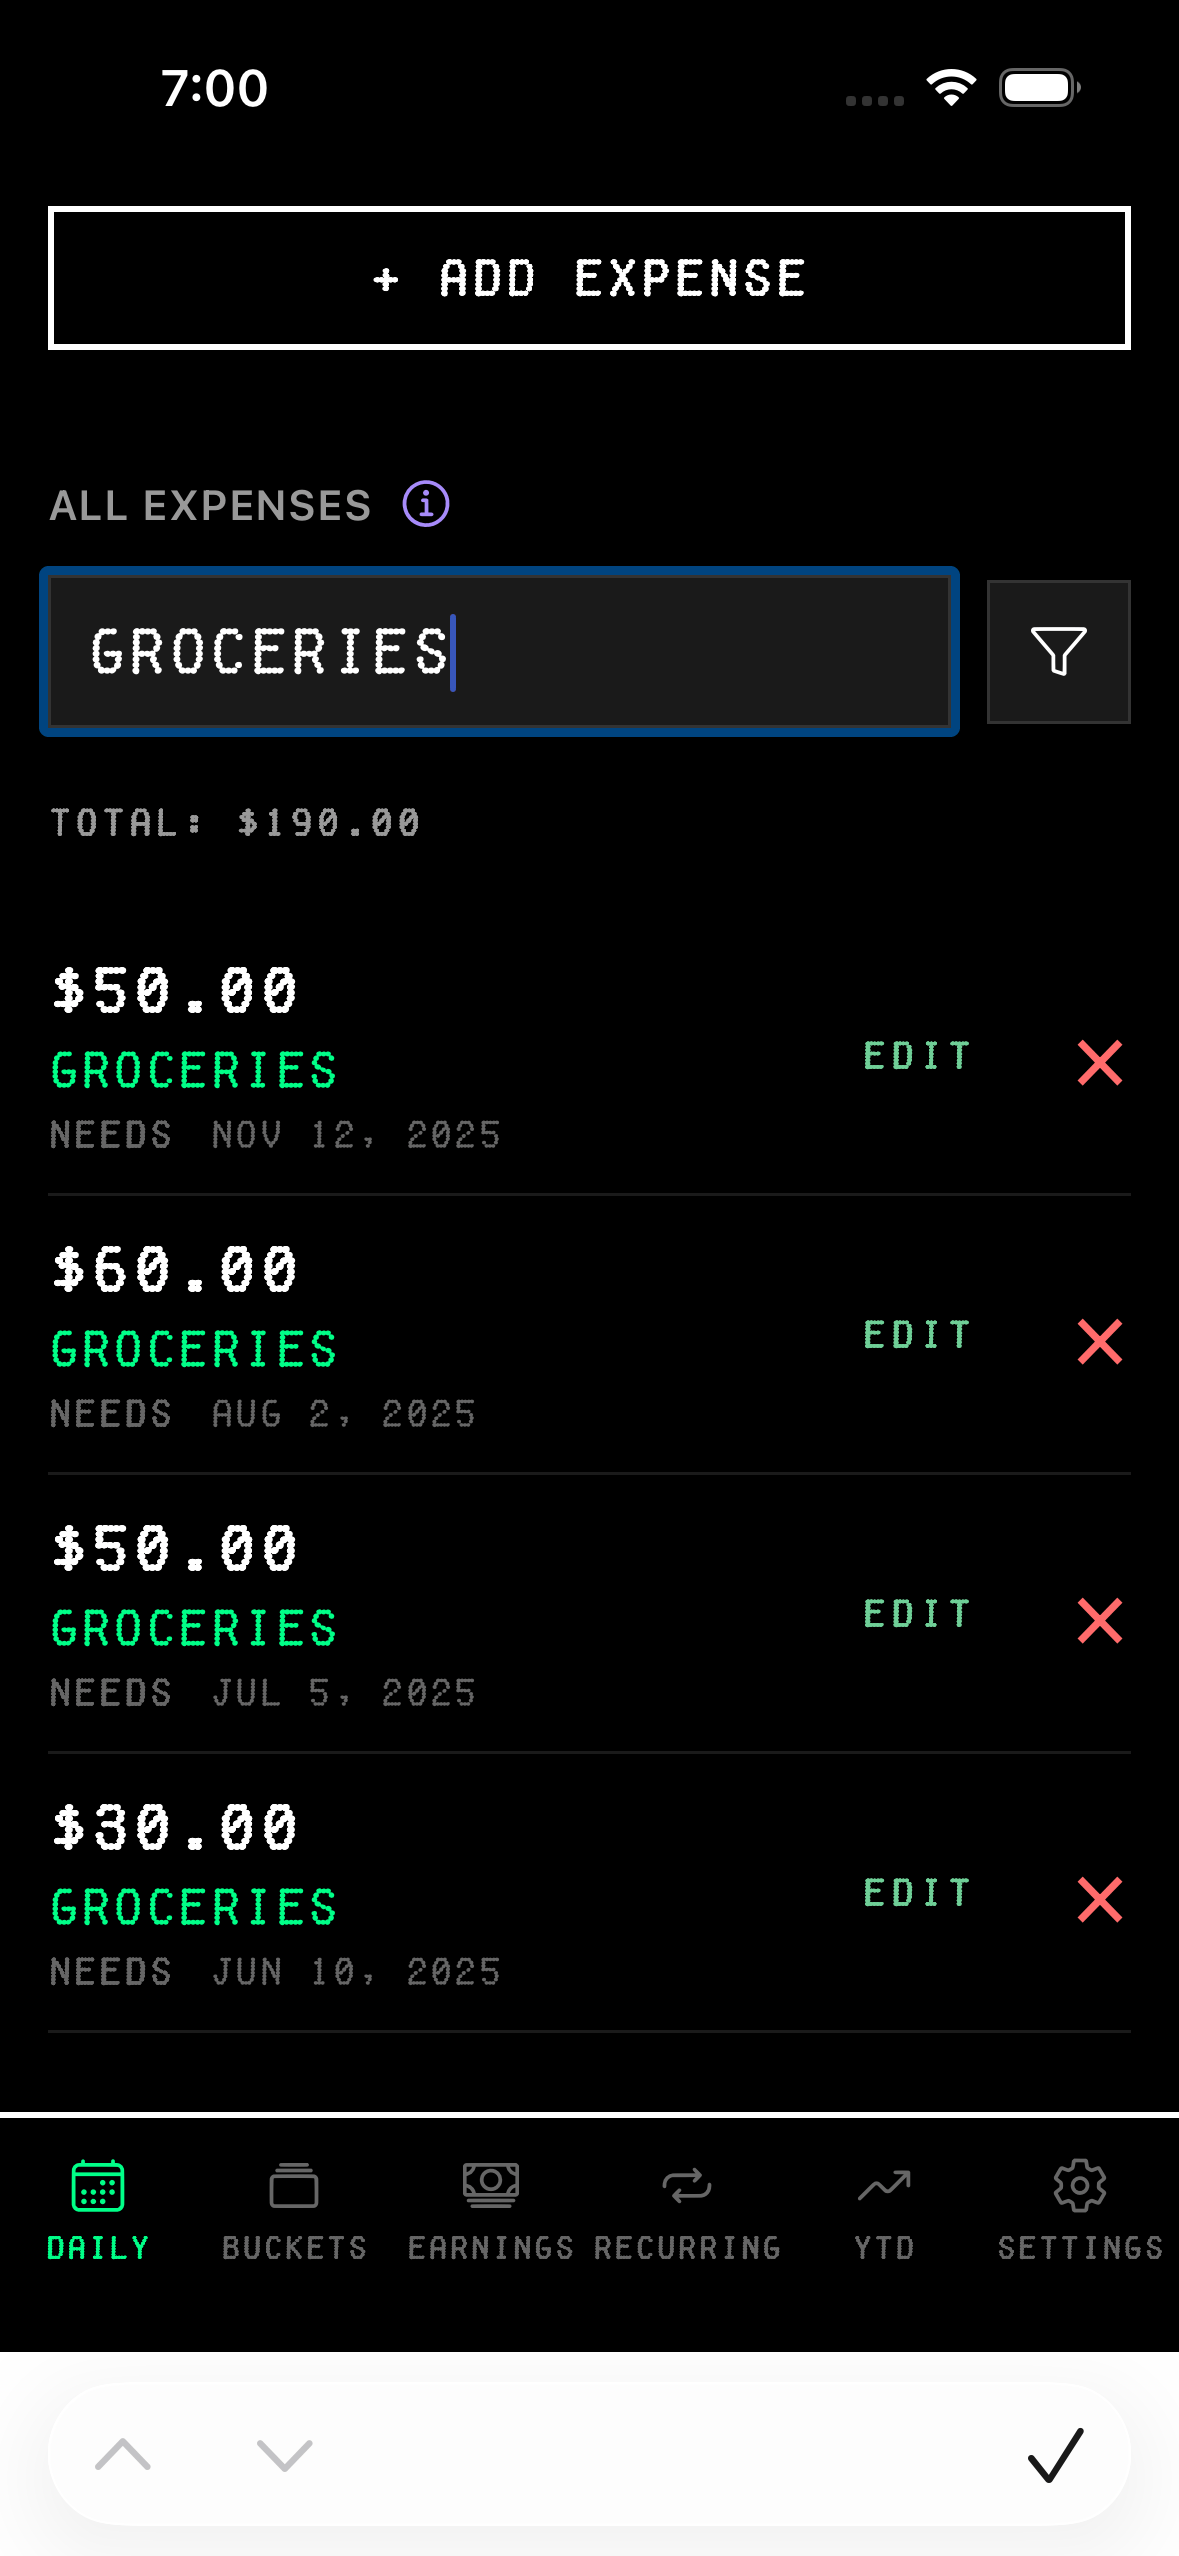
The Daily tab isn't just for tracking your burn rate—it's also where you can search through all your expenses. The search bar at the top of the "All Expenses" list is incredibly powerful and supports multiple search methods.
Search by description: Just type any word or phrase. Searching "groceries" will pull up all expenses with that word in the description. It's case-insensitive, so "Groceries" and "groceries" work the same.
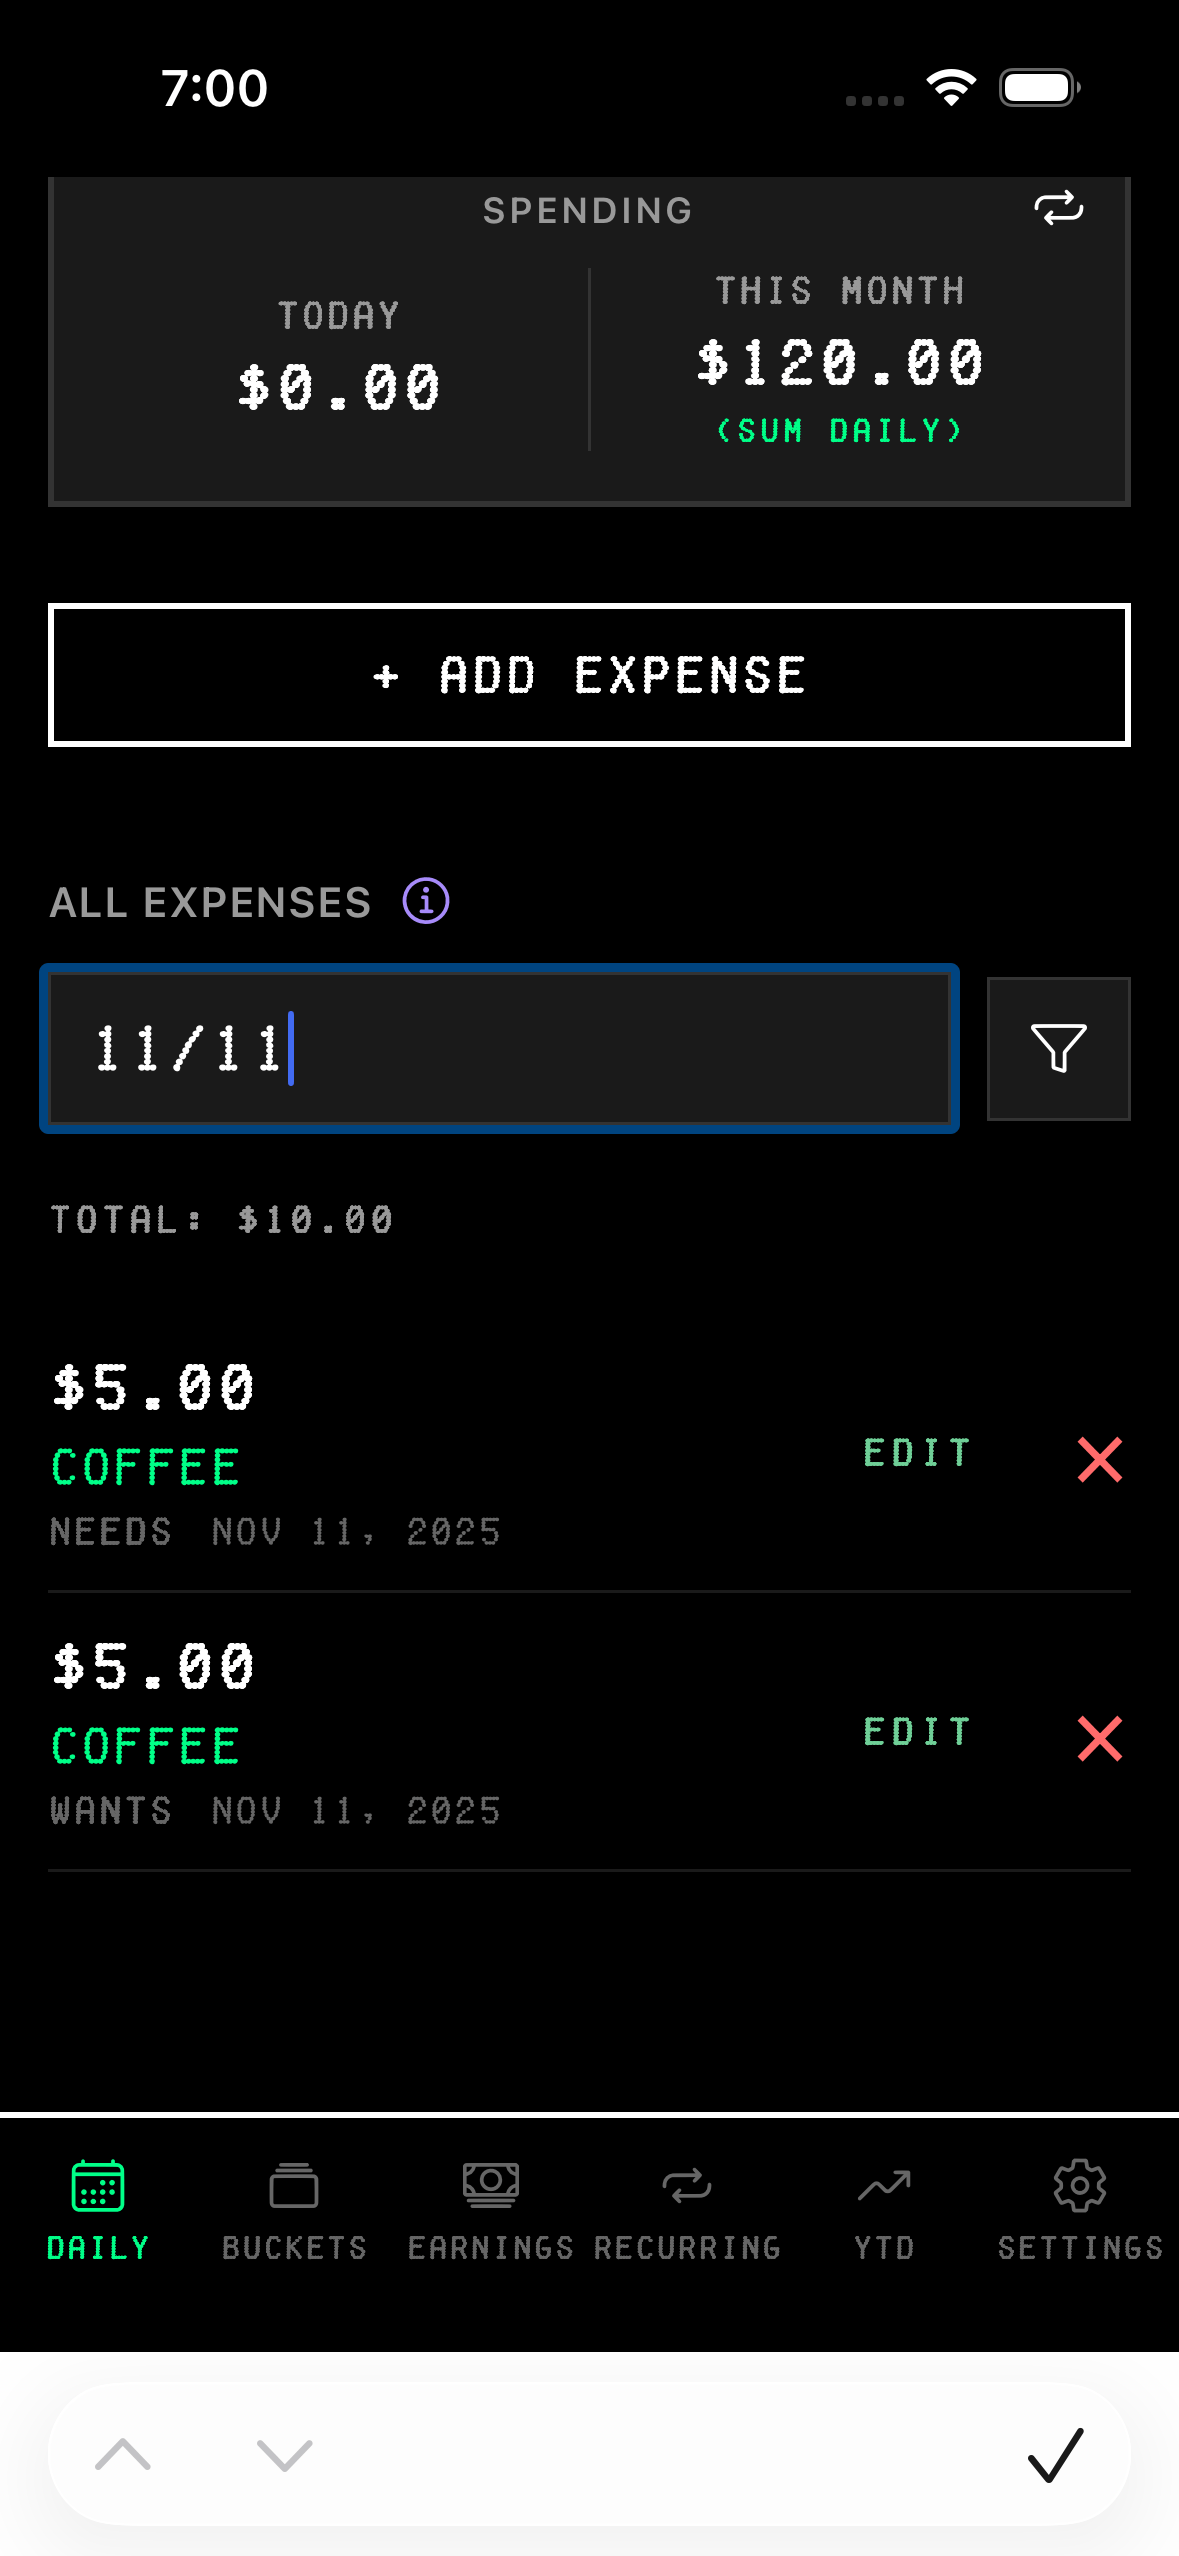
Search by date: You can search by typing a specific date in various formats. Try "nov 12", "11/12", or "nov 12 2025". The app will find all expenses from that day.
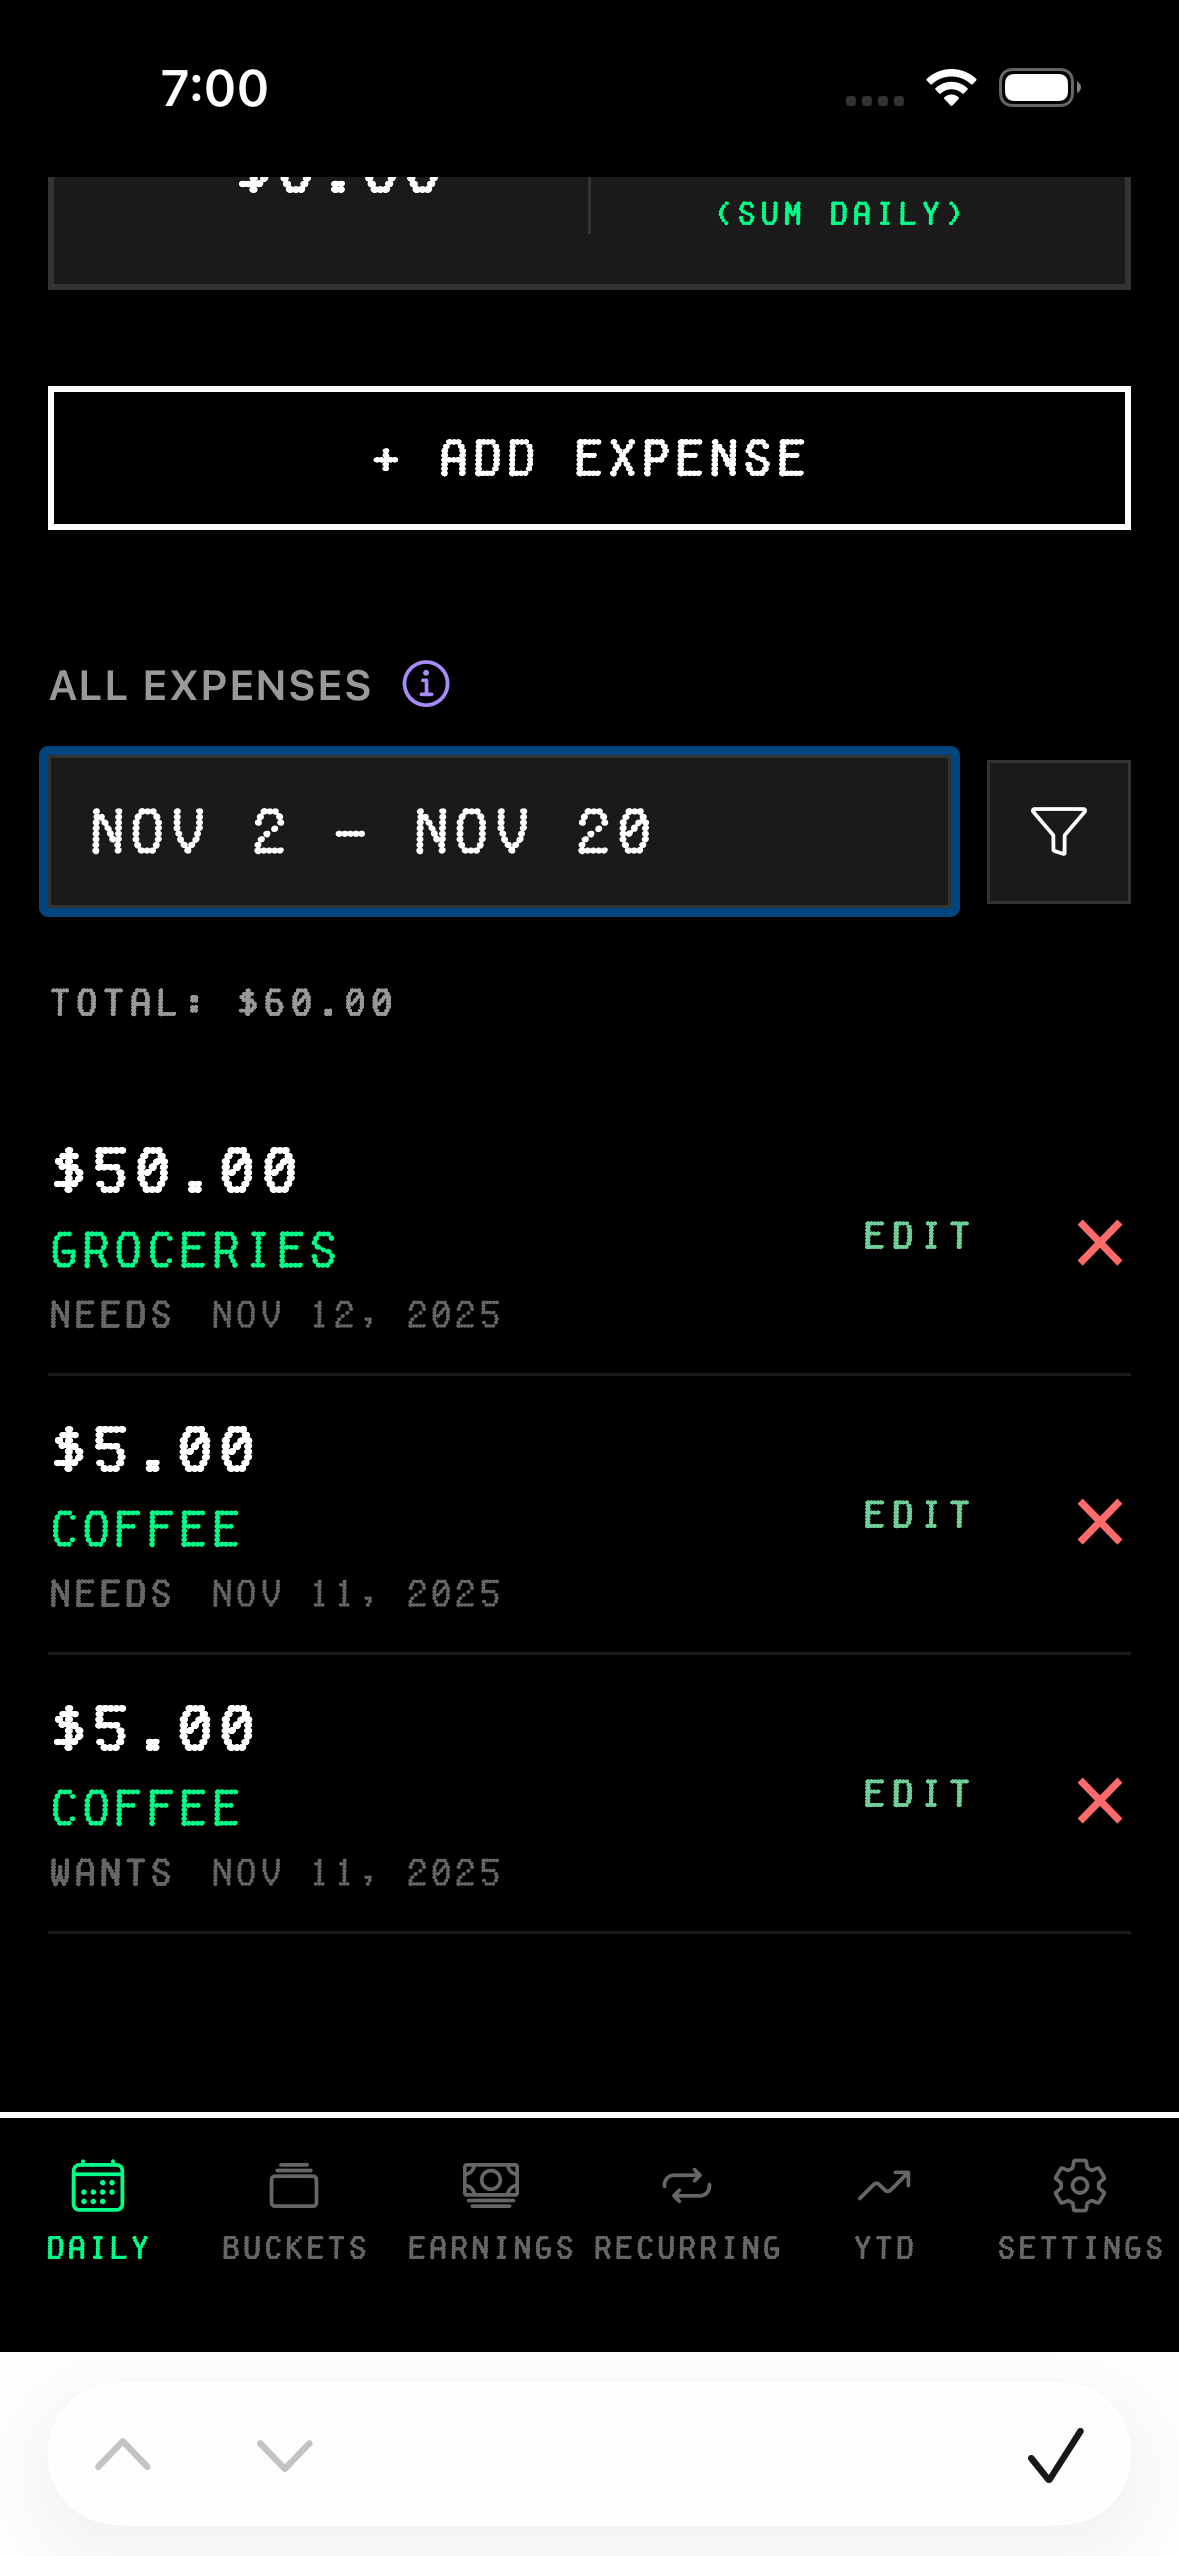
Search by date range: Need to see everything from a specific period? Type a date range like "11/12-11/15" or "nov 3 - nov 15". The app will show all expenses between those dates, inclusive.

Search by exact amount: Looking for a specific charge? Type just the number like "5" or "5.00" and the app will show all expenses that match that exact amount.
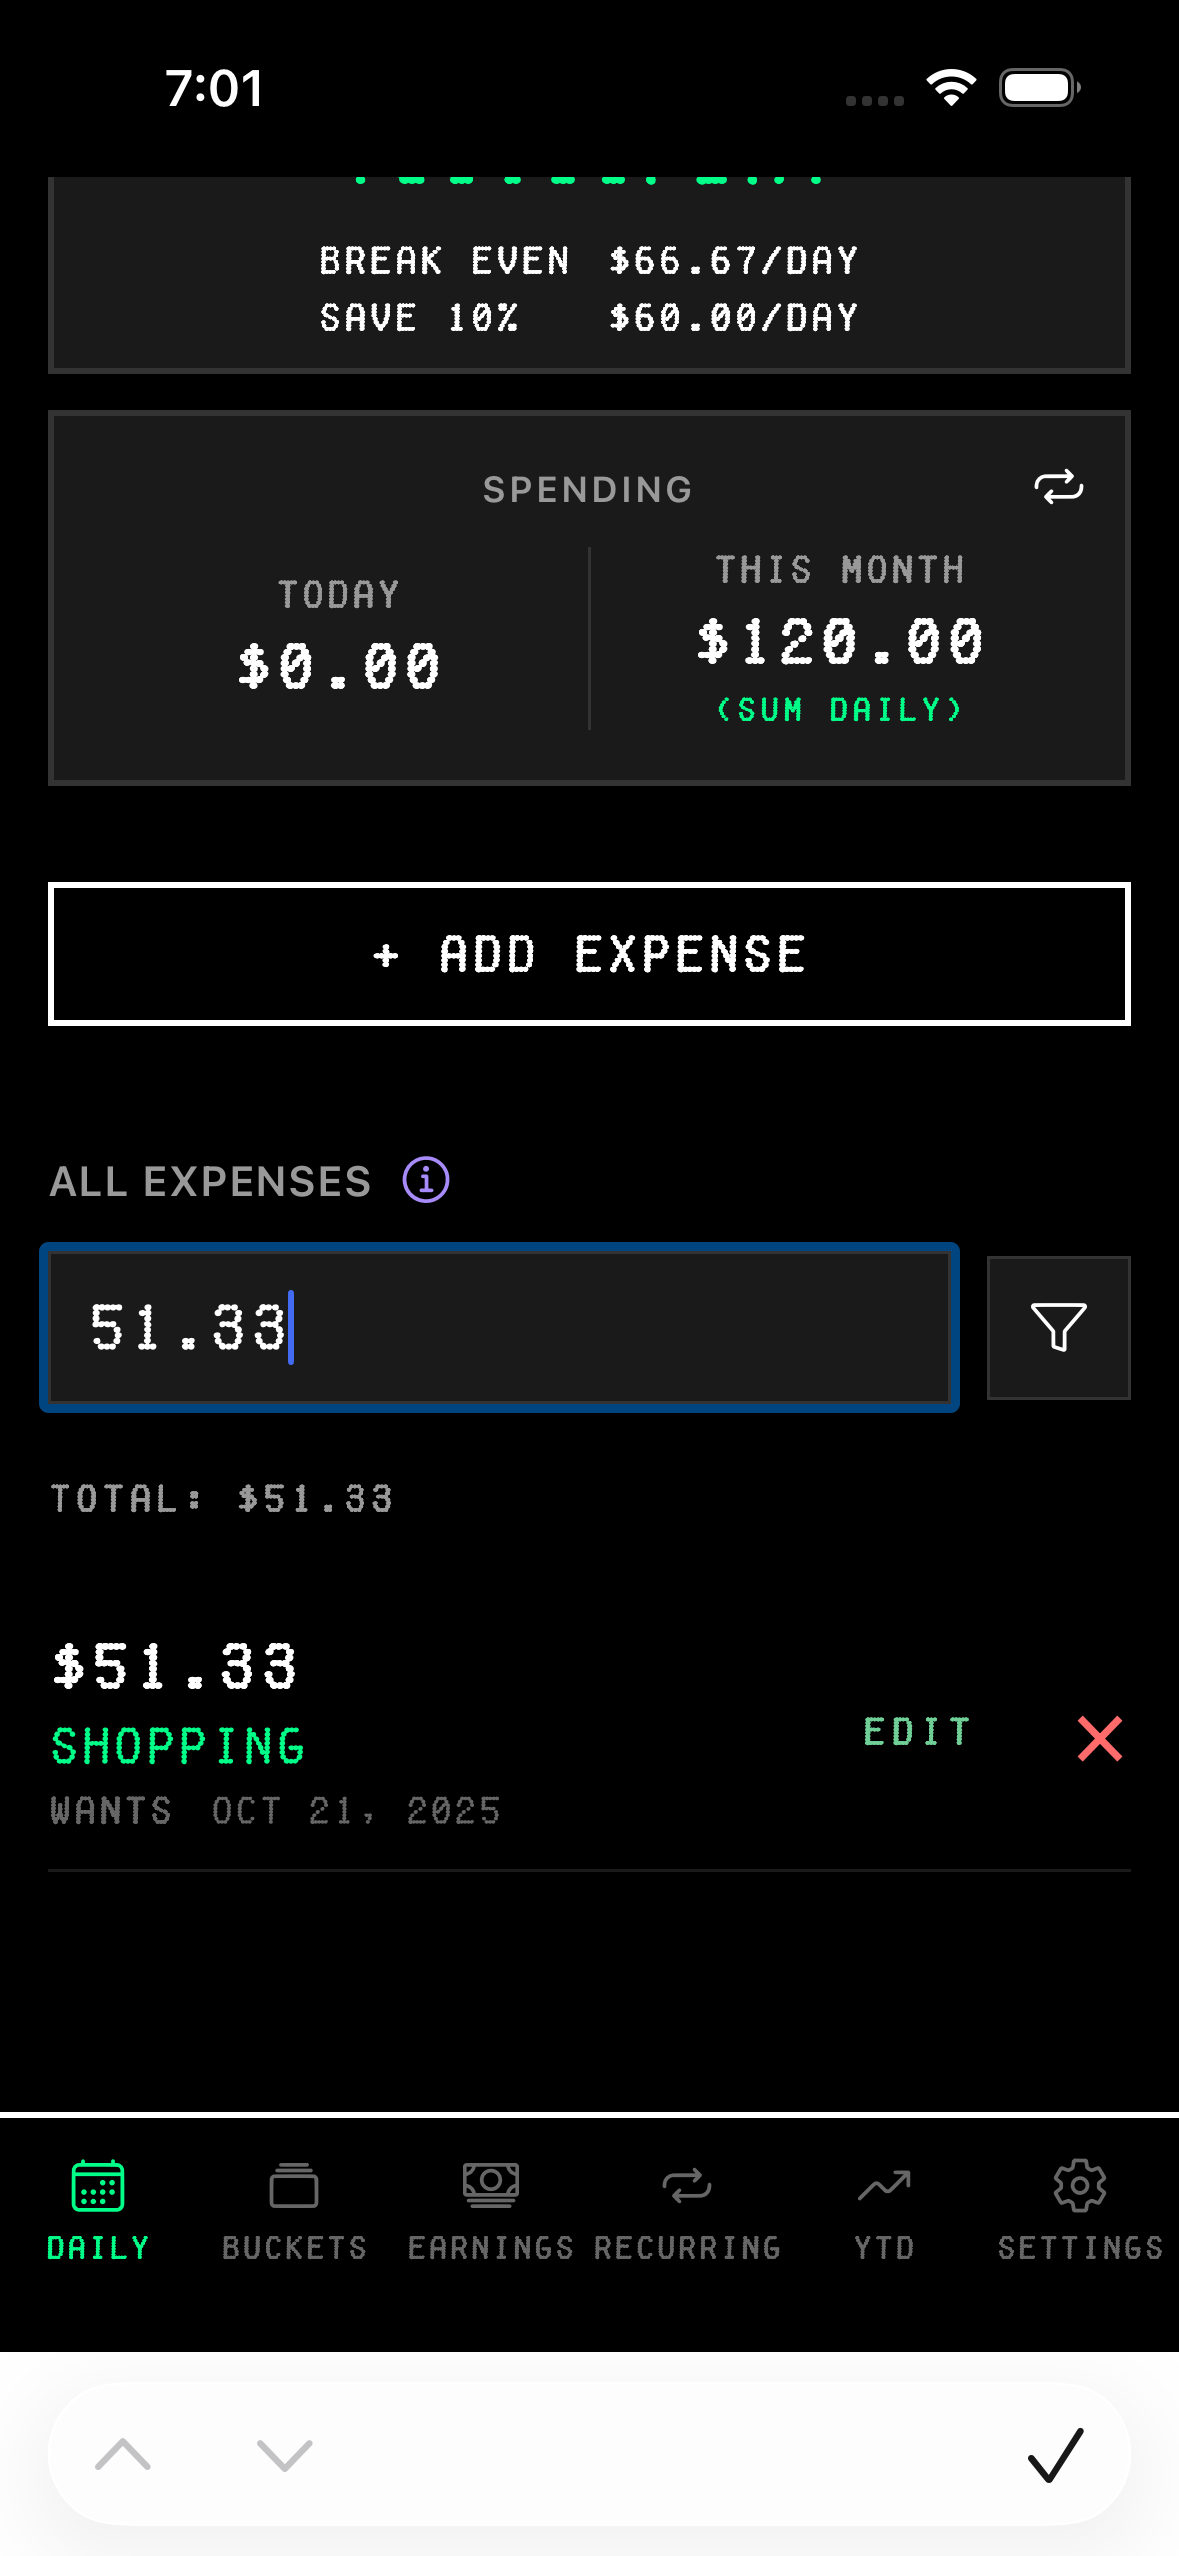
Search by amount range: Want to see all expenses within a price range? Type something like "2-7" or "2.75-3.49" and you'll get everything that falls between those amounts.
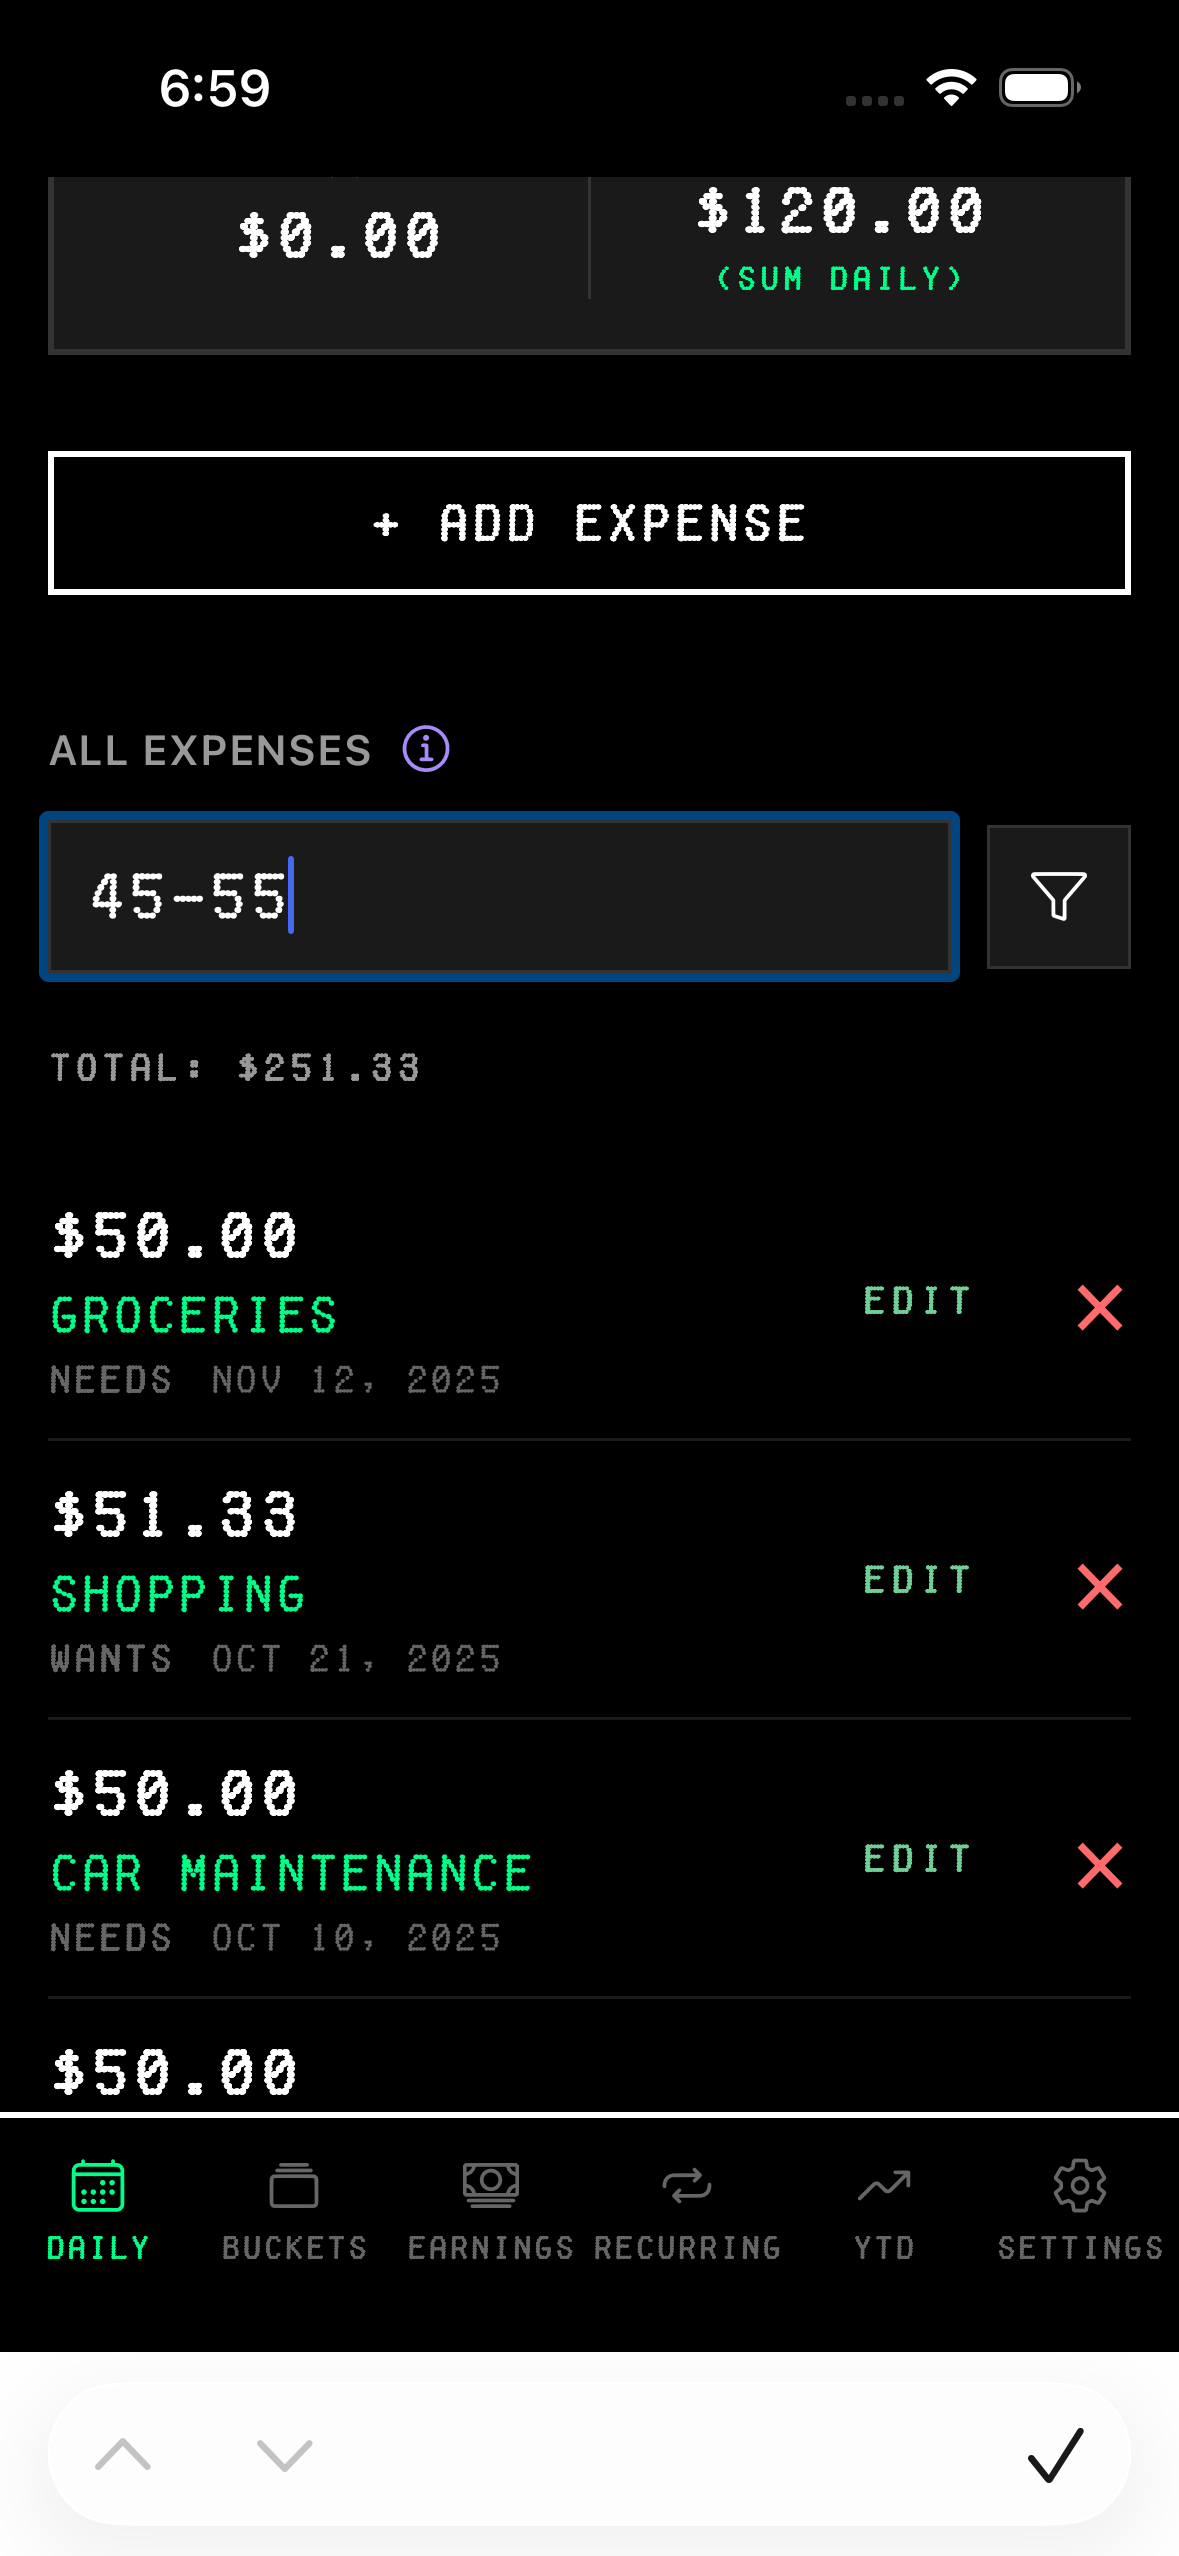
When you have an active search, a small "TOTAL: $XXX.XX" appears below the search bar showing the sum of all filtered expenses. This is useful for questions like "How much did I spend on groceries this month?" or "What was my total spending between the 1st and 15th?"
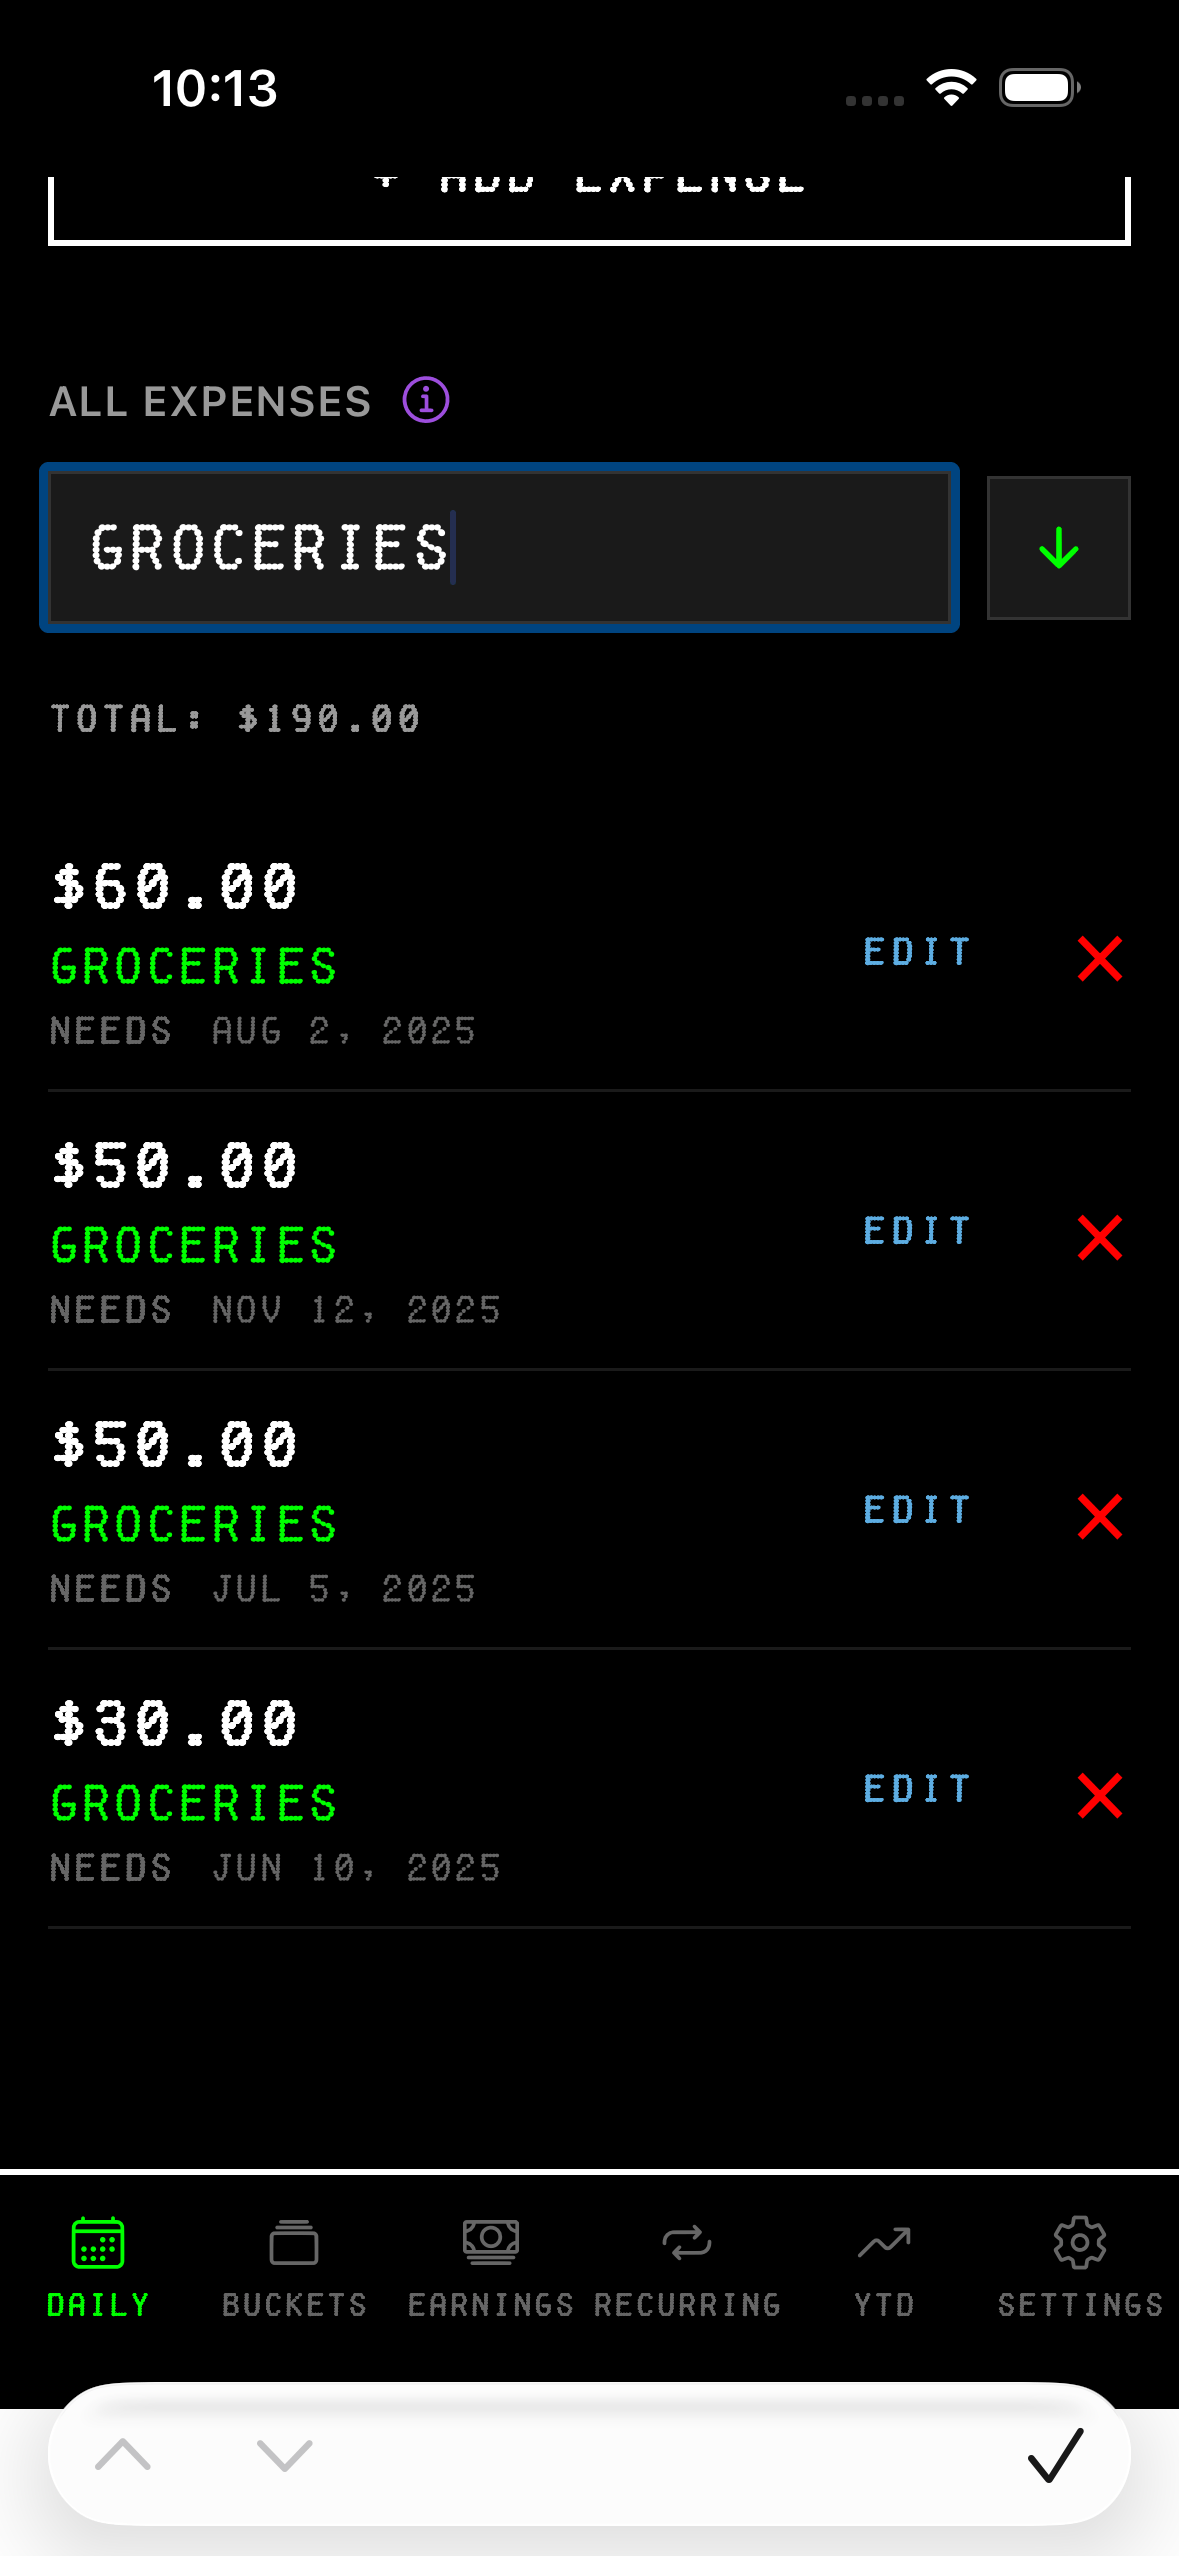
The filter icon next to the search bar lets you sort results by amount instead of date. Click it once to sort largest to smallest, again to sort smallest to largest, and a third time to return to date sorting.
Tracking Your Progress
The Year to Date tab gives you a bigger picture view of how you're doing over time. You'll see your total saved for the year and a breakdown by month showing whether you came out ahead or fell short. Green bars mean you saved money that month. Red bars mean you spent more than you earned.
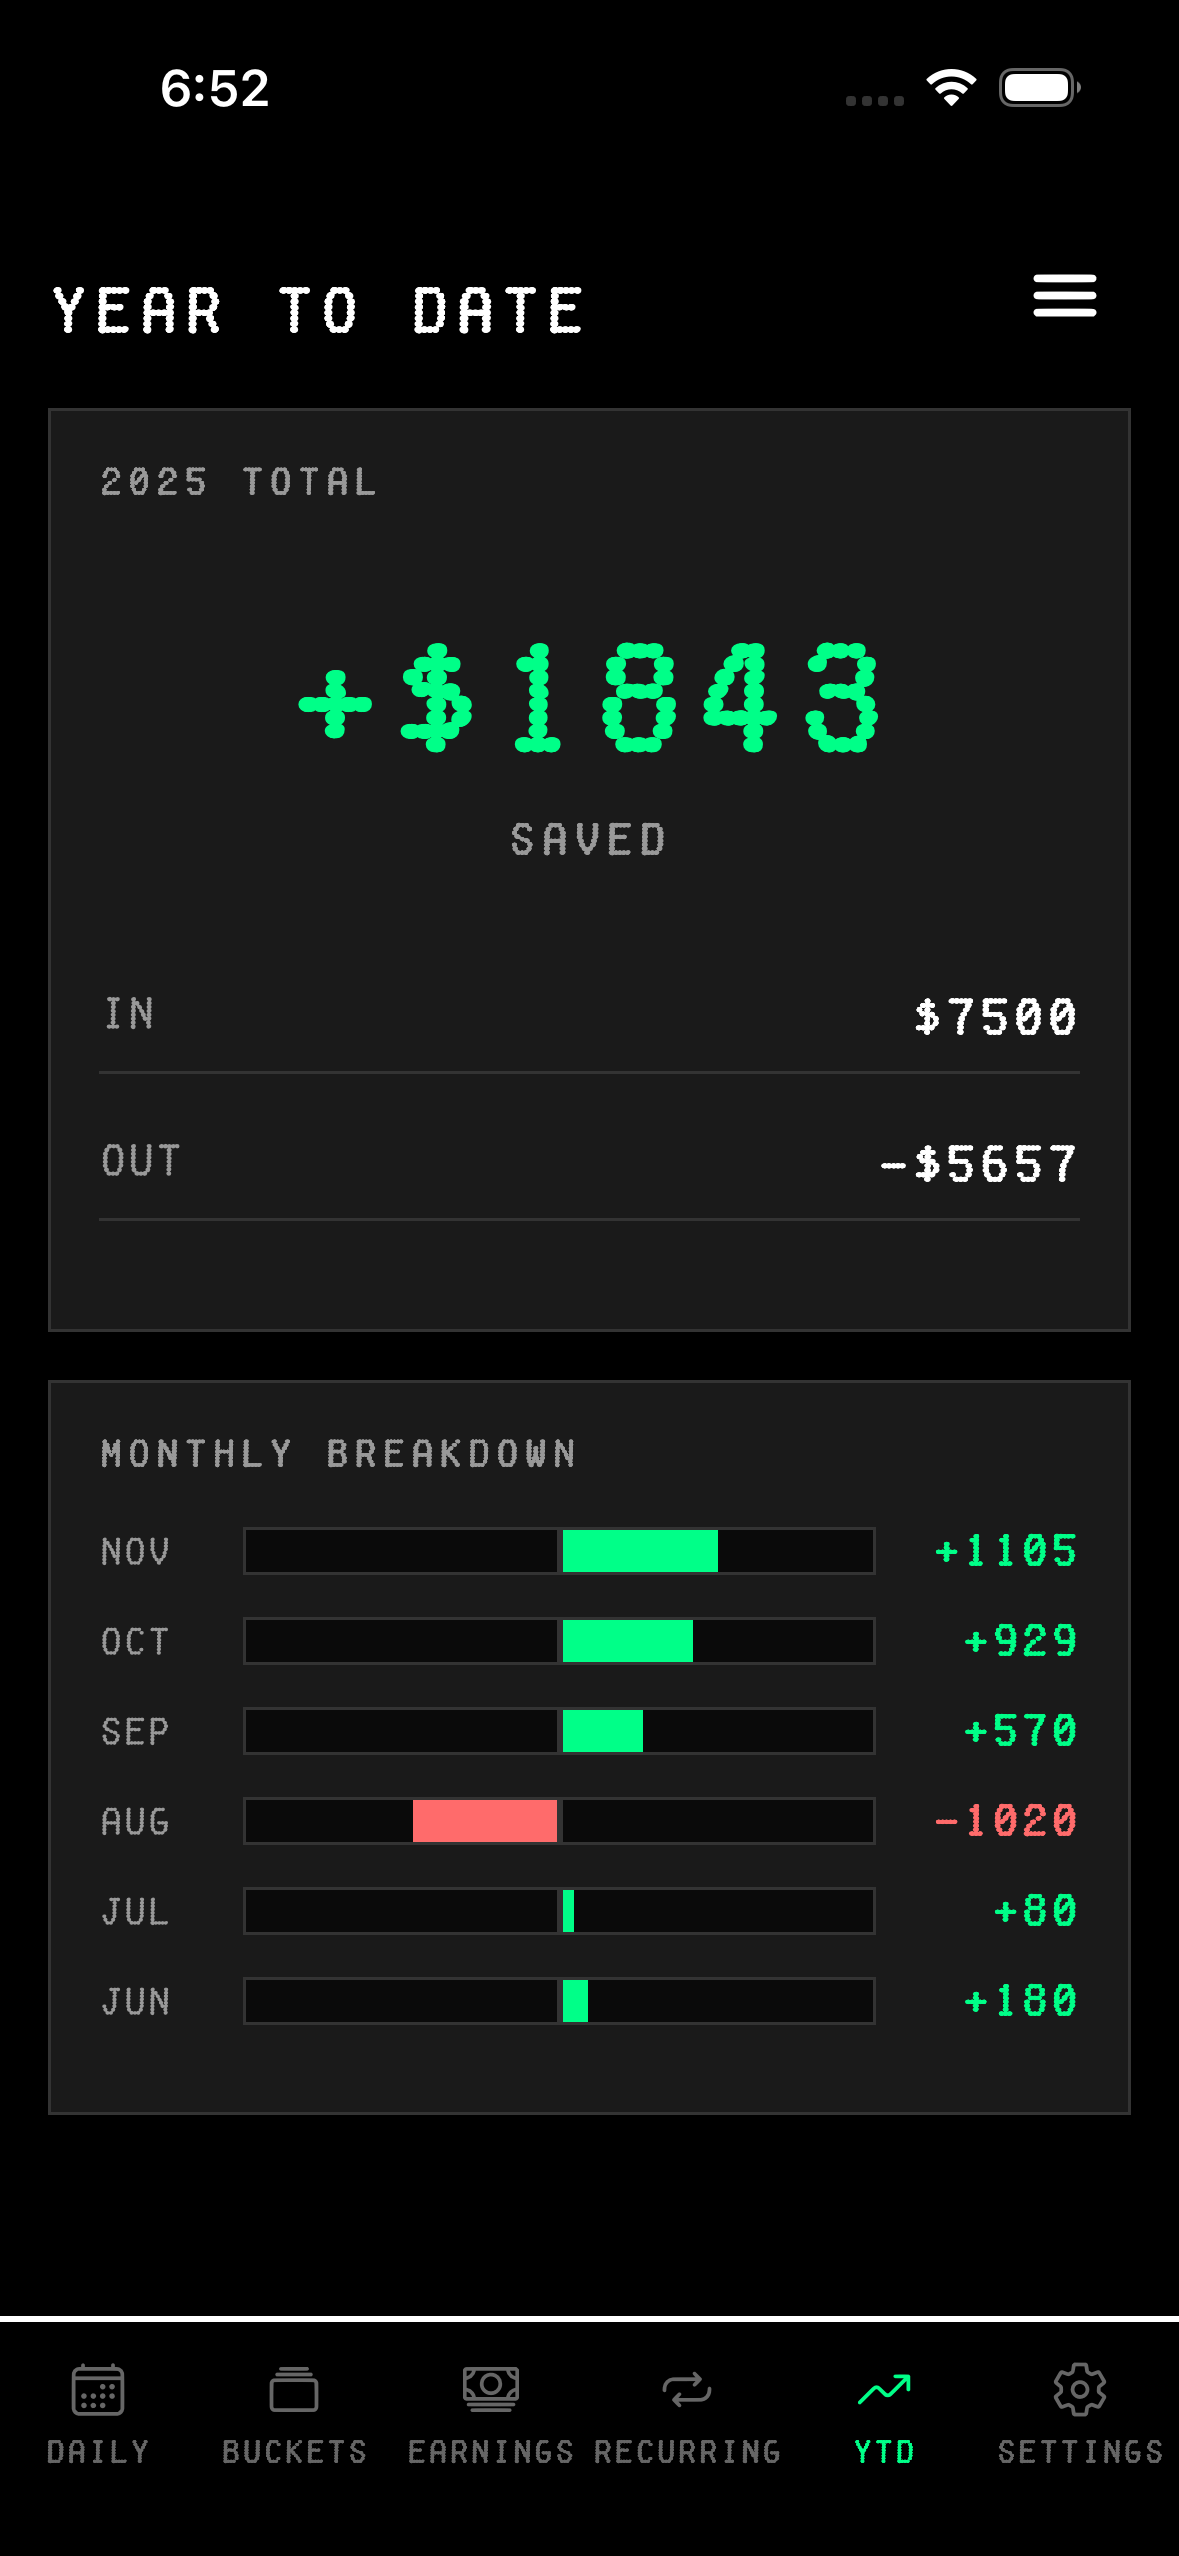
This is where you can see patterns forming. The monthly breakdown helps you understand your habits and adjust before things get out of hand.
That's pretty much it. Add your income, set up your recurring bills, log your expenses as they happen, and watch your burn rate. The app keeps the math simple and the interface clean so you can focus on the only thing that matters: staying on budget.