Every reporting team is essentially chasing the same thing. Your systems spit out workbooks like performance, holdings, allocations and key figures. Your clients expect a factsheet that looks identical every period, with current numbers updated. And in between those two things sits a person copying, pasting, computing, reformatting & checking, under deadline, where a single mispaste is a client-facing error.
We built Octigen to close that gap. This post walks through how - using a real fund factsheet - and makes the case for why we built it the way we did. If you'd rather watch, here's the walkthrough video:
The choice nobody wants to make
Until now, automating recurring reporting meant picking your poison.
Option one: hand it to a partner or internal engineers. Build a proper pipeline that ingests the data, reshapes it, and populates the template. It works - and it's reliable. But it takes months, and when it's done, your monthly report lives in an engineering queue or with your technology partner. Every layout tweak, every new share class, every "can we move that chart" becomes a ticket. The people who actually own the report - the analysts - can't touch it.
Option two: hand it to AI. Faster to start, but it brings two problems that matter enormously for something a client receives. First, it's non-deterministic: the same data can come out different next month, so you never stop checking every number. Second, it's a black box: when something's wrong, all you can do is shout prompts at it, and fixing one thing quietly breaks another. Neither is acceptable when the output is a regulated, client-facing document.
Slow and reliable, or fast and unauditable. That's the trade-off we set out to resolve for good.
What we were actually chasing
The real prize is a reporting pipeline an analyst can build and run on their own - without an engineer in the loop, and without having to accept a black box in production. We use AI where human judgement genuinely helps, and a deterministic machine everywhere the numbers matter.
That principle shapes everything below.
The four pieces of an Octigen pipeline
Under the hood, producing a report requires four components working together, and it helps to name them:
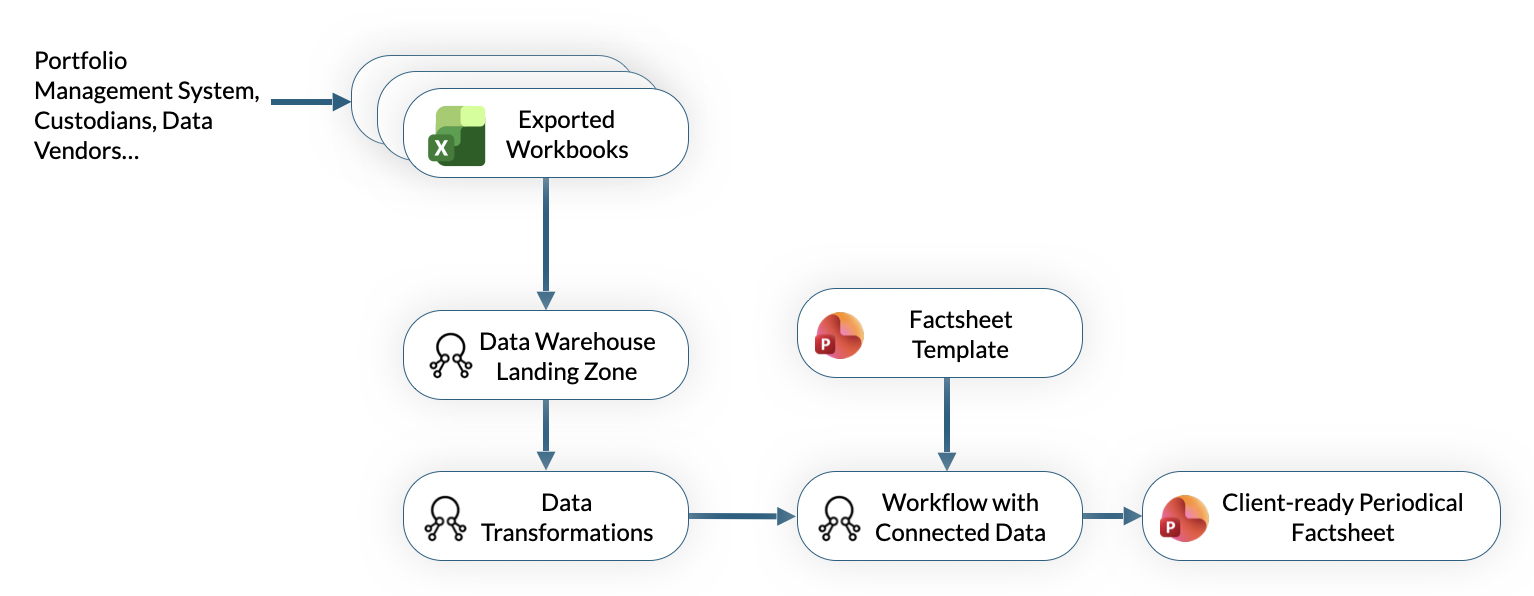
The template is your PowerPoint, uploaded once, with each shape labelled - this is a chart, this is a table, this text box is the fund name. Your branding and formatting live here.
Data collections are smart containers, one per source sheet, each of which knows how to find the right block of data, e.g. for a given fund and valuation date.
Transformations reshape raw sheets into exactly what a chart or table needs: keep these columns, filter to one fund, sort, transpose, compute a return column.
And the workflow wires each transformed table to its shape on the slide.
After setting those four up once, producing the report becomes simple: new data goes in, a finished factsheet comes out.
Hand Octigen an example, and it builds the pipeline for you
You can build all four pieces by hand - and for unusual data, you might want to. But we thought a machine should be able to work most of it out by looking at an example. So we built Agentic Report Onboarding.
Our agent needs three things: your template, the source workbooks for one concrete month, and - importantly - a finished report built from exactly that data, e.g. last month's factsheet you already produced. That sample is the ground truth: the agent checks its own work against it, scores the result, and improves it over several rounds.
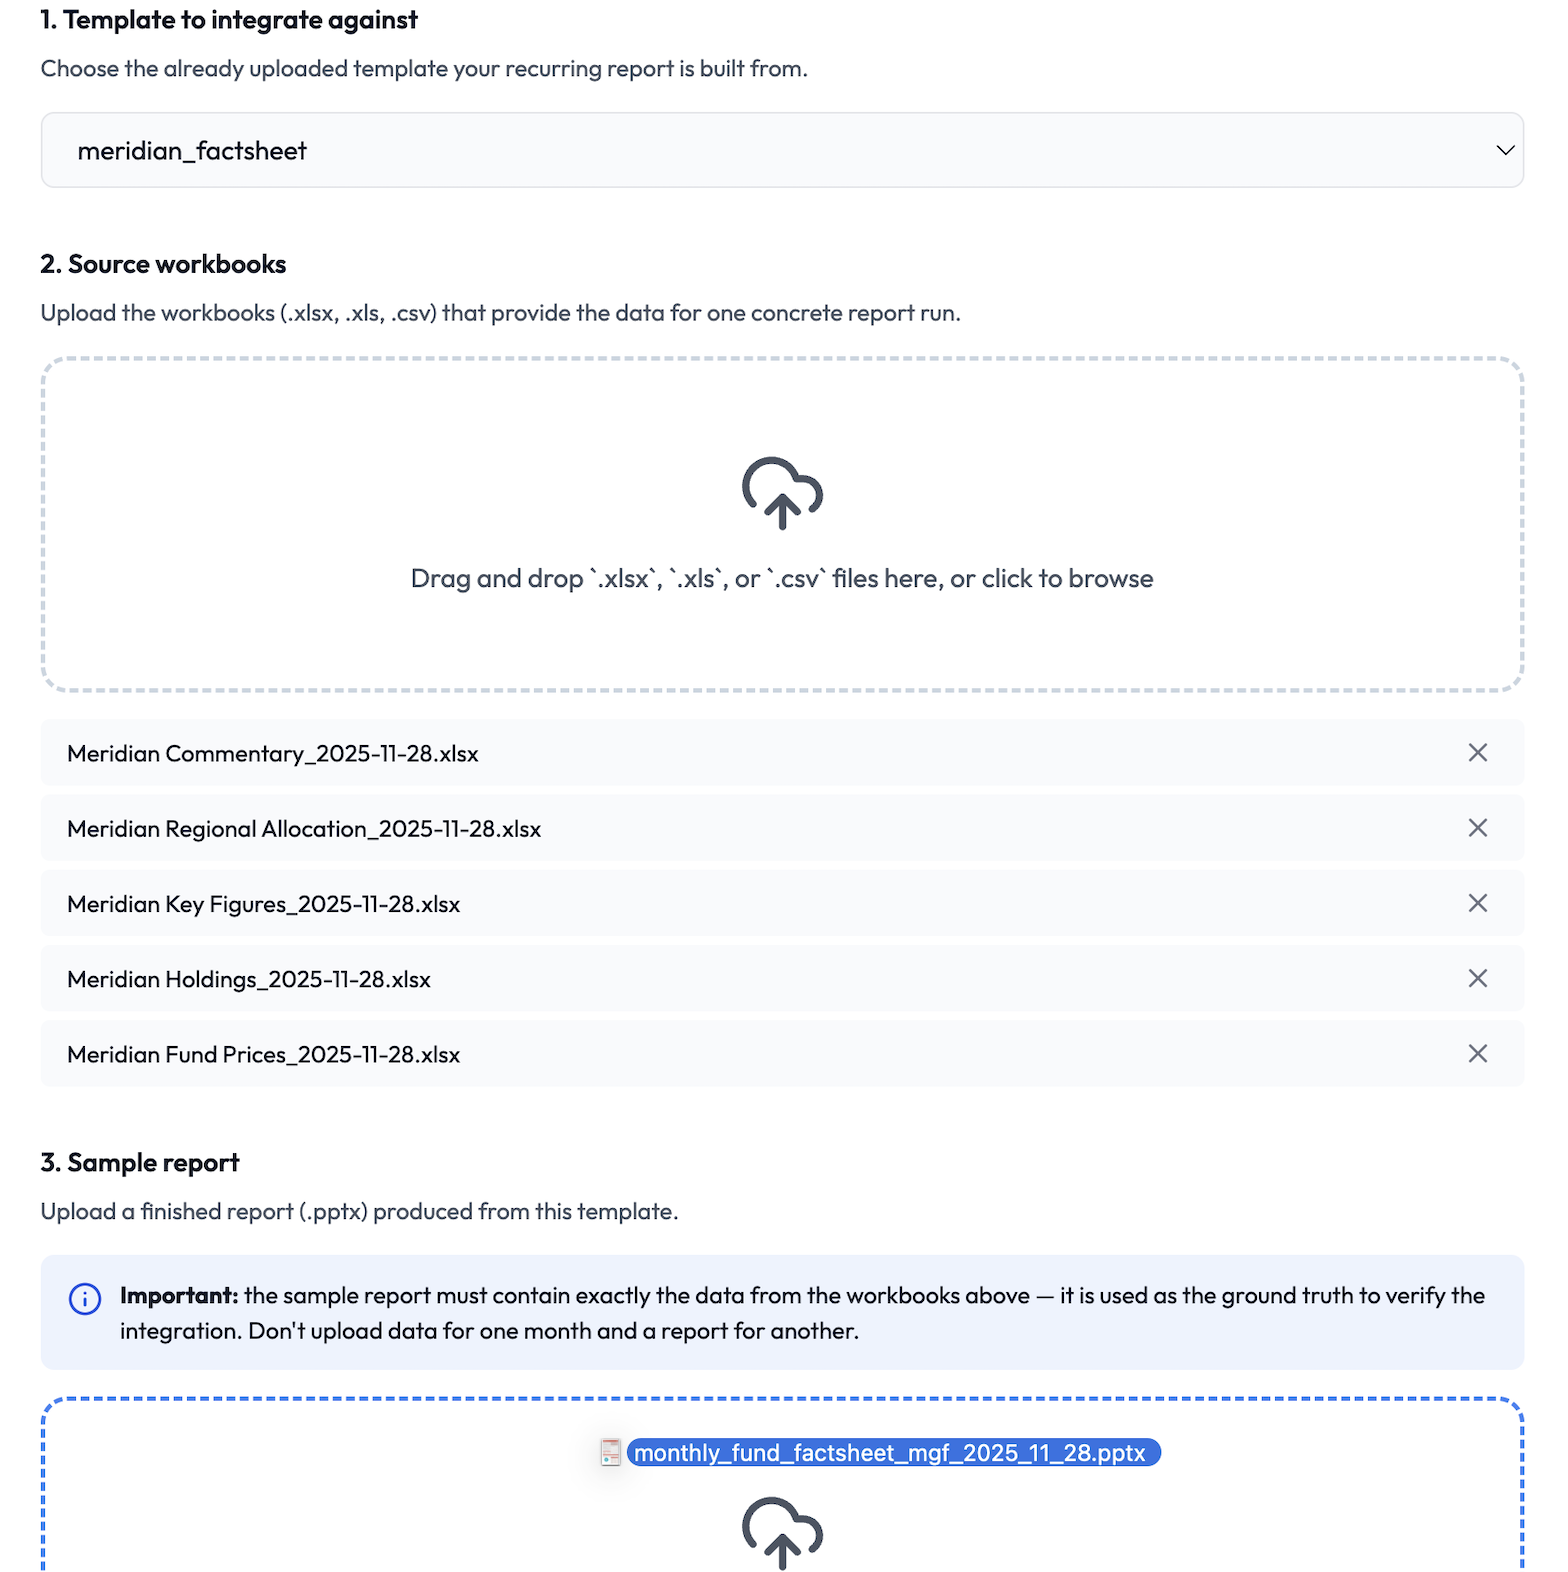
Before it starts, Octigen counts the shapes it would need to connect and shows you the cost up front, so there's no open-ended meter running. And you're only charged for shapes that actually come out well - if the agent can't get one to a good score against your sample, you don't pay for it.
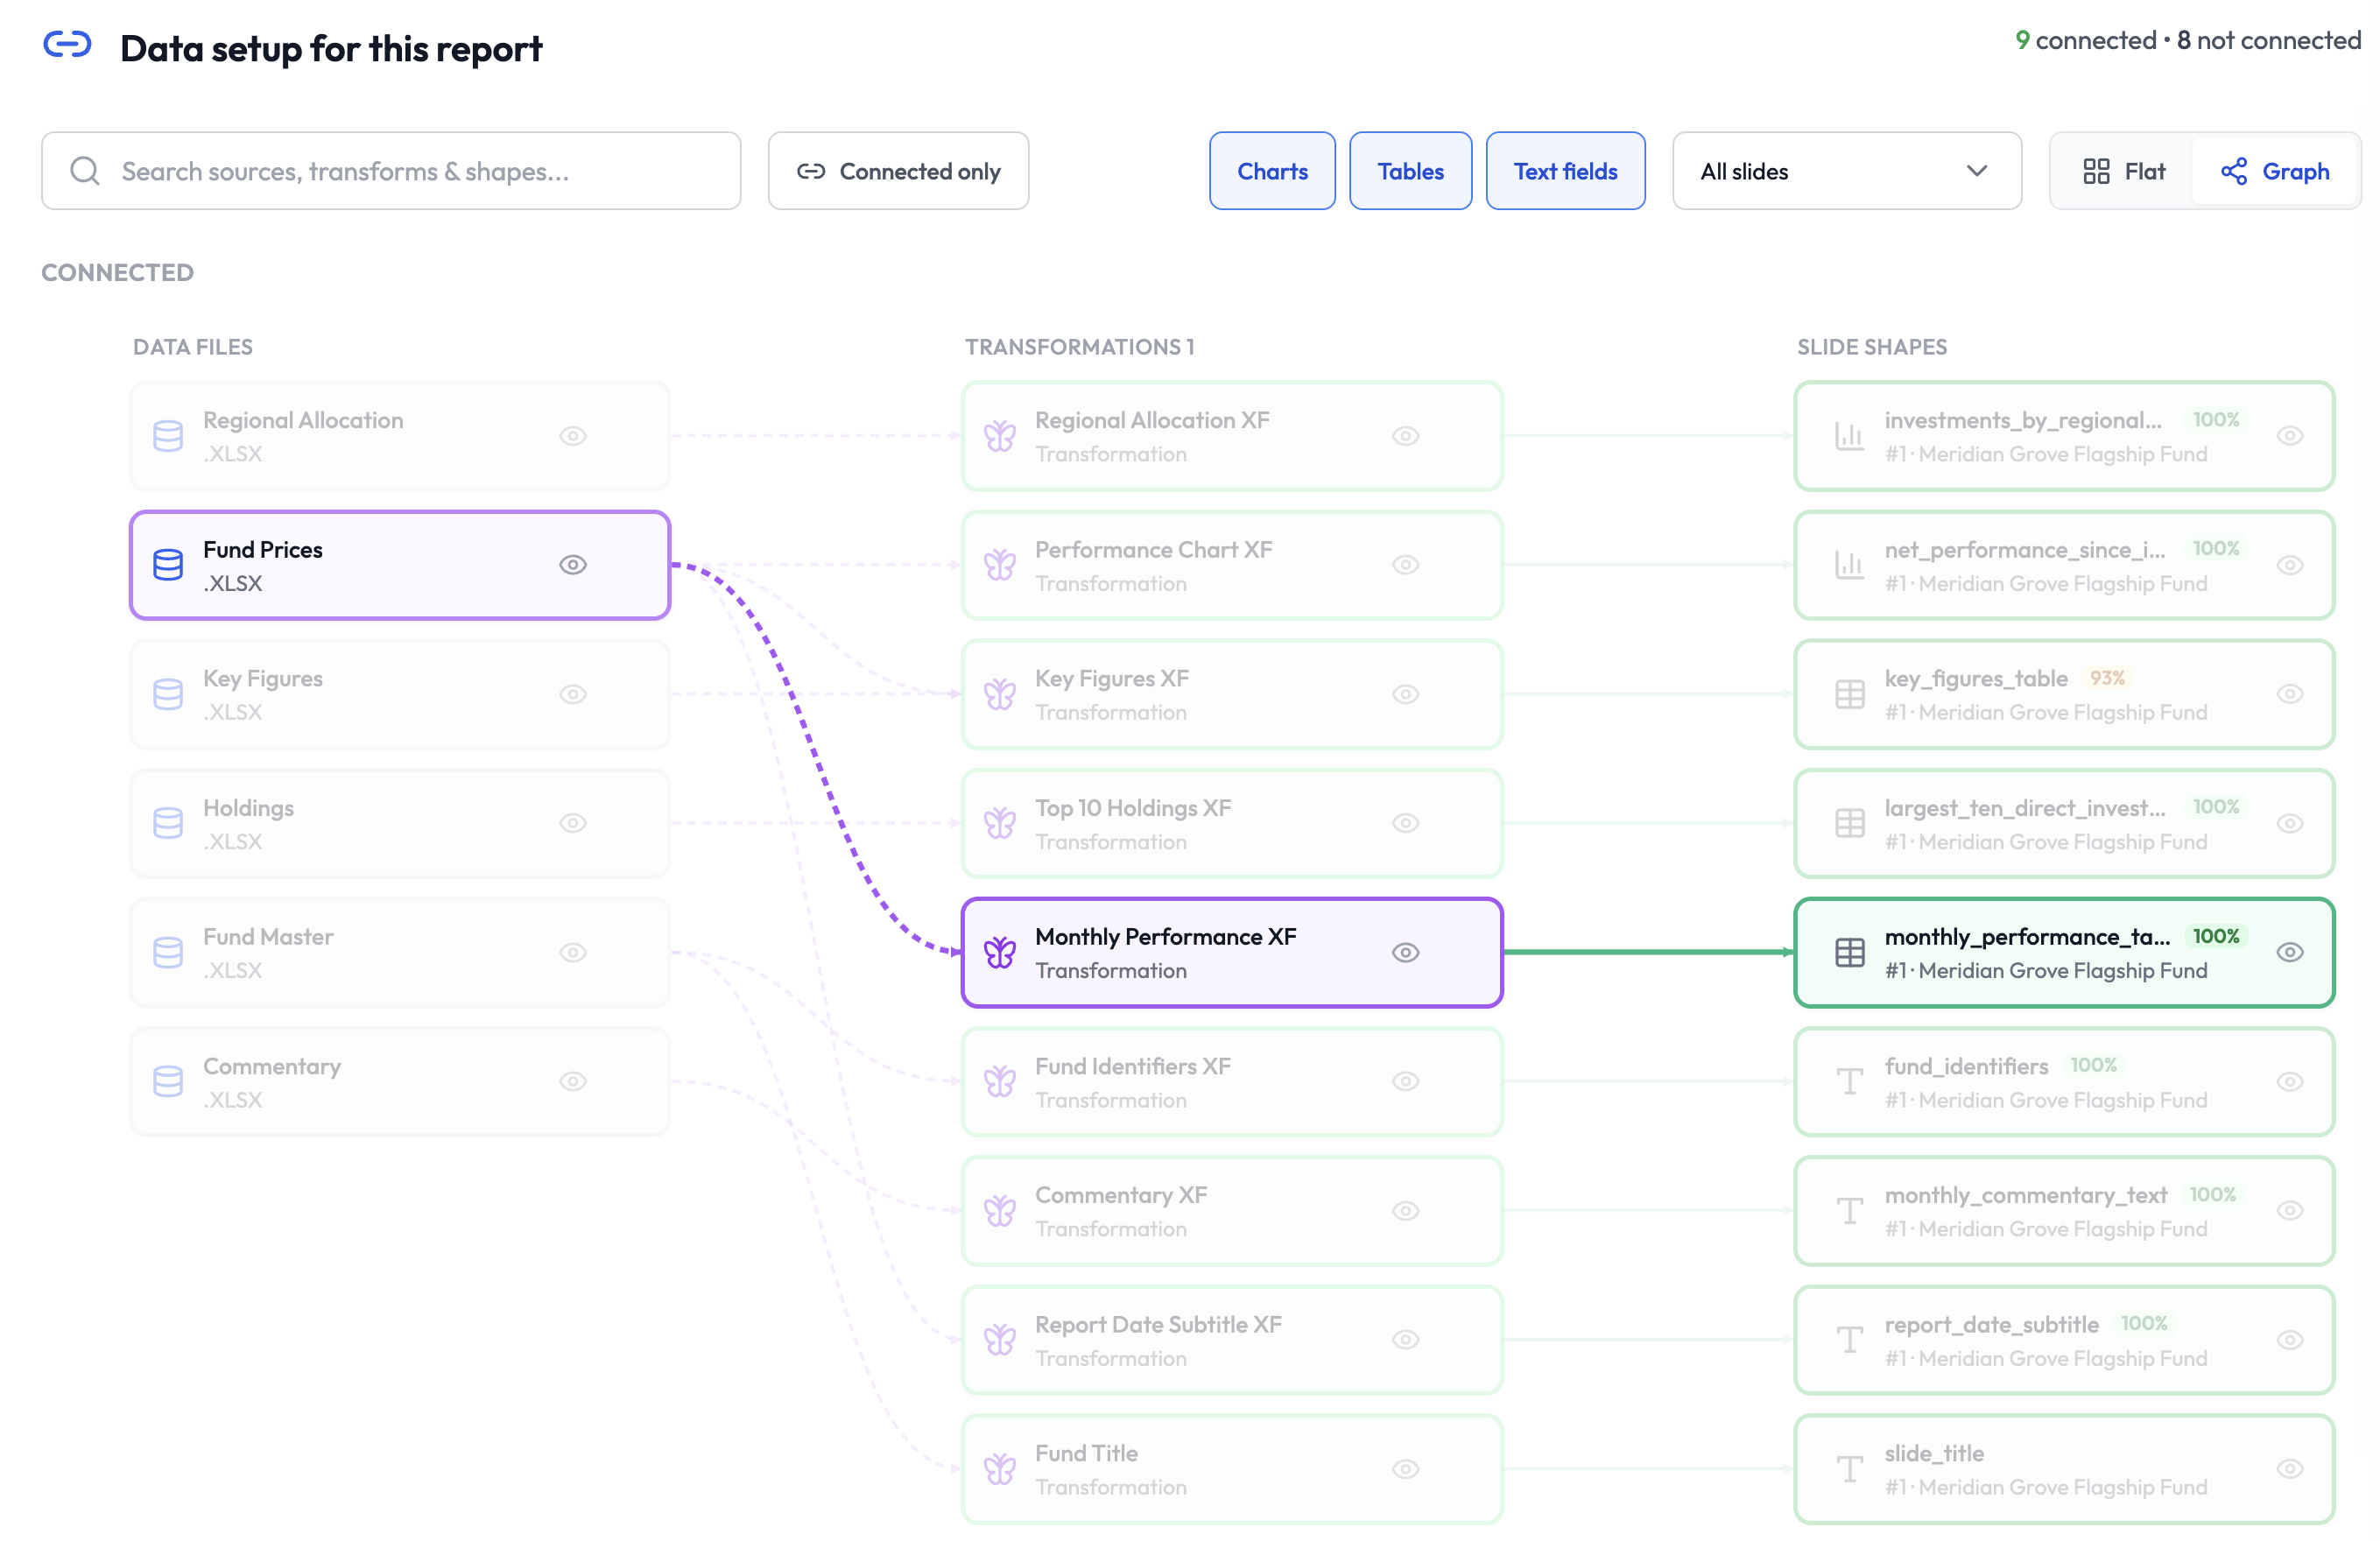
Then the agent runs on its own. For our sample factsheet with 9 connected report elements (charts, tables and text) the whole thing finished unattended within 15 minutes, and the entire pipeline was built end to end while we watched the graph assemble itself. We and our prospects in the financial reporting sector have tested the process also with more complex reports, and the results are equally promising.
You can see - and change - everything it built
This is the part that matters most, and it's where Octigen deliberately breaks from the black-box approach we've seen everywhere nowadays.
When onboarding finishes, you get the whole pipeline laid out: source files on the left, transformations in the middle, the shapes on your slide on the right. Every node previews the data flowing through it. Nothing is hidden.
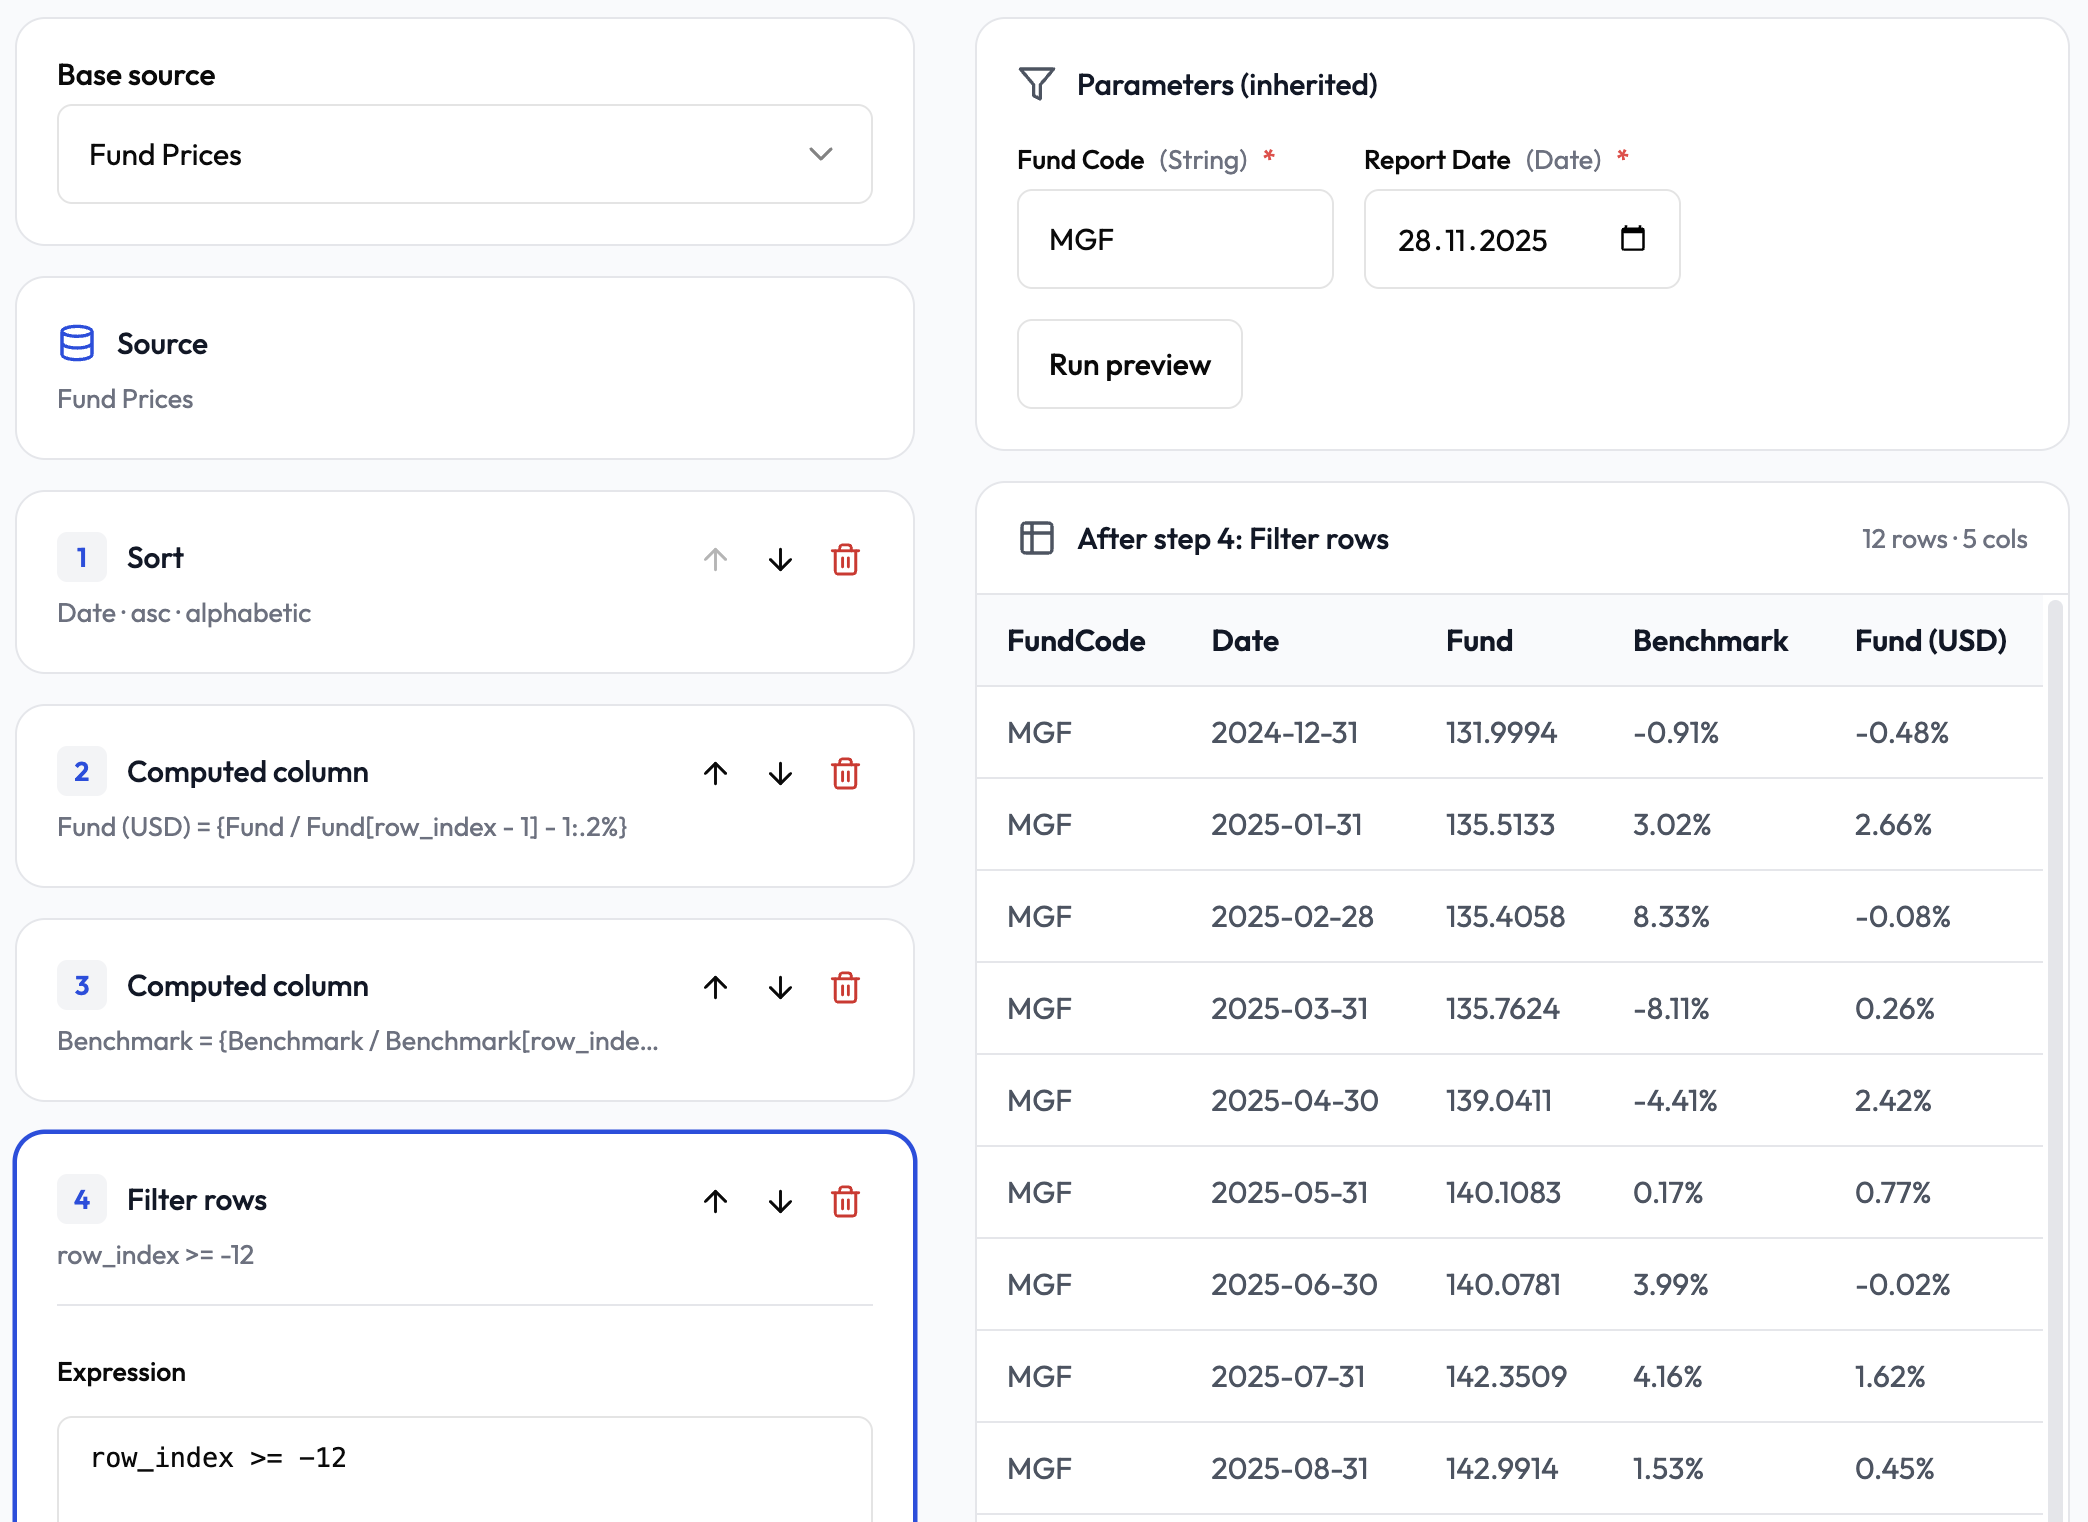
Open any transformation and it's a list of plain, readable steps - take the fund prices collection, filter to this fund, compute a monthly return column, format the dates - with the data visible after every single step. You can change any of them, or write one yourself. The AI does the tedious eighty percent; what it hands back is something you can read, check and correct, rather than something you have to trust.
This review step is where the remaining twenty percent gets done, and it's the point of the whole design. In our example, the agent got the charts, tables and figures right, and from there we spent a few minutes refining - including adding an integration it was never asked for: pulling each fund's monthly commentary from a separate Excel workbook. You can do that in two ways: describe what you need to the built-in data-integration assistant and let it draft the steps for you, or build them yourself in the same plain, step-by-step interface. Either way, the automated build plus this hands-on review is what takes a first-time report all the way to client-ready - and for this factsheet, the whole thing still came in way under an hour.
Next month takes a minute
Once the pipeline exists, the recurring job is as quick as:
- Drop the new workbooks into the landing zone and they match themselves to the right collections.
- Start the workflow, enter the fund and the valuation date.
- Generate.
The whole thing takes less than a minute. No AI runs during this step. Every value on the slide is resolved from your data by rules you can inspect - the same data produces the same report, every time. That determinism isn't just a nice-to-have; it's the only way an automated report is usable for client reporting.
Where AI belongs - and where it doesn't
That's the whole idea in one picture: We use AI for onboarding, to create a reporting pipeline with an analyst reviewing every step it takes. For production on the other hand, we have a deterministic machine where nothing should be left to chance.
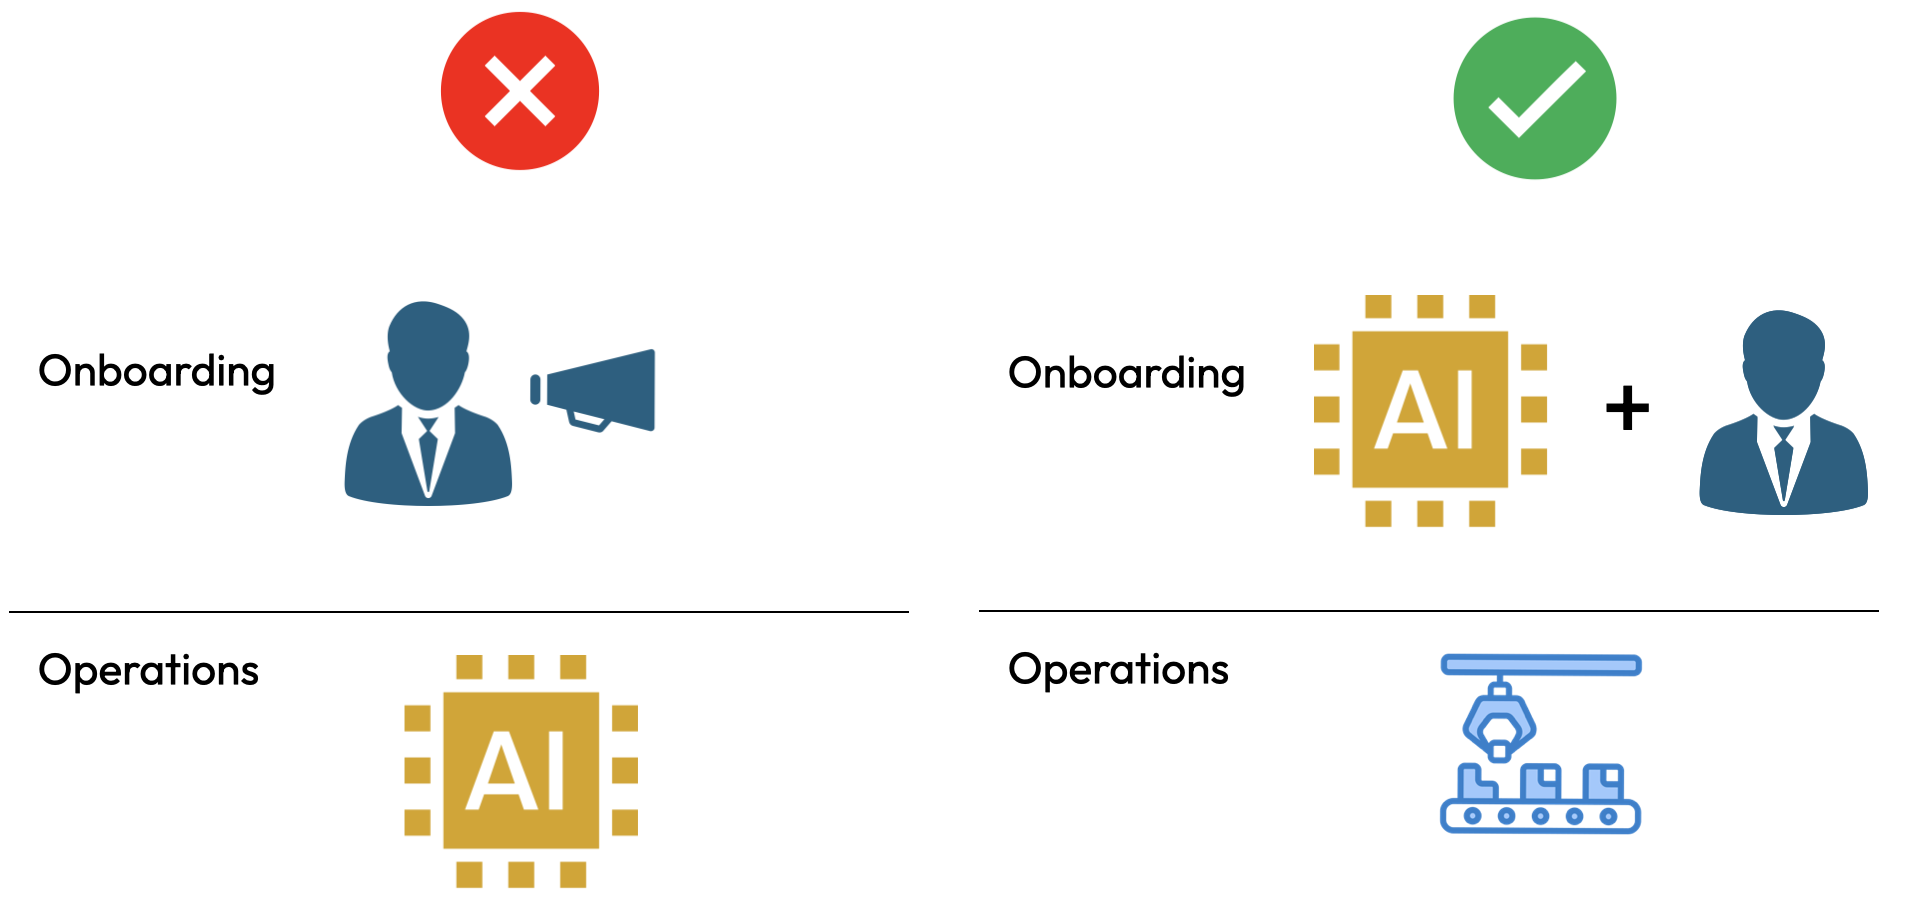
It's how you get the onboarding speed of AI and the reliability of a hand-built pipeline - without anyone in the middle between the analyst and the reports they need to create.
Try it
Agentic report onboarding is currently in alpha. It gets you roughly 80% of the way, and complex reports usually need a few follow-up tweaks in the warehouse and transformations - deliberately built to be doable by analysts who are e.g. proficient in Excel.
If you produce recurring reports, we'd like to help you get your first one running. Send us a sample report and we'll build the pipeline with you on a call - and give you the credits to keep it going.