Semiconductor Fabs I: The Equipment
Semiconductor Fabs II: The Operation
I tried to include as many links as possible to allow the reader to go down rabbit holes as they see fit.
I try to include analogies in case the explanation is poor or the topic esoteric.
I don’t work in an advanced fab, but have some glimpses into them, so I rely on my ideas, conjecture, and the literature for a more accurate representation of what state-of-the-art fabs look like (although I’m sure there are features I could never dream of).
I first go over the data side of things, since a lot of that is fundamental to how the automation operates.
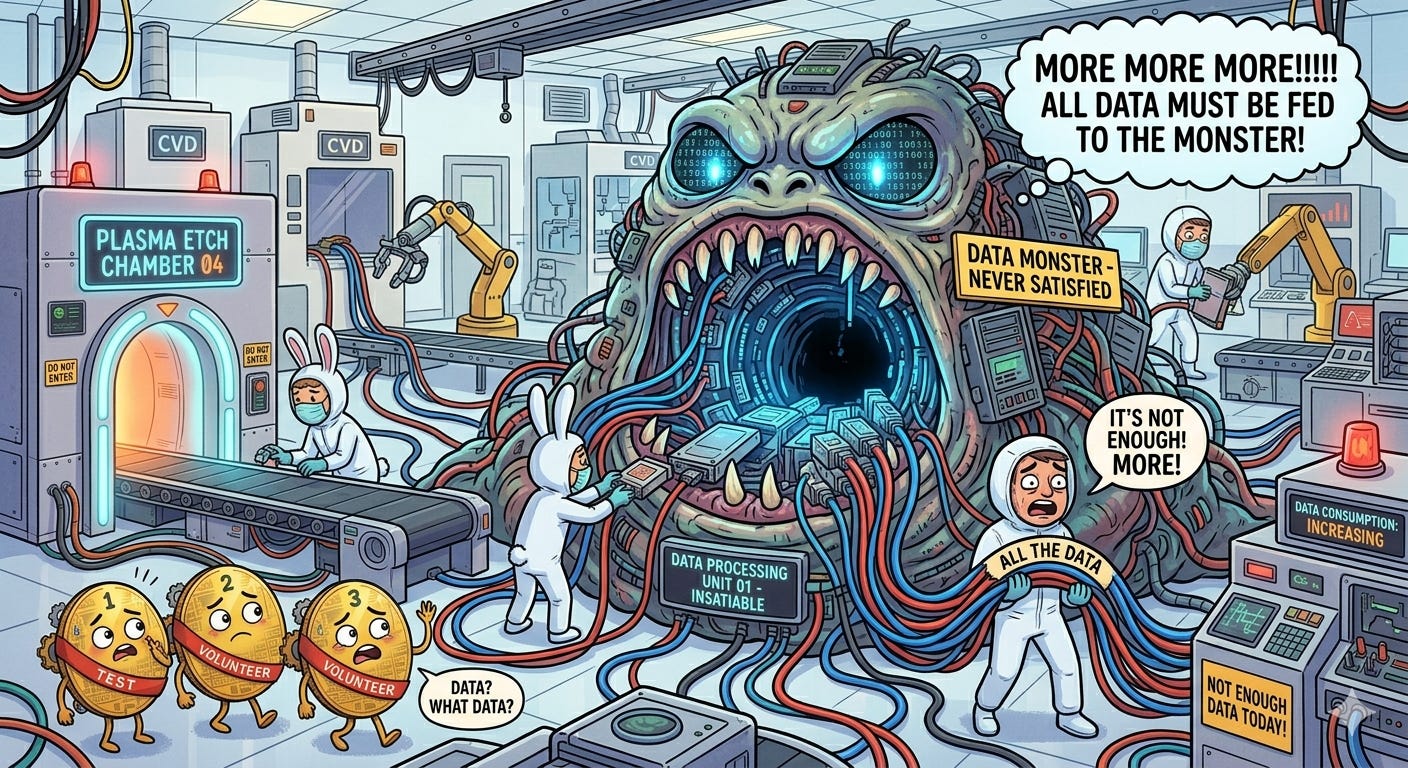
Fabs are incredibly hungry for data. Insatiably hungry. Data helps to connect patterns, solve problems, troubleshoot issues, and just plain understand what the heck is going on at the atomic level where the transistors and interconnects are made. I call it the fab data monster and Nano Banana 2 thinks it looks something like this:
More data is almost always a good thing because it allows you to fit your conclusion to the data. Just kidding. But not really. If an engineer has no freaking clue what’s causing a problem, blindly scouring the data may help uncover some anomaly that can clue them in on root cause. (But if you’re having to blindly scour the data, you probably don’t have enough data or your FDC systems aren’t developed enough.)
That said, false positives and false negatives are legitimate concerns that have to be considered. False positives may result in troubleshooting efforts in the wrong area and wasted time, money, and effort. False negatives may result in the ultimate root cause being overlooked and wasted time, money, and effort pursuing the wrong area.
How much data could one fab possibly need? And what could they possibly be measuring that culminates in petabytes (1000 TB, or 1,000,000 GB) of data?
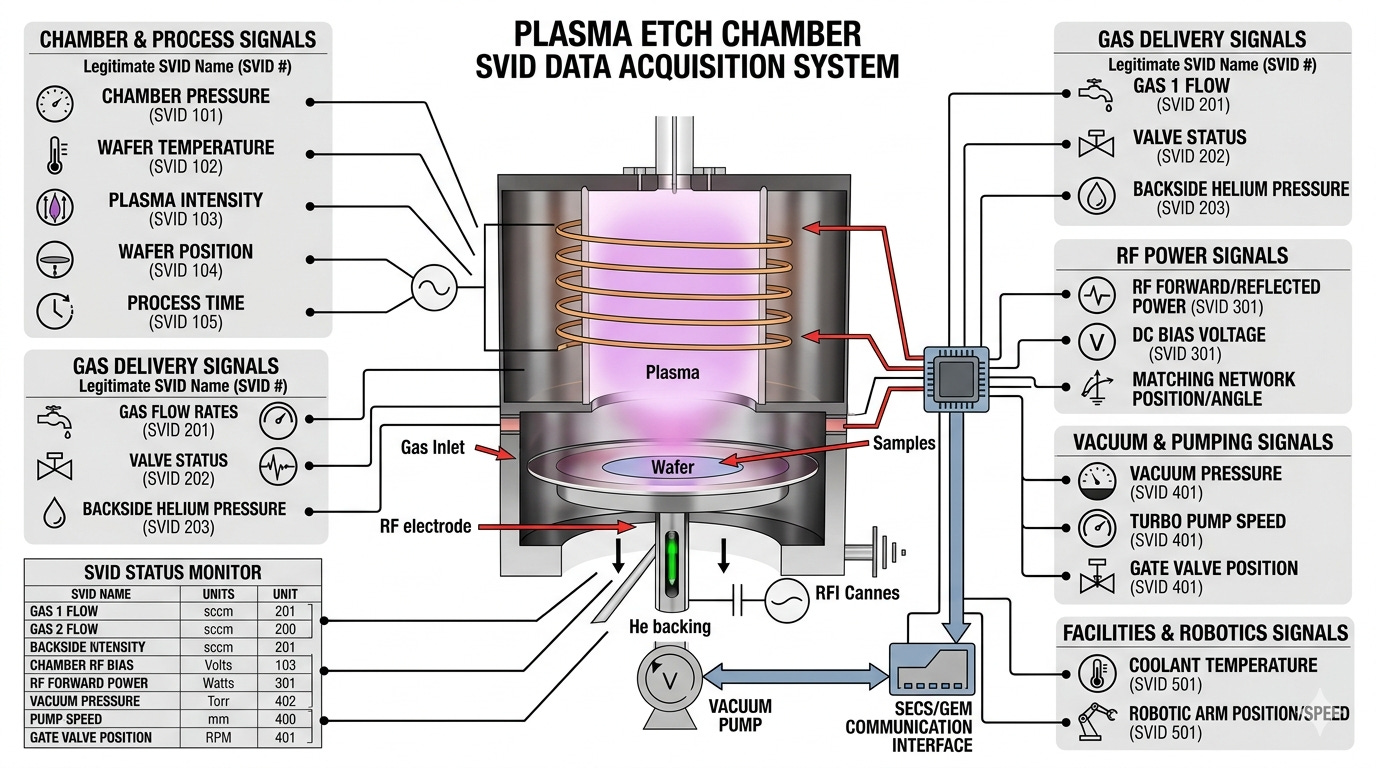
Here’s a “short” list of potential equipment signals fabs can keep track of. For example, engineers may want to keep track of the temperature, pressure, and power of component1, while voltage, current, and resistance are relevant to component2.
Temperature
Pressure
Angle
Distance
Position
Voltage
Current
Resistance
Power
Quantity
Status
Now those are just single characteristics that don’t add up to much storage space on their own. But what happens when we take measurements across multiple components across multiple tools across the entire fab?
Let’s assume the following for the NMP fab:
250 signals per tool
500 kB data per signal per hour (empirical data at a collection frequency of 1 data point per second; this includes the context needed to interpret the data (note that 1 Hz frequency is fairly slow and newer tools and fabs can accept data frqeuencies of up to and even exceeding 100 Hz, or 100 data points per second)
The math is then pretty easy:
total = 1000 tools × 250 signals/tool × 500 kB/signal/hour = 125 GB per hour ≈ 1000 TB per year of data
But wait! Those are just raw signals that the tool is reporting to the fab data monster. Statistics can be performed to get some extra info for each signal: mean, median, standard deviation, minimum, maximum, etc. Just those alone results in five times more data per signal than before (assuming you are constantly updating across the same time period, but generally a time period is defined and a single data point calculated for said period).
That’s a lot of data that is just passively created and recorded, some of which will be looked at, a lot of which won’t be. Regardless, it’s nice to have in case you need it.
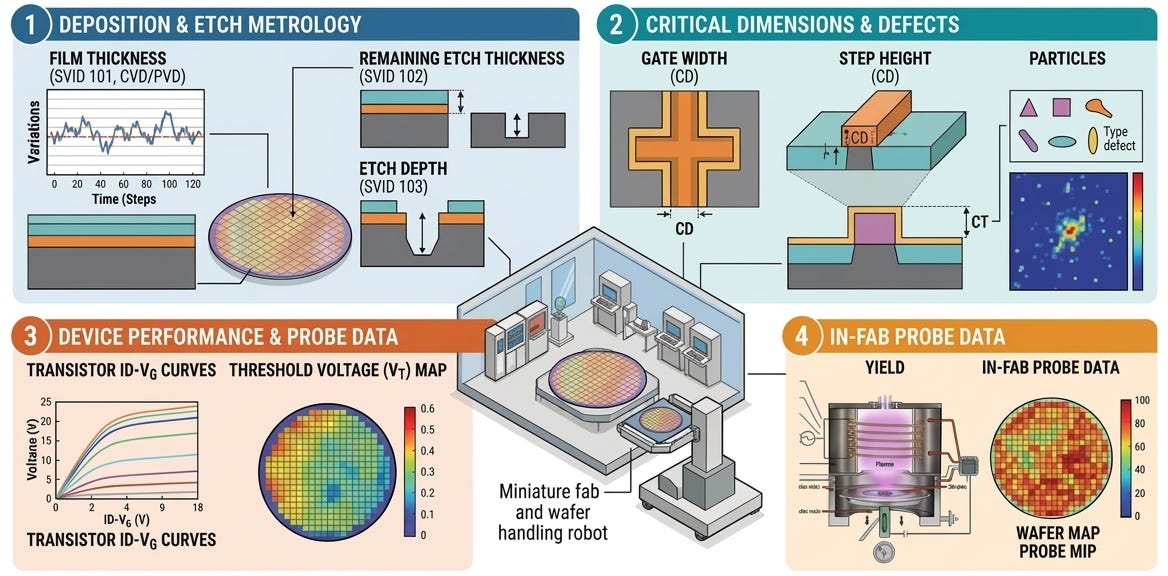
Wafers regularly get measured—either randomly, as determined by some algorithm, or intentionally due to the criticality of the process it just went through—throughout the line to ensure quality control at all processes. The measurements may be thickness after some film was deposited or etched, critical dimensions, number of particles on the wafer, or more specific measurements that are left up to the reader to determine.
These results are generally boring and not looked at because, well, they rarely fail, at least in more mature fabs where the technologies’ manufacturing processes have been optimized for years. Regardless, the tests are required for various reasons and results must sit in storage for some time.
Some fabs (all fabs? Not exactly sure here.) will test their wafers in-house towards the end of the line to shorten the feedback loop if an issue is identified or get test results quickly so they can make changes permanent; it would be weeks if they chose to wait until the wafer got what is called its “final test” results, which measure the chip’s performance at its intended purpose.
In most, but preferably all, cases, the electrical test results are the fab’s gold standard for the quality of the wafer: if it’s passing and within the historical distribution of that parameter for similar devices, great! If it’s not, then something appears to have changed either within the line or with that specific lot. If the next lot of wafers that gets tested has similar out-of-the-distribution results... get investigating!
A few not-related-to-the-main-topic notes here for the more technically curious:
Matching electrical data is pretty much how all changes ultimately get approved. Say I want to make change X to process Y. I will propose the change, get approved to run some experimental wafers, run them, review the test results, and if they’re good, request approval to fully implement change X for every wafer that runs through process Y. Changes may included small tweaks to processes or entire process flow changes.
Some parameters are strongly related to certain processes within the line, which helps to narrow down what went wrong instead of having to spot check every tool. For example, if the threshold voltage is all out of whack, that points to a problem in the gate oxide area, which is a particular machine or two in the fab. The engineers reviewing the test results can then notify the gate oxide engineers and have them look into it by digging through the tool signals or maintenance history.
Histories allow engineers to look back and see what happened on a certain date or to a certain lot. Tool signals are a form of history (what was component X doing at Y time?), but other histories are also important.
Fabs want a way to easily document events in a machine’s life, whether automated or input by a person. These leave digital bread crumbs of-sorts that can be checked to see what happened, why it happened, etc.
Here are some examples of helpful automated comments:
SPC chart X failed with value of Y1 and Y2. Limit is X. Last Z points have been in control. [This is an event that I can anchor to and look around at: what maintenance, if any, was done before the chart fail? What was the response to the chart fail? Was something repaired or replaced?]
Machine alarm X with description “Y” occurred. It has happened Z times over the past 30 days. Review recommended troubleshooting and solutions here: [link]. [This is an event that I can anchor to just like the last one, plus I get to see how bad the issue has gotten.]
And here are some examples of helpful typed-by-a-person comments:
Removed parts A1/2/3, B, and C to better diagnose lift issue. Found that part A1 is sticking at its end range of motion, which corresponds to the side of the lift that’s having the problem. Parts A2, A3, B, and C are all good and have no obvious issues when testing. Regardless, replaced all three part As since everything is open. Original B and C will go back in. The new A1/2/3 serial numbers are 123, 456, and 789, respectively. Next steps are [list of next steps]. [This tells me exactly what the issue was and what was replaced, so future me can just reference back.]
Machine alarmed for X. Found that part D was completely powered off. Verified that all relevant circuit breakers were on and there is no power discontinuity up to the part, so appears that D has failed. Wafer 13 was 10 seconds into step E of recipe F when the failure happened. All wafers placed back into the FOUP. Replaced part D and verified it has power and functions normally. Machine was vented to atmosphere and opened for replacement. No other issues noted on machine. [Same as the above.]
This is all data! It may not be numbers, but it paints a clear picture of the what happened on a machine during a certain time period.
Lots will get data and information automatically “attached” to them throughout their life. Examples include what machine the lot processed on for a certain process, what time it started and stopped, were there any abnormalities while processing, what associated data (as in in-line measurement results) is there. The list goes on. Like the in-line measurements, this data is really only looked at when there’s an issue.
Automation is a beautiful thing. It helped get us cheap and abundant everything, including semiconductors.
Automation here is referred to as, well, anything automated, and no, I’m not being a smartass. A majority of fab automation has to do with the actual wafer processing and making it less error-prone and more efficient, but there are plenty of other uses.
The life cycle of a wafer—from its start as just a bare silicon wafer to its end when it’s full of chips—can be looked at to get a better understand of what fab automation is and isn’t. I’ve provided significant detail both for nerd-sniping and to get a good picture of how many decisions are actually automated in the fab on a second-by-second basis. While reading, think about how time-consuming and error-filled a fab would be if humans had to make all the decisions and perform all the calculations.
Here’s the basic flow for how a lot runs through the line, along with some non-ideal situations arising throughout to show what automation can and can’t do:
Go! (But no collecting $200—the fab needs that money!) The 25-wafer lot is assigned a lot number—call it 123—and device—call it ABC. The manufacturing execution system (MES) knows every single process that 123 has to go to and what it needs to do at each.
Lot 123 reaches its first process: thermal oxidation in a vertical furnace. 123 is ready to run and there’s an available furnace, so the MES dispatches 123 to the furnace, which initiates automated pre-flight checks that makes sure everything is copacetic:
Is the machine actually available to accept this job request? The MES will query the equipment management system and tool itself to verify it can accept the proposed job.
Are all of the necessary SPC charts in control? Common SPC charts for qual wafers (wafers that run a test to ensure the machine is performing properly) are:
Thickness: The qual is targeted to and representative of the process that the job will run, e.g., if the job’s process grows 10 nm of oxide, then the qual will also grow 10 nm or can be easily and reliably extrapolated from a different thickness.
Particles: The qual ensures no particles are being generated by the machine.
Contamination: The qual ensures there’s no metallic contamination coming from the tool, often in the form of particles.
Is 123 allowed to run on this machine? Some fabs will automatically qualify like machines if everything matches, while others require individual machines to be qualified for each process. The former is much faster, but risker; the latter slower, but safer. See Intel’s (in)famous Copy EXACTLY! method.
Checks current tool settings against a pre-defined list. Do all of the settings match? Incorrect settings can cause misprocessing or failure to interdict on a process that’s going poorly.
Analogy: Assume a vehicle has customizable air-fuel ratio alarm settings, where 14:1 air:fuel is the ideal, 13:1 is the lower limit, and 15:1 is the upper limit. If it goes above or below the upper or lower limit, the car alarms and notifies the driver. Before driving, it would be wise to ensure these limits haven’t been temporarily adjusted by a pesky, speed-happy teenager who forgot to change it back in their excitement of going fast. If either limit were changed to something much larger, the next drive could be in the harmful-for-engine range without the driver knowing.
123 makes it to the furnace and runs the correct recipe that automation told it to run. There is no need to make sure that recipe A1B2C3D4E5 is selected vs. recipe AIB2C3D4E5 (see what the difference is?) because automation commands the correct one to be chosen.
123 gets put on hold after the furnace because the post-thickness measurement was too high. Savvy automation systems would automatically remeasure the lot to ensure the measurement was legit (2 hours of the lot not moving, no manpower required), while stone-age automation would require a person to manually remeasure themselves (4 hours of the lot not moving, plus valuable manpower required). The measurement turns out to be bogus and the lot continues on.
123 continues on and reaches a certain process (call it process 27) in the flow that requires feedforward data. The general feedforward flow goes like this:
Data from process 26 for lot 123 is “sent” to process 27. Process 27 knows how to adjust itself based on the process 26 data. Adjustments can include a variety of parameters depending on the process, such as time, power, pressure, etc.
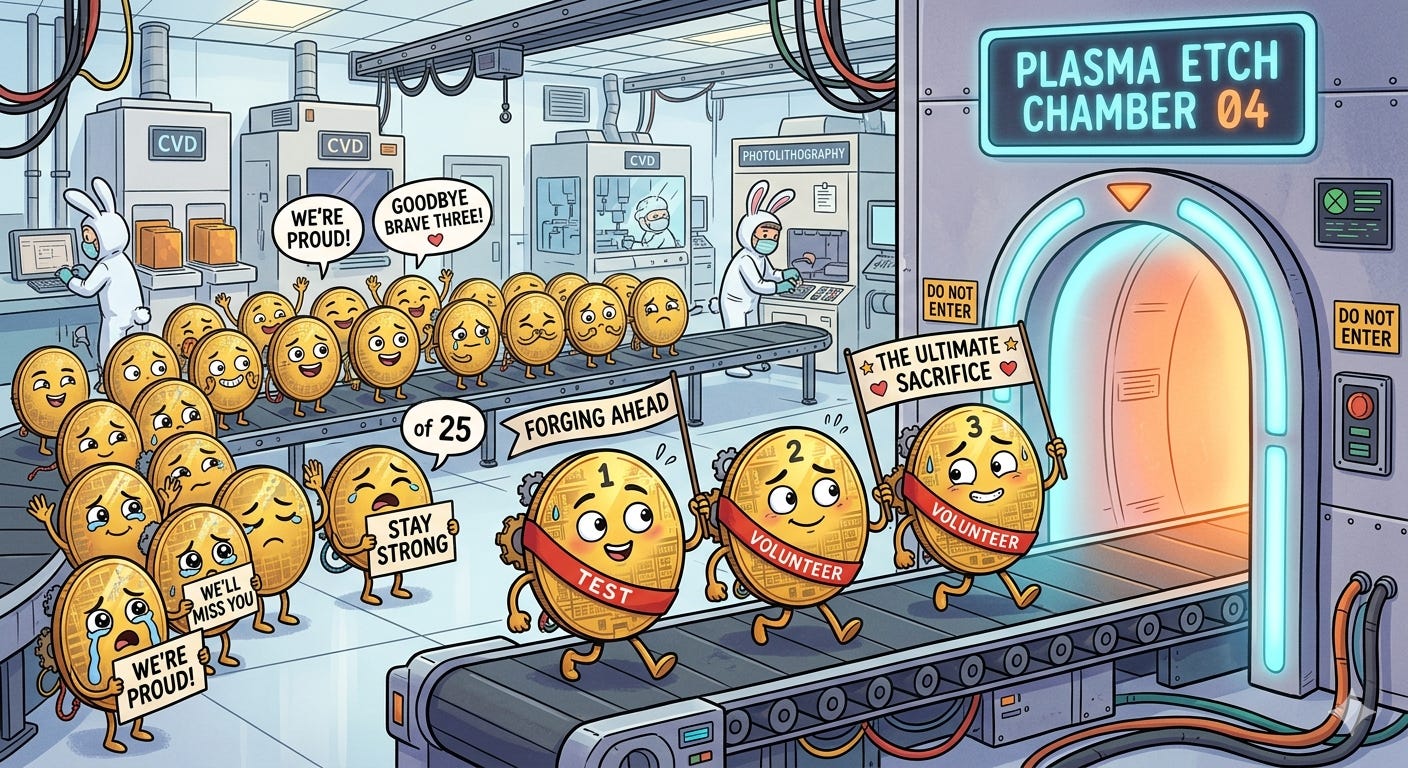
A handful of wafers from 123 (call them 123-1, 123-2, and 123-3) are sent ahead of the rest of its brothers and sisters in case a sacrifice to the fab gods is in order, i.e., they will be the test wafers for the rest of the lot to ensure everything is fine. 123-1/2/3 all complete process 27 with the process 26 data and measure to check the results, resulting in process 27 data for wafers 123-1/2/3.
Wafers 123-4 to 123-25 are then sent on to process 27 with combined data from both process 26 (for the entirety of lot 123) and process 27 (wafers 123-1/2/3 only).
Pretty simple, right? Right?! The granularity of customizing this flow is practically infinite (depending on the sophistication of the fab automation, of course). Custom adjustment values can be set based on machine (from both process 26 and process 27), device, measurement tool, etc. Full moon? Adjust accordingly! Good or bad vibes in the air? Adjust accordingly!

Pour a bottle of sulfuric acid out for the real ones who sacrificed themselves for the cause 123 makes it to process 53, where an engineer has defined an experiment that will test a few different conditions. Individual wafers will be separated into distinct lots, process, then recombine into a big lot. The general process goes like this:
Wafers are separated into “sublots”, e.g., wafers 123-1/2/3 become lot 123-A, wafers 123-4/5/6 become lot 123-B, etc.
Lot 123-A goes through process 53 with any experimental conditions that the engineer defined. Repeat for the remaining lots. There is almost always a baseline lot to compare to.
123-A/B/.../Z continue on until they reach the recombine point, which could be the next process or multiple processes down the line. Now imagine if the split occurred at a feedforward process and how complicated that would be!
Wafer 123-13 breaks randomly and other wafers are exposed to the particles that come with the break. Good automation would recognize that there was a wafer break and automatically inspect the lot for particles on other wafers, then make a decision to clean the lot if particles were found. Bad automation would put the lot on hold and wait for an engineer to review the incident, request inspection, review inspection, then make a decision. (In case I’m not being clear enough, I think pretty much anything in fab automation land is possible with sufficiently talented software engineers. It’s just a matter of assigning the necessary resources.)
This flow isn’t an exhaustive list of all of the potential pain points, but illustrates a good chunk of them. Now imagine having to do all of the following by hand:
Assign a lot number and device. Was everything entered correctly?
Verify that the machine can accept the job. Are all the settings—the tens of thousands that exist—correct? Are all of the SPC charts in control? Is the machine qualified? Was the correct recipe selected?
Review the thickness measurement fail. Is it real or fake? Does it need to be remeasured? Do you need to tag the lot for later inspection or testing?
Make feedforward process adjustments. Was the math done correctly? Was the correct parameter adjusted? Was the full moon accounted for?
Separate the lots correctly. Were the correct wafers chosen and settings applied to each?
Now rinse and repeat some of these multiple times for the hundreds, if not thousands, of lots running the fab at any given point. It’s unsustainable and overwhelming, hence the need for automated systems and processes to do most of the work. QED.
Averroes does an excellent job of explaining FDC systems and there’s no need to reinvent (or re-explain) the wheel.
I’ve never seen or heard of anything like this, but if I could vibe-code up a part management system, it would look something like this:
Detect what maintenance is coming due and what parts are needed for said maintenance. If parts are on-hand, excellent; if not, order them while taking into account current stock, lead times, historical delays.
Learn how often a part fails and extrapolate out to ensure there is always a spare available. For example, if machines 1-12’s partX fails at a rate of once per month, then 12 fail per year on average, so there should be at least one available at all times, but preferably two in case failures occur around the same time. Remember: two is one and one is none—equipment downtime is often more costly than paying for and keeping an extra spare on hand!
Original equipment manufacturers will often obsolete parts because of obsolete components, upgrades they’ve made, or issues they’ve found. OEMs could alert the company, which would trigger the following actions:
Flag what tools are at risk, if there is a risk, and notify the engineers.
Update the part number in the company system to reflect the new OEM part number. Companies have their part number, which is separate from the OEM part number. For example, NMP LLC’s part number for partX is 1111-222, while an OEM PN is 1234-12345.
Change all existing references to the old part number to the new part number (like a pointer’s memory getting updated)
Automation here is similar to automation elsewhere: it makes people’s lives and the manufacturing process safer and more efficient. And it’s freaking awesome. I can sit at my desk and do a good chunk of my job without moving because some automation guru coded up a wonderful script that helps me out.
And while the fab requires everyone to operate smoothly, the automation engineers are the heroes working in the background that nobody really thinks about. Here’s to them.