It feels like conventional wisdom that “the market” (which is often used interchangeably with the S&P 500) returns 10% a year “on average.” It may have some down years and some great years, but if you filter out the noise, there’s this expectation that over the long run you’re getting a pretty good return on your money if you just invest in the stock market as a whole and don’t muck about too much with individual stocks.
But is it true?
Let’s take a look at the S&P historical data
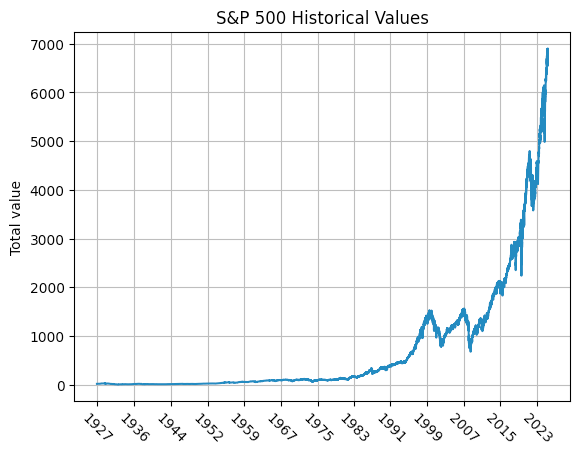
Clearly there’s exponential growth. Most often you’ll see this plotted on a log scale:
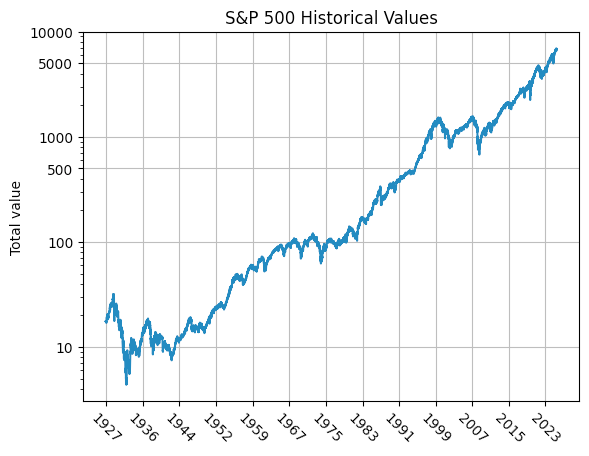
It seems the dotcom crash and the financial crisis are more obvious in the non-logarithmic plot.
Now let’s do the following: starting from 1957 (30 years after the first data point we have), we’ll calculate the annualized return rate over the past 30 years for every single data point. To do this we’ll look back a fixed number of data points. In some cases, due to weekends and holidays, we’ll be off by a couple days but in the big picture this won’t make a difference.
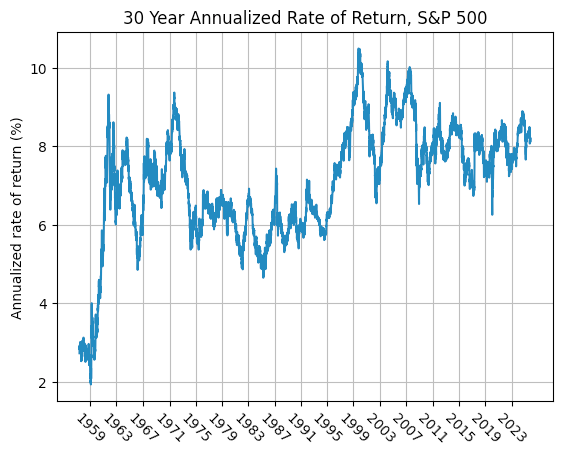
As you can see, the annualized rate of return over the past 30 years only hits 10% a couple times, most notable during some great years during the dotcom bubble of the 1990’s. The average for the whole data set is 7.048%. It’s tempting to cut out the first few years by saying “that time was different,” but a) who knows what the future holds and b) if you start from 1962 onwards, the average rate goes up only to 7.302%.
I think it’s also worth noting that from about 1975 to about 1995 the average 30-year return was ~6%.
Date and code available here: https://github.com/nbelakovski/sp500