If you find value in #ComplexityThoughts, consider helping it grow by subscribing and sharing it with friends, colleagues or on social media. Your support makes a real difference.
→ Don’t miss the podcast version of this post: click on “Spotify/Apple Podcast” above!
We are used to seeing the nearby Universe as a map of things: galaxies, clusters, filaments, voids. But some of its most meaningful structures do not become visible by looking only at where matter is: they amazingly emerge when we ask where is matter going.
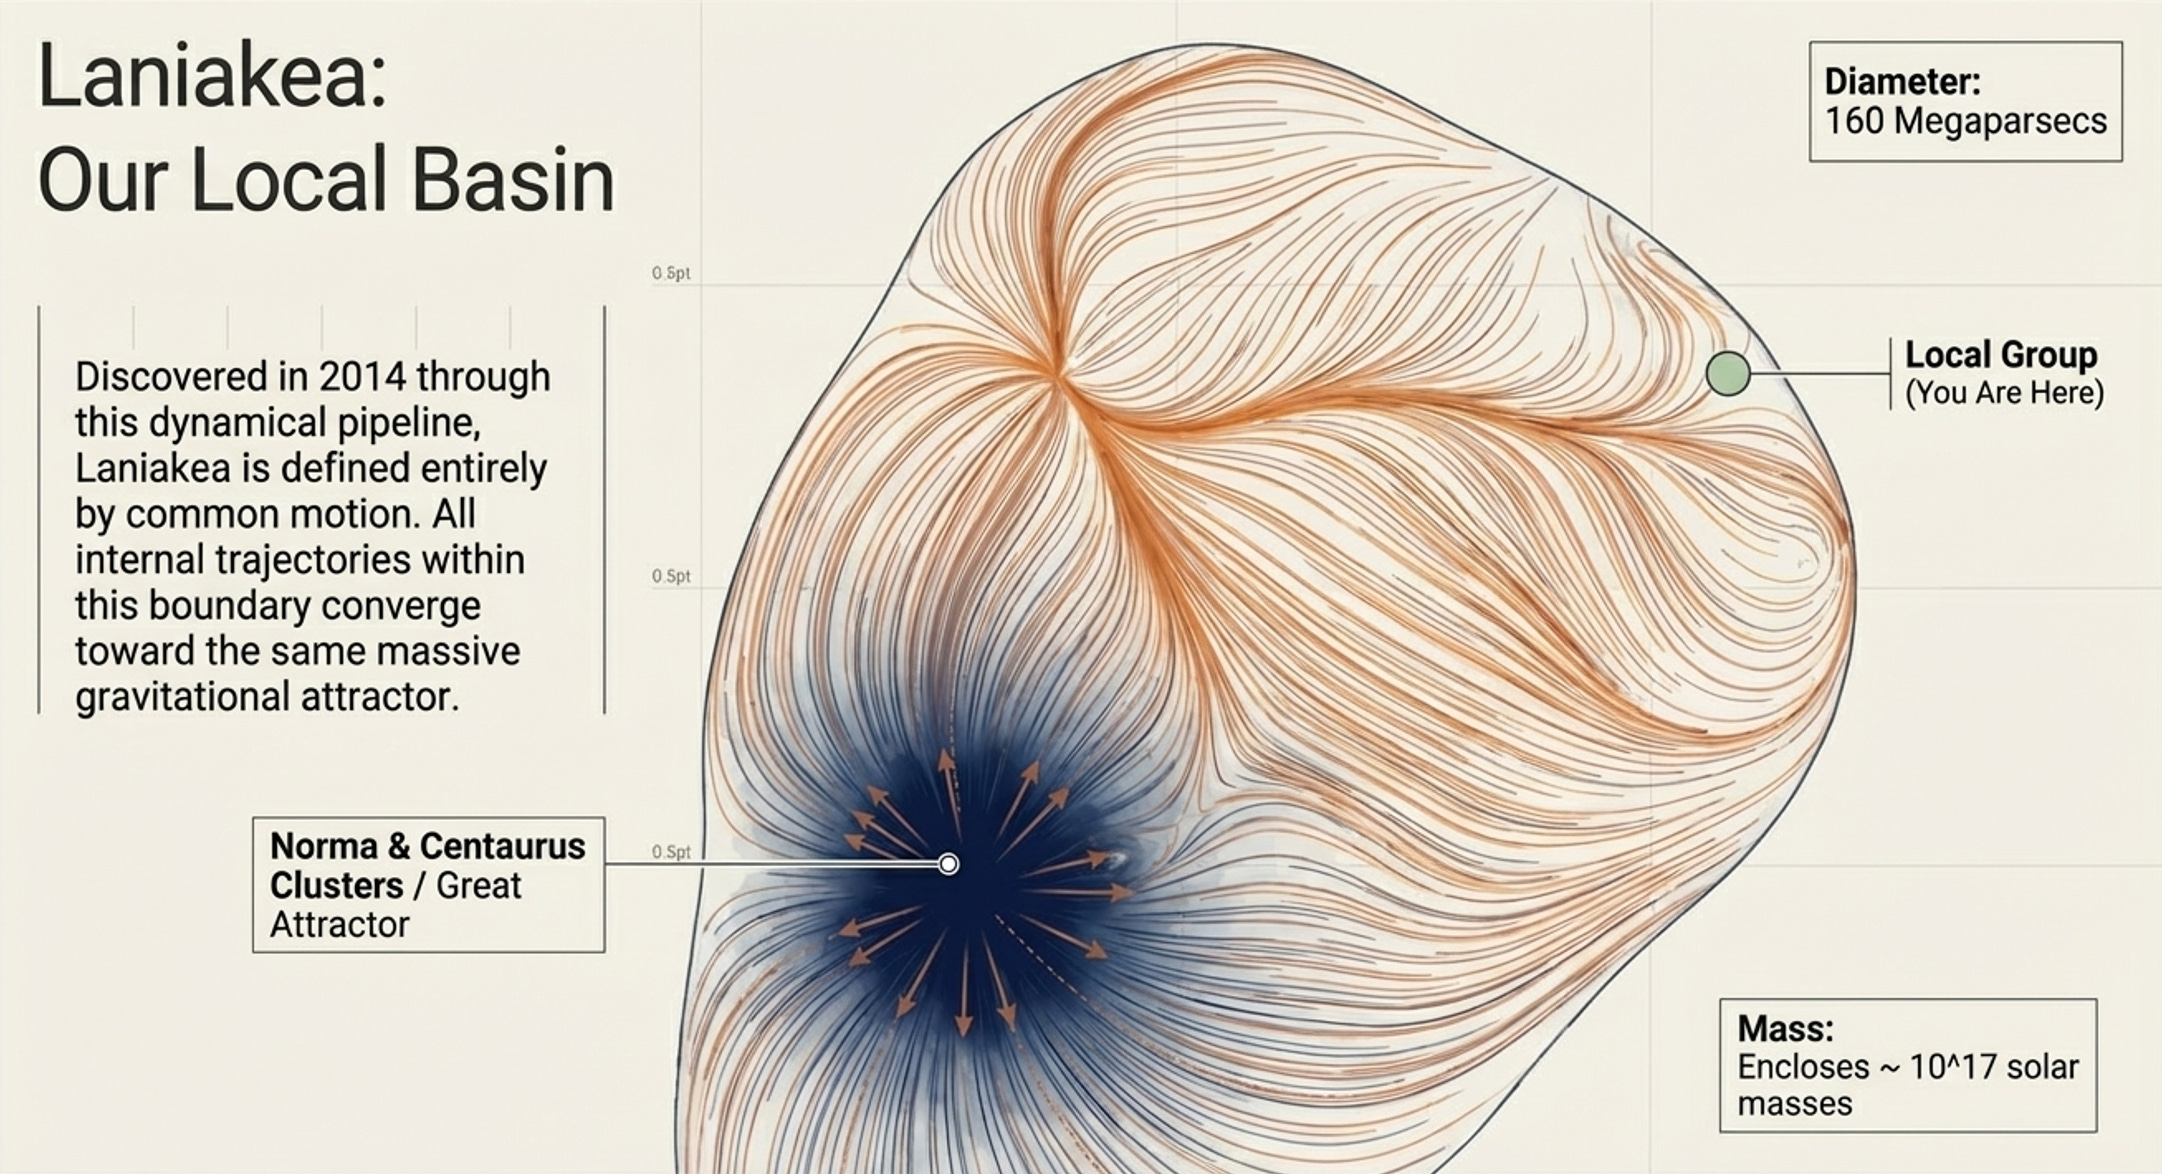
Laniakea is the supercluster we inhabit and its discovery changed the criterion for what counts as a coherent large-scale structure. A supercluster, in this view, is not only a region with many galaxies: it is a basin of attraction in the velocity field, a domain within which galaxy motions converge toward the same large-scale attractor. In other words, common motion can reveal a boundary more clearly than common location.
Note.If you follow ComplexityThoughts from the very beginning, you might recognize how this concept has driven the attention of this space and, more specifically, of the research of my Lab, as I have described here:
While this shift may sound technical, note that the intuition behind it is simple:
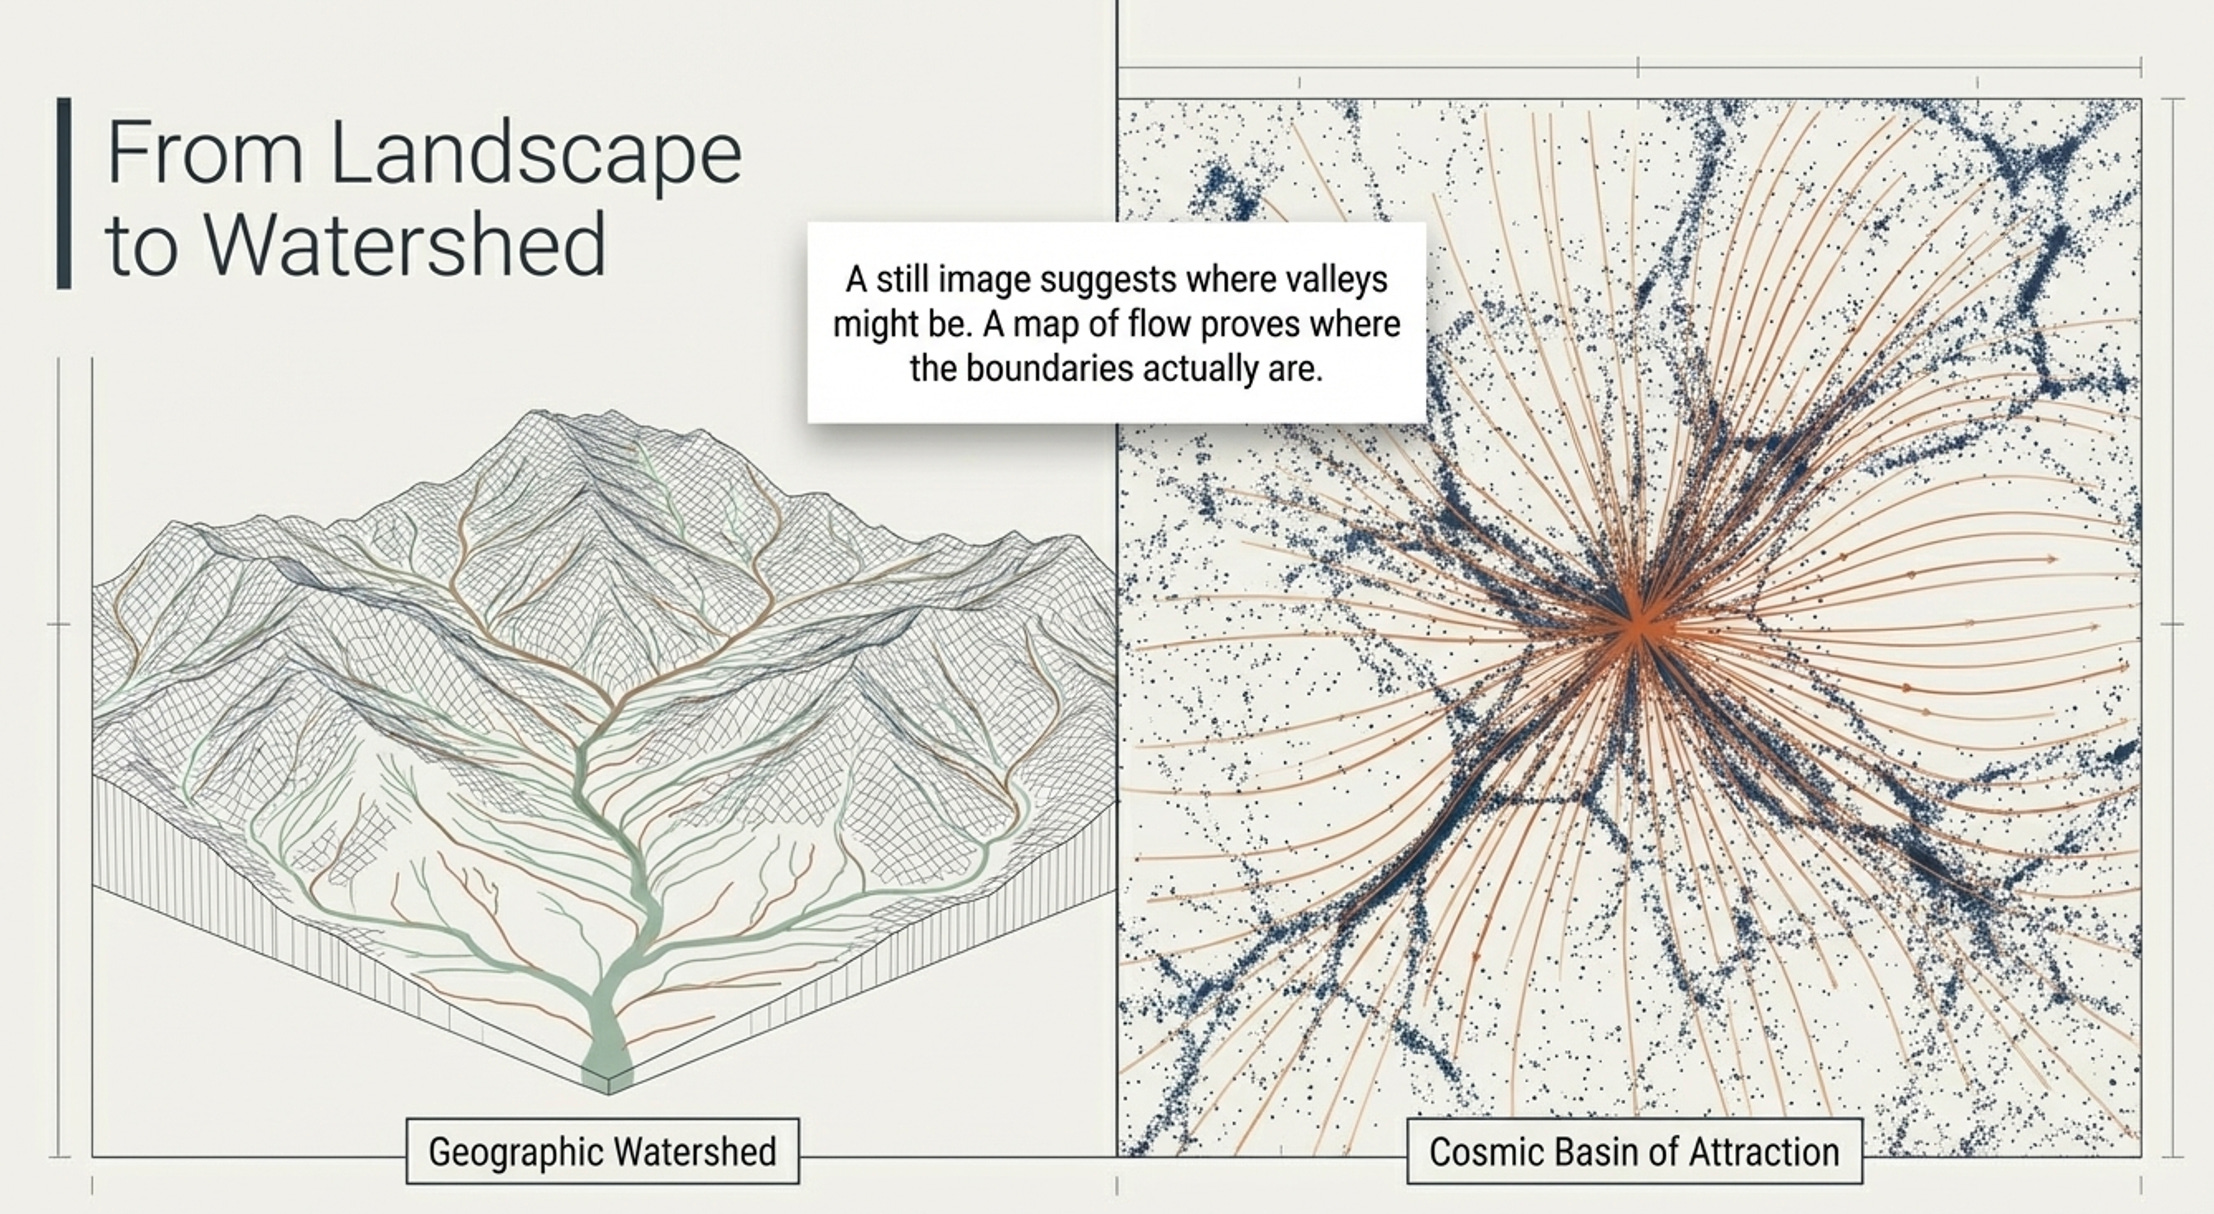
a still image of a landscape can suggest where valleys and ridges might be;
a map of water flow tells you where the watershed actually is.
Laniakea became legible in that second sense: the original 2014 reconstruction used galaxy distances and peculiar velocities to infer the surrounding flow field, and from that field identify a basin whose internal trajectories converge1 toward the region of the Norma and Centaurus clusters, near what had long been associated with the Great Attractor. Amazingly, the resulting structure spans about 160 megaparsecs (about 5 x 10^21 km, i.e., 5 sextillion kilometers or 33 trillion times the distance from our Sun) in diameter and encloses on the order of 10^17 (i.e., 100 quadrillion) solar masses.
Video: a fly-through our local Universe, reconstructed from real data (see details below). This is the output of a collaboration with Simone Conradi. And yes, we had a lot of fun. Do you like it? You can reproduce it and even customize it: we have also released the whole pipeline.
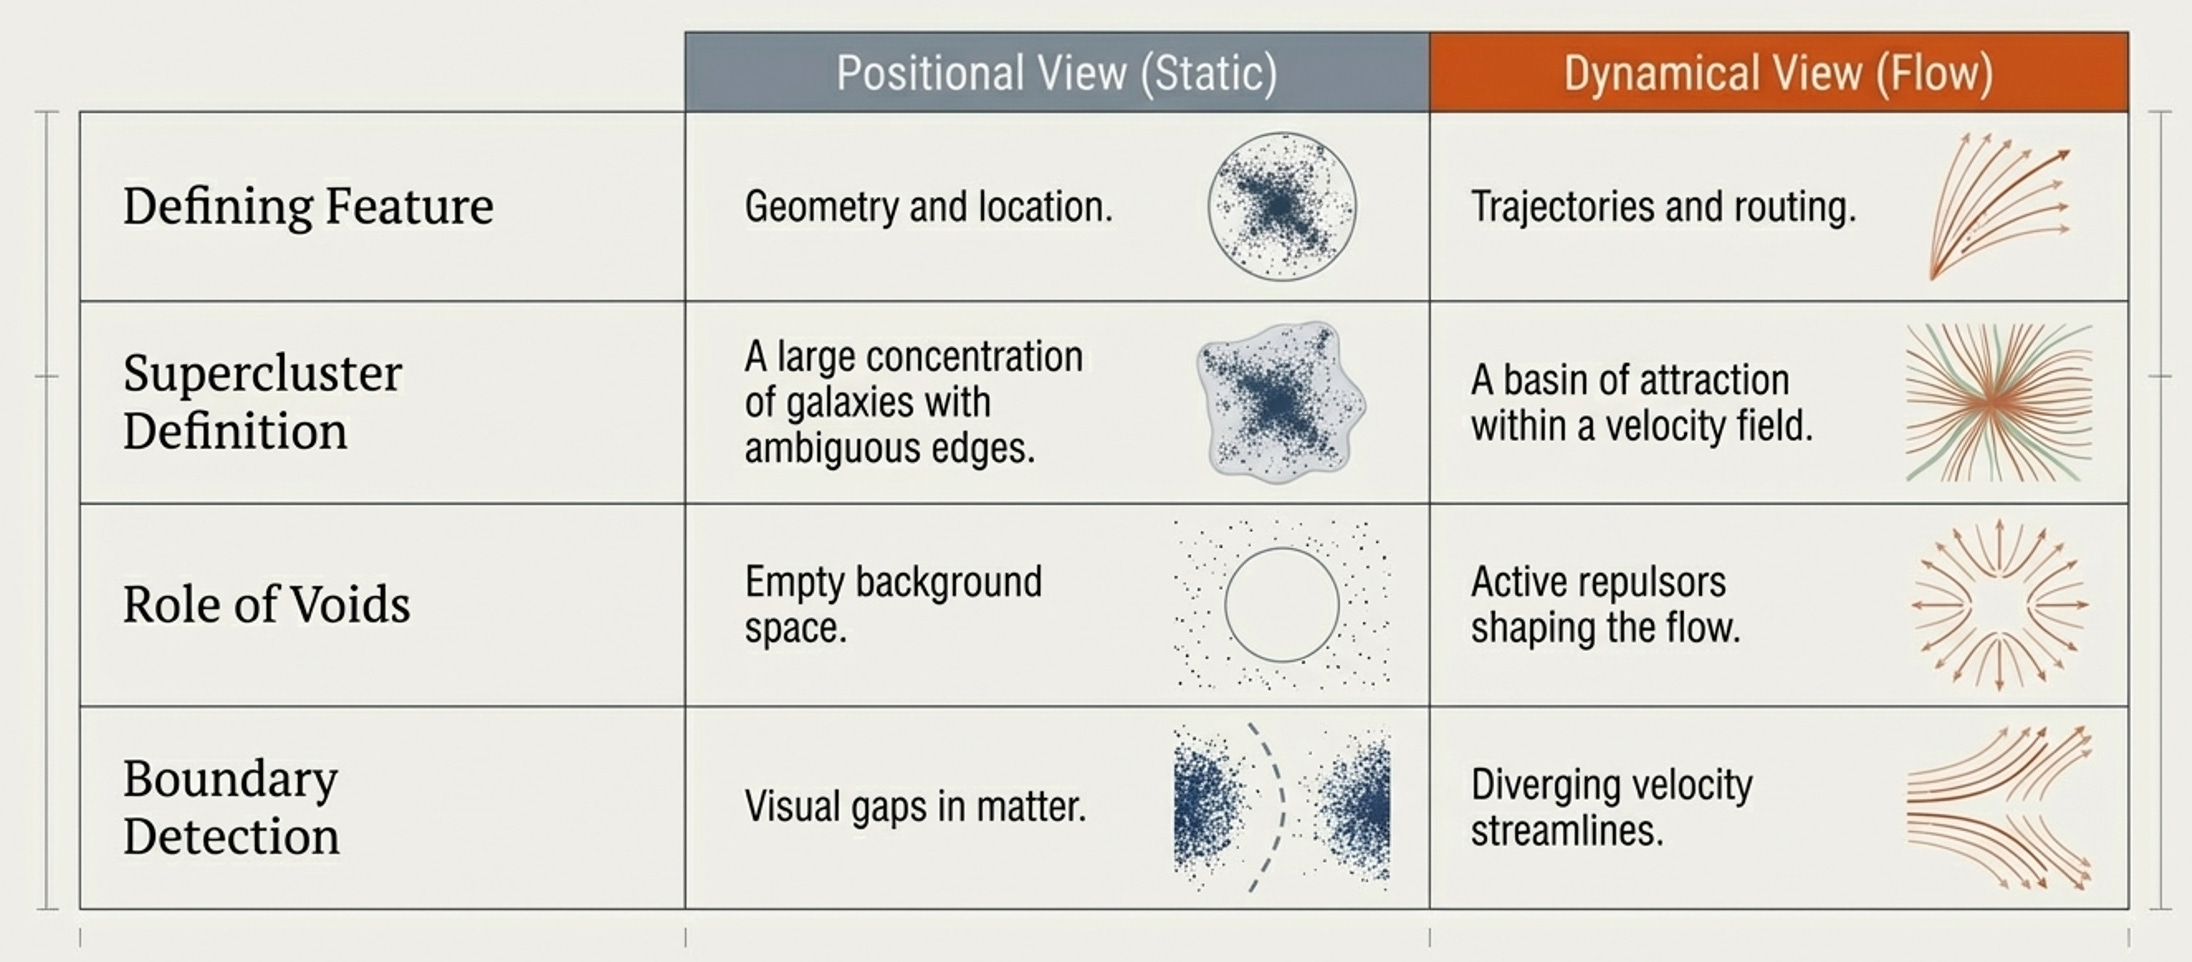
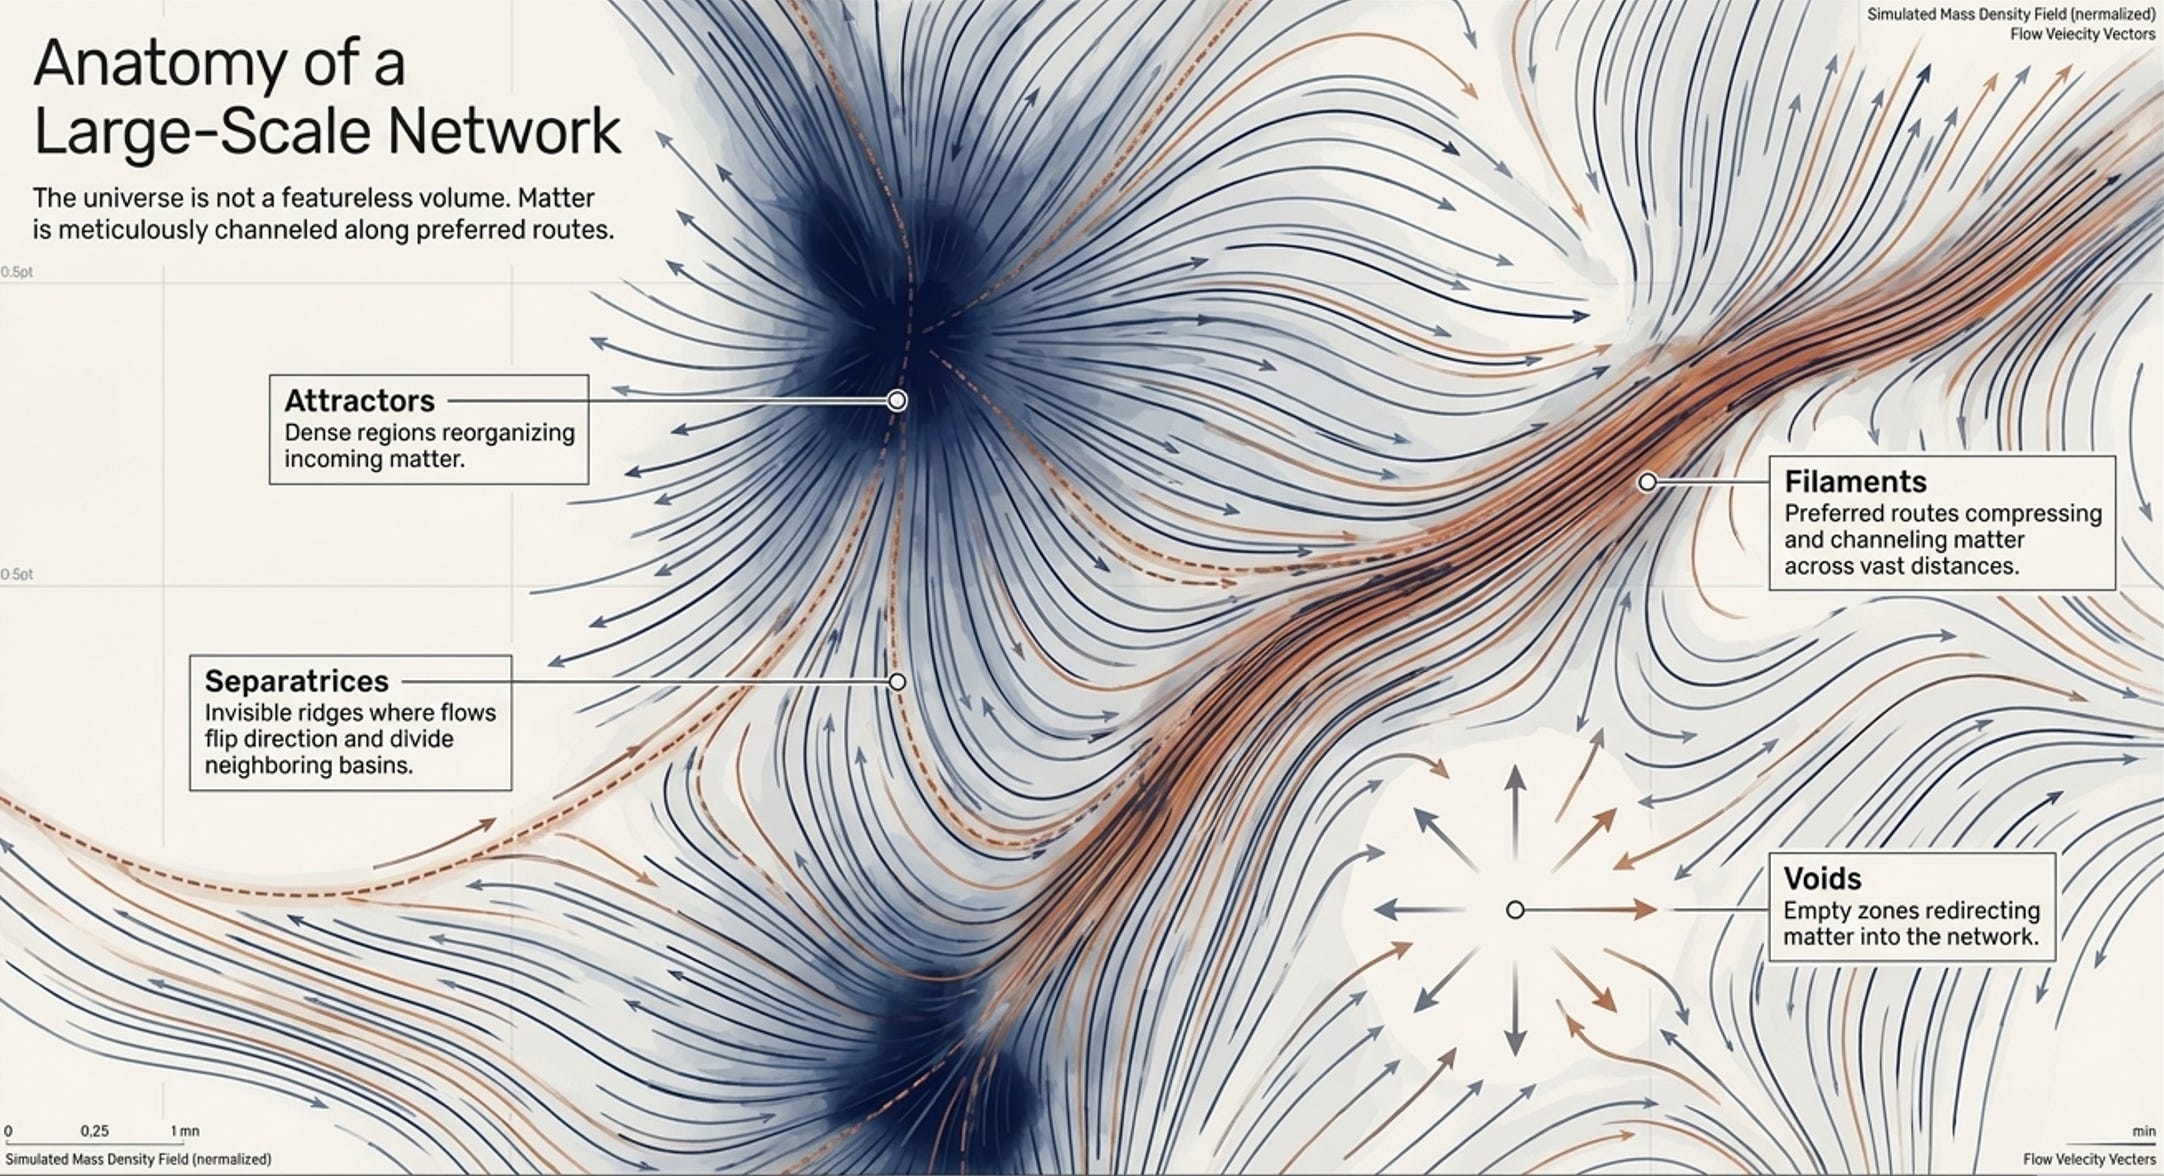
First, let us note that the positions alone are not enough. Redshift surveys revealed the cosmic web as a striking arrangement of clusters, filaments and voids, but they also left an ambiguity: where exactly does one supercluster end and another begin?
Note.This “ambiguity” is not due to scientists being lazy. It is rather an intrinsic feature of complex systems across all scales, from cells to cities. I will write about this in the future.
The very term “supercluster” was useful but imprecise, because large concentrations of galaxies are interconnected with no clean edge. To this aim, a more operational solution has been proposed: define the boundary dynamically, by following the flow. Does it sound familiar? From static structures to dynamical processes!
The second insight is that galaxy motions are not exhausted by cosmic expansion. Once independent distance estimates are available, one can subtract the Hubble flow from the observed recession velocity and recover the peculiar velocity: the residual motion induced by gravitational perturbations. Those measurements are sparse and noisy, so the field is not observed directly everywhere, and it has to be reconstructed. In the original Laniakea work, this was done with a Wiener-filter approach that infers the most probable three-dimensional velocity and density fields from incomplete data, while also allowing a separation between local flows and the larger tidal background. That step is crucial: without it, the nearby web remains a static picture; with it, one begins to see a dynamical architecture.
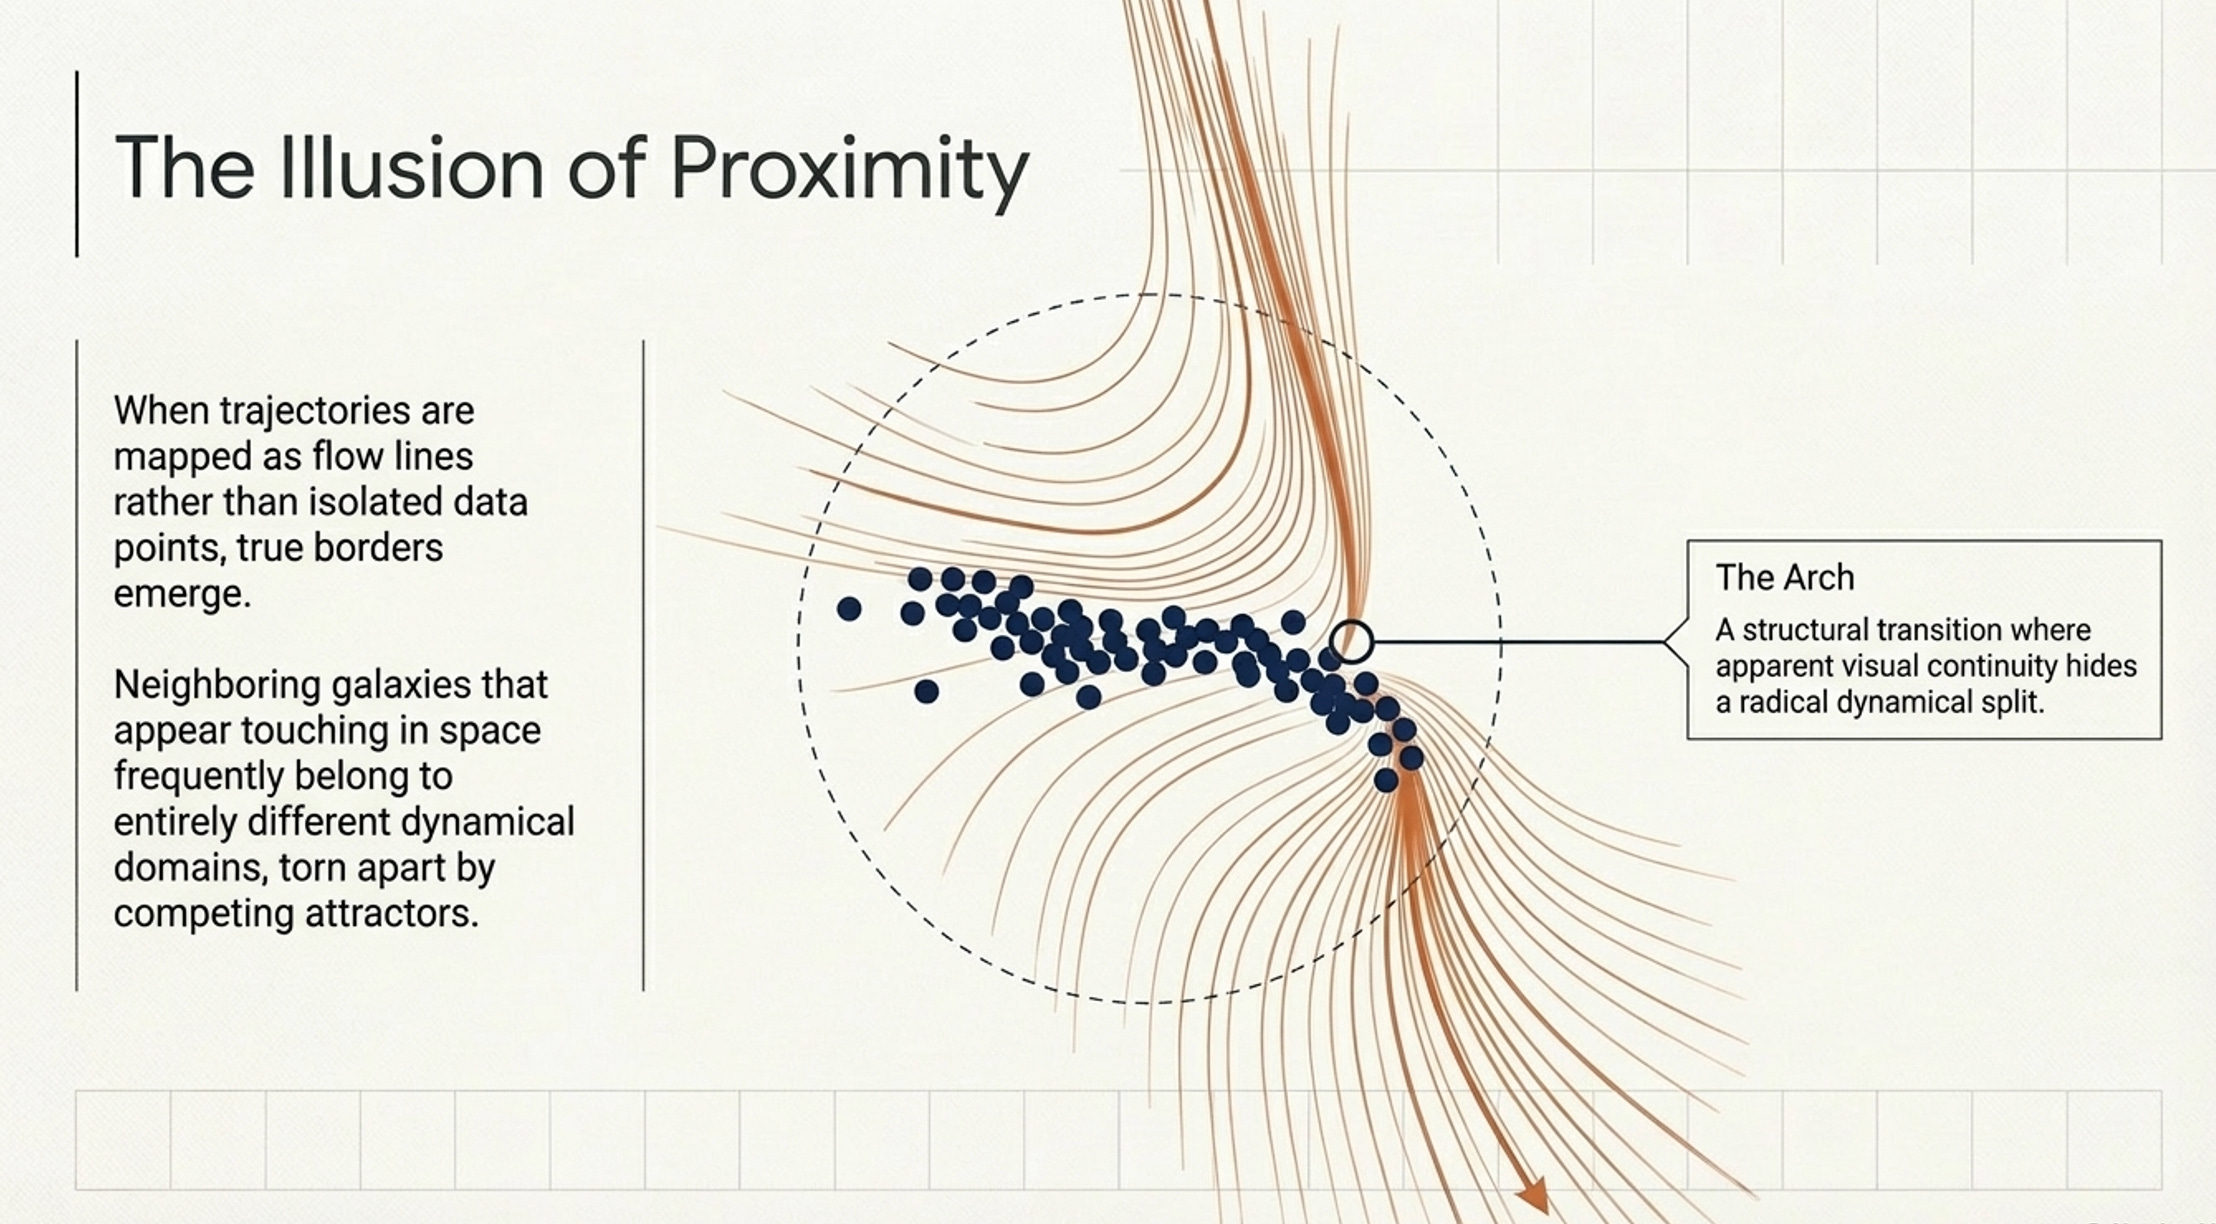
This is also why the animations are not just ornamental, being able to do what static figures can only suggest. The movie like the above ones are essential to grasping the complexity of the underlying structure. Once trajectories are shown as flow lines rather than isolated data points, boundaries become easier to interpret: neighbouring galaxies that appear close in space may nonetheless belong to different dynamical domains if their motions diverge toward different attractors. Conversely, structures that look fragmented in a static map can be recognized as part of the same coherent basin when read through the velocity field.
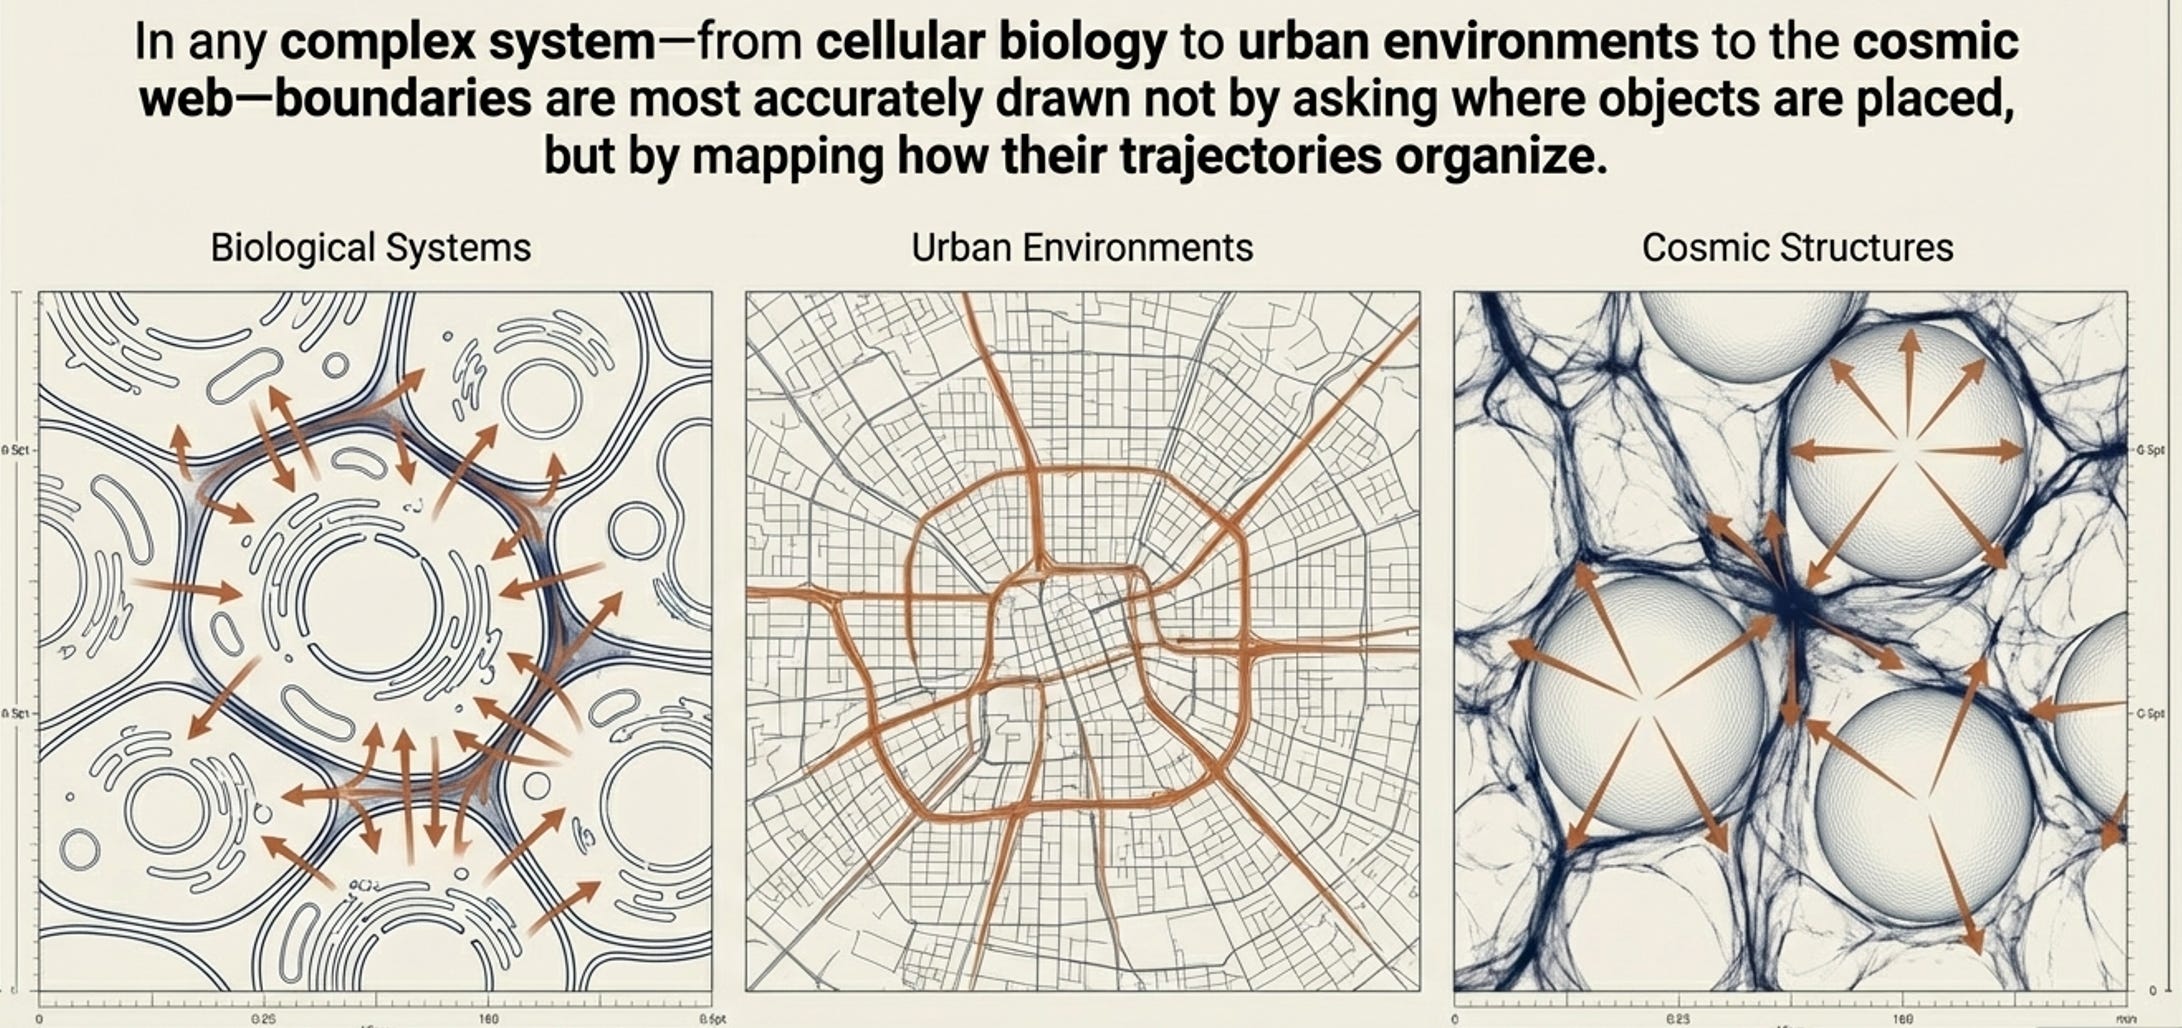
The third lesson, and the one that interests me most from a complex-systems perspective, is that the cosmic web can be read as an effective large-scale network for matter transport.
However, this should be taken carefully: not as a literal claim that the Universe is “a network” in every formal sense, but as a disciplined description of what the reconstructed flow field makes visible. Matter is not distributed randomly through a featureless volume: it is channelled along preferred routes, redirected near separatrices, compressed along filaments and reorganized by attractors and voids. The geometry matters, but so does the routing.
That is where our new work with Simone Conradi enters. We are an unusual pair: a theoretical and an applied physicist, an expert developer producing pieces of art and a complex-systems scientist. What could go wrong?
Simone is a theoretical physicist active in STEM education, making social media a better place by sharing his beautiful pieces of math-based art, like this:
Starting from Cosmicflows-4 data and the reconstructed three-dimensional velocity field, we built a reproducible pipeline to assign galaxies to basins of attraction, integrate streamlines through the field and visualize the resulting large-scale organization in 3D2.
Why? The point is not merely to produce a more polished picture, our colleagues already made an excellent job with their visualizations. Instead, our goal is to make the dynamical organization of the nearby cosmic web inspectable, reproducible and open to further analysis. The resulting animation, shown above, is an amazing view in which Laniakea appears in all of its beauty as a region of convergent motion embedded in a larger field of competing flows.
In this perspective, two aspects are especially striking. One is that voids become active components of the story rather than empty background: in the original reconstruction, voids help shape the boundaries between attraction basins and some of the most interesting divergences occur along structures bordering them. The other is that some of the most informative features lie near transitions: places where flows flip direction, where bridges connect neighbouring domains or where what looks like continuity in the galaxy distribution hides a dynamical split.
The “Arch” discussed in the 2014 paper is a good example of this kind of structure: beyond visual curiosities, these structures — or lack of — are where the system tells you how it is partitioned.
Peculiar-velocity reconstructions can reveal structures that are hard to recover from redshift surveys alone, including regions obscured by the plane of the Milky Way. That matters because the nearby Universe is not observed under ideal conditions, and dynamical inference can therefore do more than refine existing maps. It can expose relationships and boundaries that would remain hidden in a purely positional description.
None of this means that Laniakea is a final container of where we live: the mapped region does not exhaust the full set of larger-scale influences on the motion of the Local Group, and coherent flows continue beyond the domain that could be robustly reconstructed at the time. Accordingly, Laniakea is not the last word, but it remains a decisive one showing that, in the nearby Universe, meaningful structure can be defined dynamically.
That, to us, is the deepest insight we could get from this nice collaboration. In complex systems, boundaries are often easiest to draw not by asking where objects are, but by asking how trajectories organize. Laniakea is one of the clearest cosmic examples of that principle, and that’s why I started to routinely use it as a mind-blowing example in my talks.
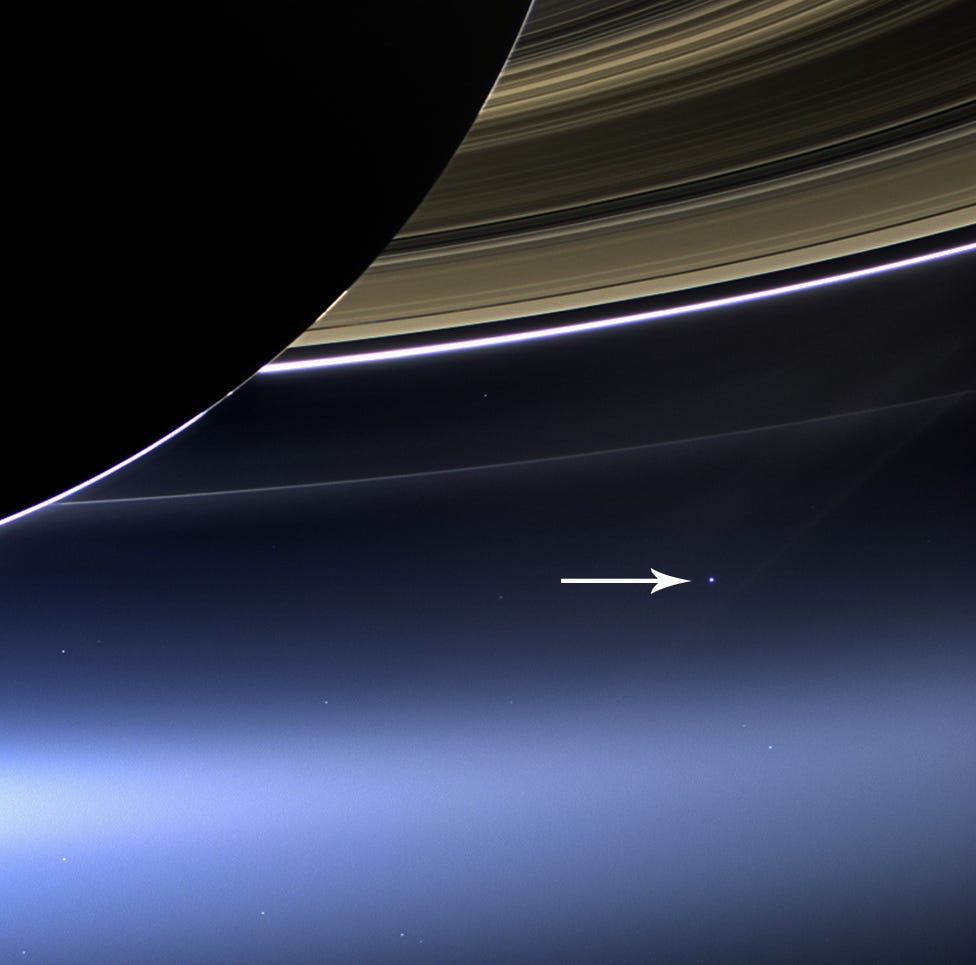
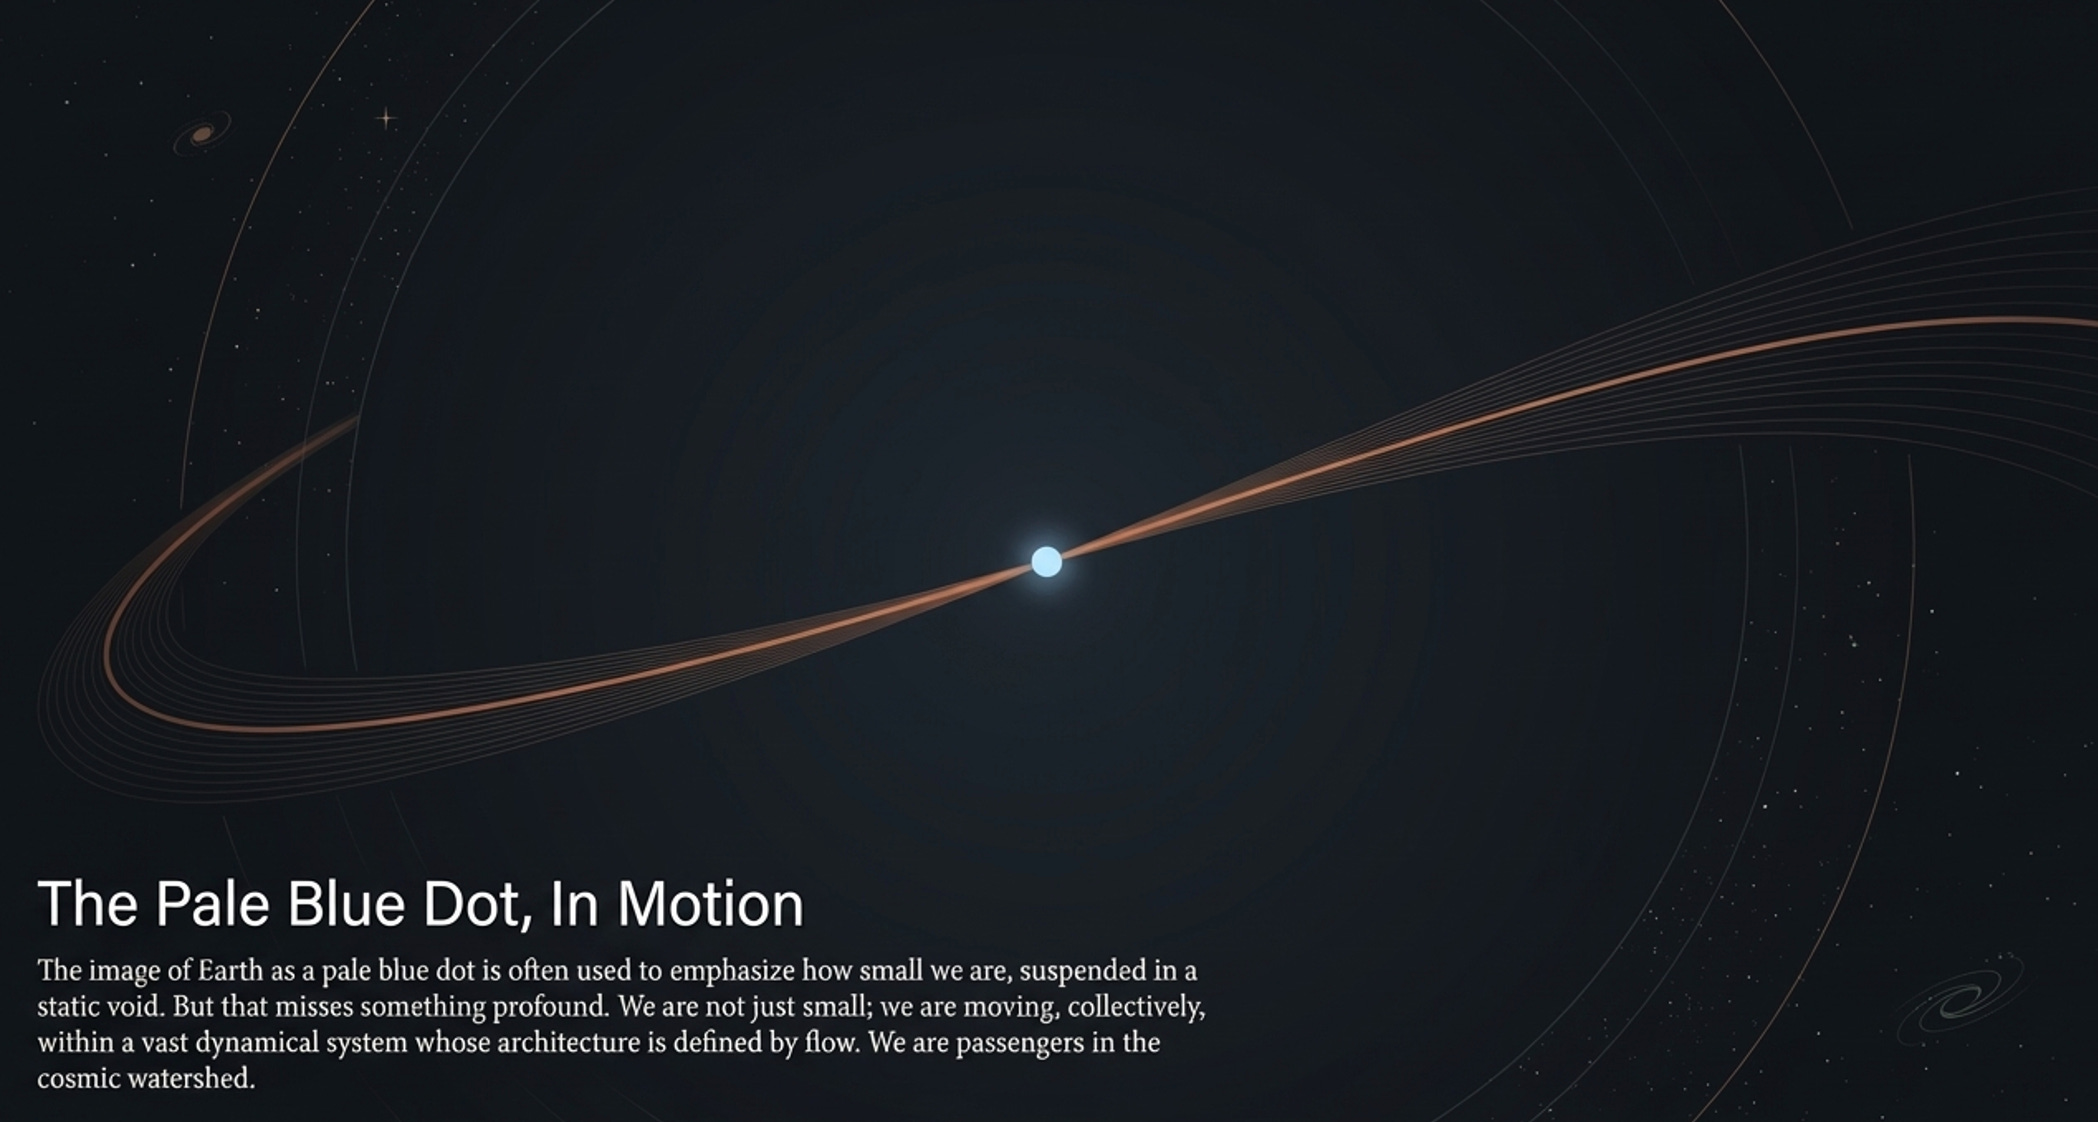
The image of Earth as a pale blue dot is often used to emphasize how small we are.
“The Day the Earth Smiled”: a composite photograph taken by the NASA spacecraft Cassini on July 19, 2013. I have taken the above picture from bbc.com where you can find also previous pictures of our pale blue dot.
But it misses something equally important: we are not just small, we are moving, collectively, within a vast dynamical system whose boundaries are defined by flow. And that perspective might change everything.
If you want to explore the reconstruction yourself, we have made the pipeline public in this GitHub repository.
→ Please, remind that if you find value in #ComplexityThoughts, you might consider helping it grow by subscribing, or by sharing it with friends, colleagues or on social media. See also this post to learn more about this space.