What you get
⚡
Real-time Cluster State
Nodes, pods, workloads, services, and events — auto-refreshing with zero manual reloads.
📜
Streaming Logs & Web Shell
Live pod logs via SSE, aggregated workload logs, and browser-based terminal via xterm.js.
🤖
AI-Powered Diagnostics
LLM root cause analysis for troubled pods. Works with any OpenAI-compatible API.
💰
Spot Advisor & Cost Analysis
Instance risk scoring, namespace cost allocation, and intelligent consolidation recommendations.
📊
Restart Timeline
Color-coded scatter chart of restart events — OOMKills, probe failures, crash loops — spot patterns at a glance.
⚙️
Node Drain Wizard
Safe, guided drains with PDB awareness, eviction preview, and real-time streaming progress.
🔑
Just-in-Time Access
Zero-trust shell and CronJob access. Viewers request, admins approve. Workload-scoped, auto-expiring.
▶️
CronJob Manual Trigger
Run scheduled jobs on demand. JIT-gated for viewers, instant for admins. Full audit trail.
✏️
YAML Editor & Config Drift
View and edit YAML for 11 resource kinds. Detect when pods run stale ConfigMaps or Secrets.
🔗
Dependency Graph
Visual map of Deployments → Services → Ingresses → HPAs → Secrets with drift highlighting.
🚨
Troubled Pods NOC Screen
Dedicated fullscreen view of broken pods. Put it on a TV and walk away.
🔐
SSO, RBAC & Audit Trail
Google SSO, any OIDC provider, role-based access, full audit log, online user presence.
See it in action
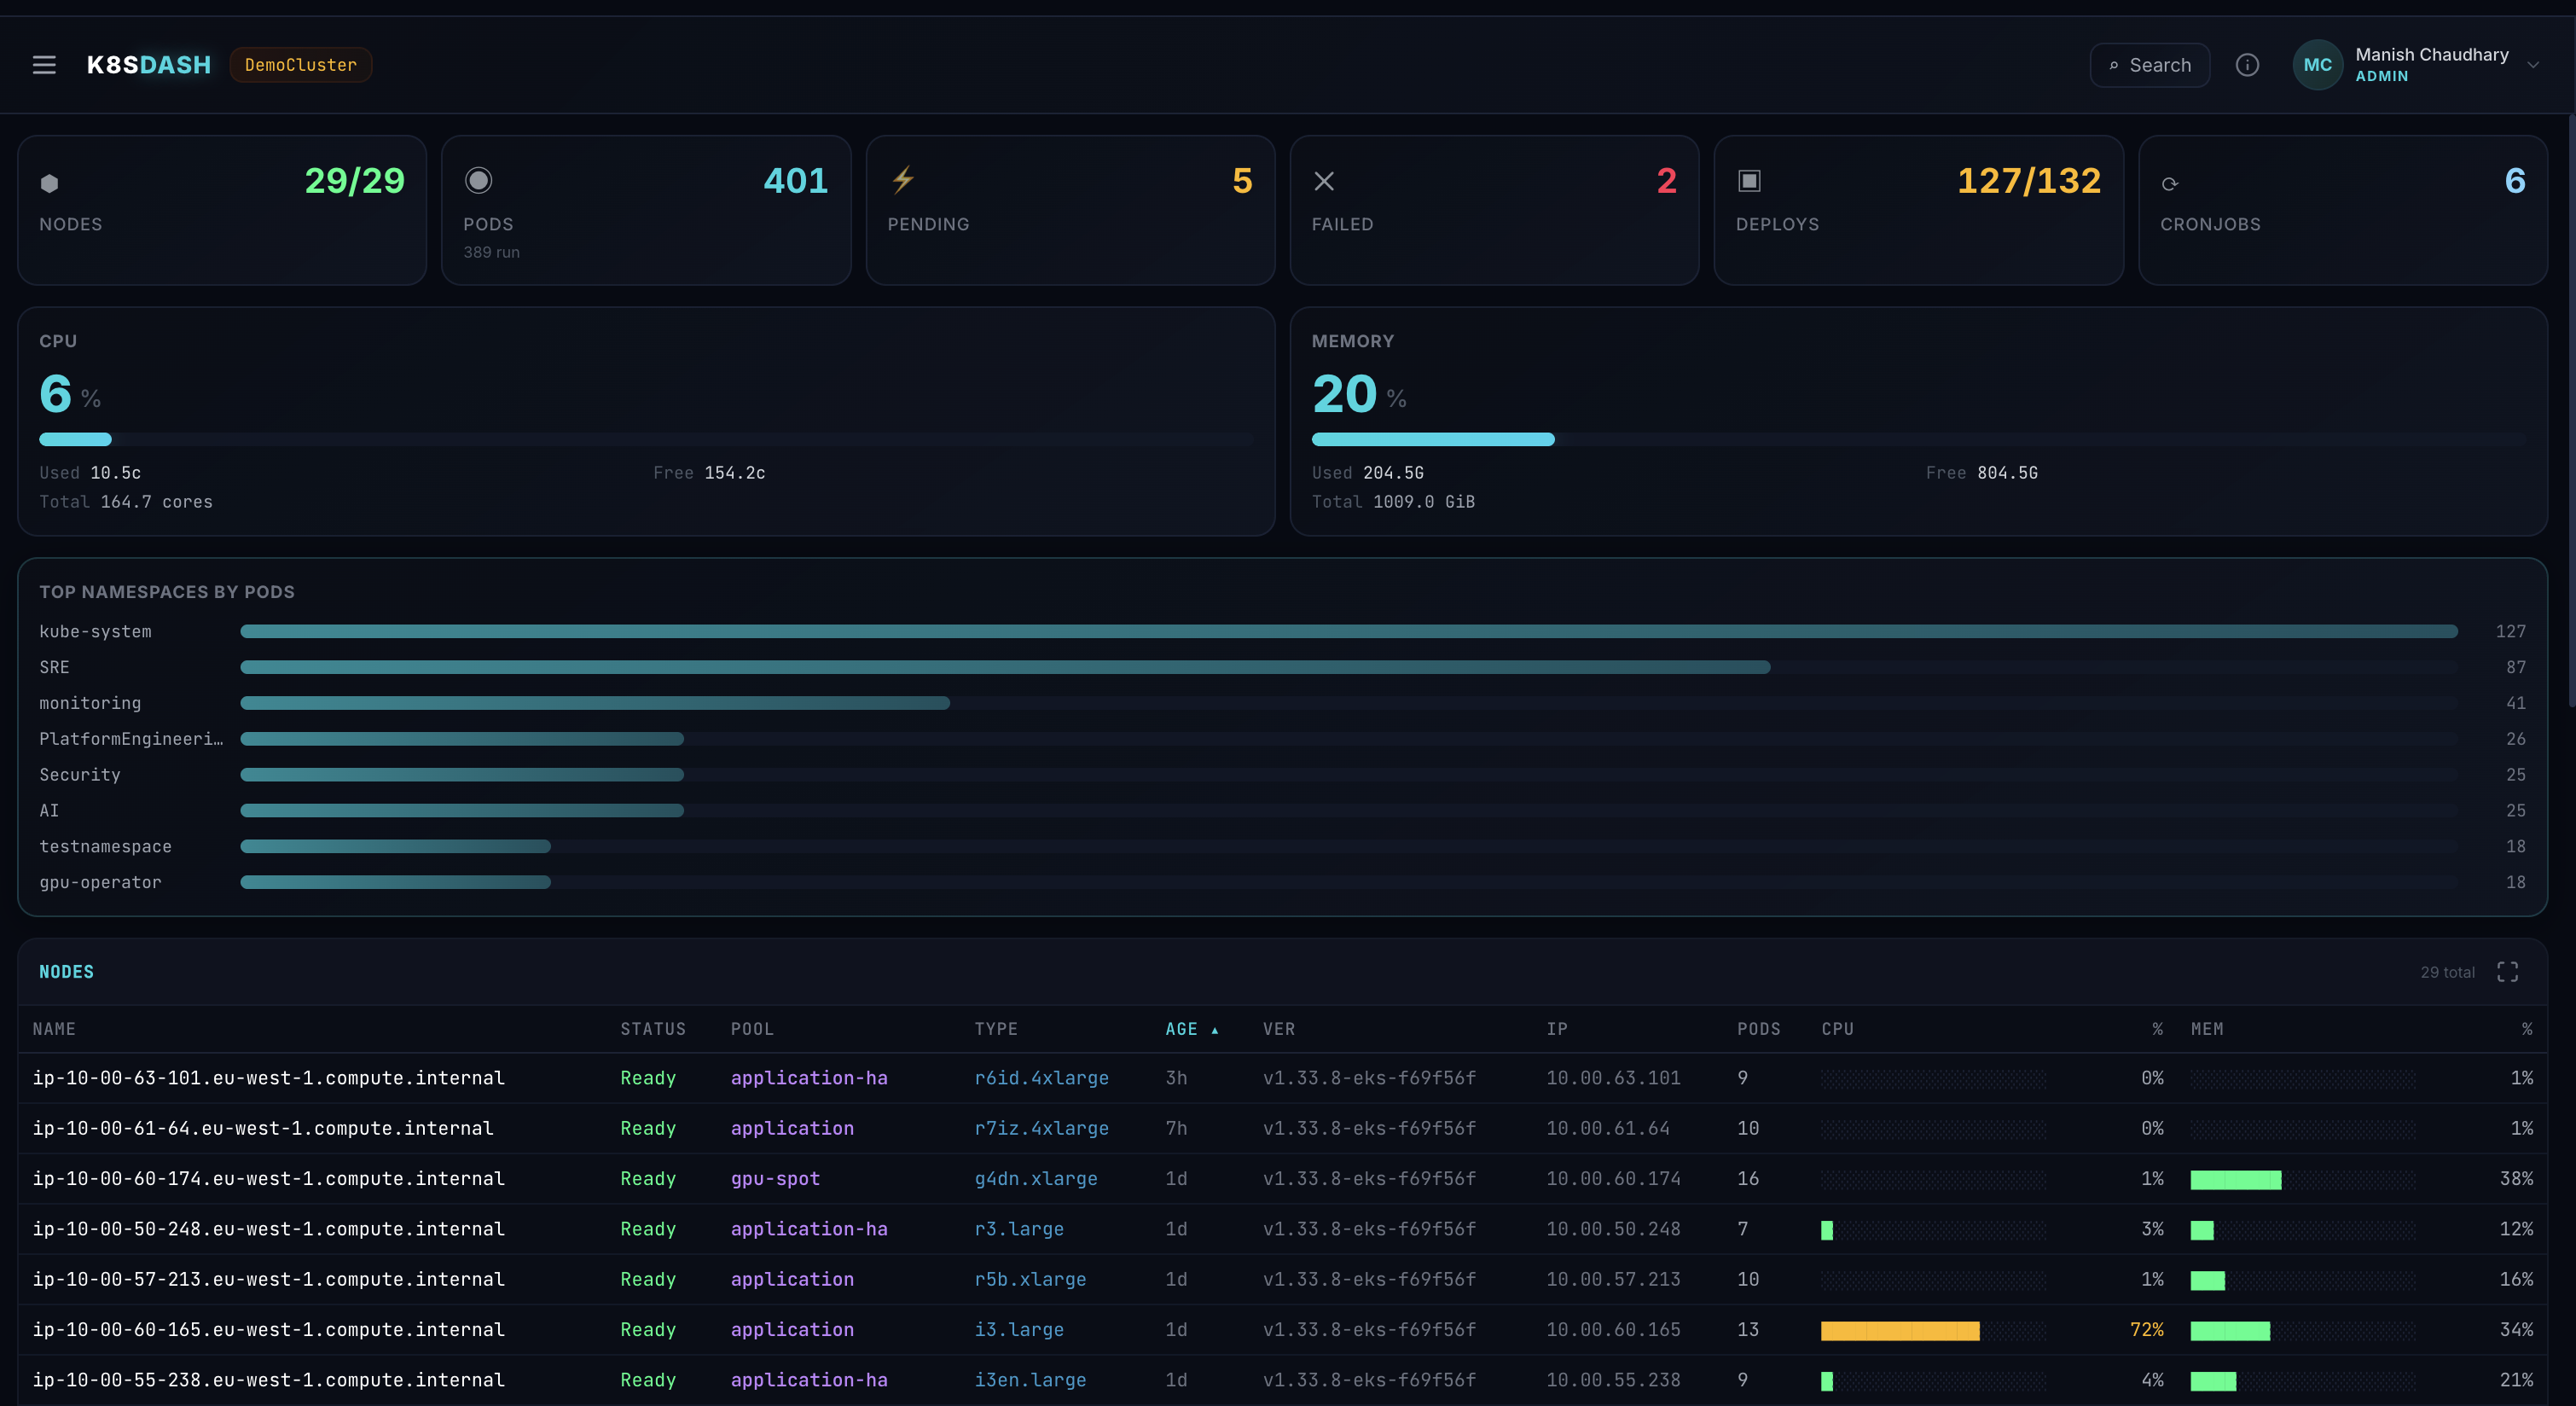
Cluster Overview — Real-time node and pod status
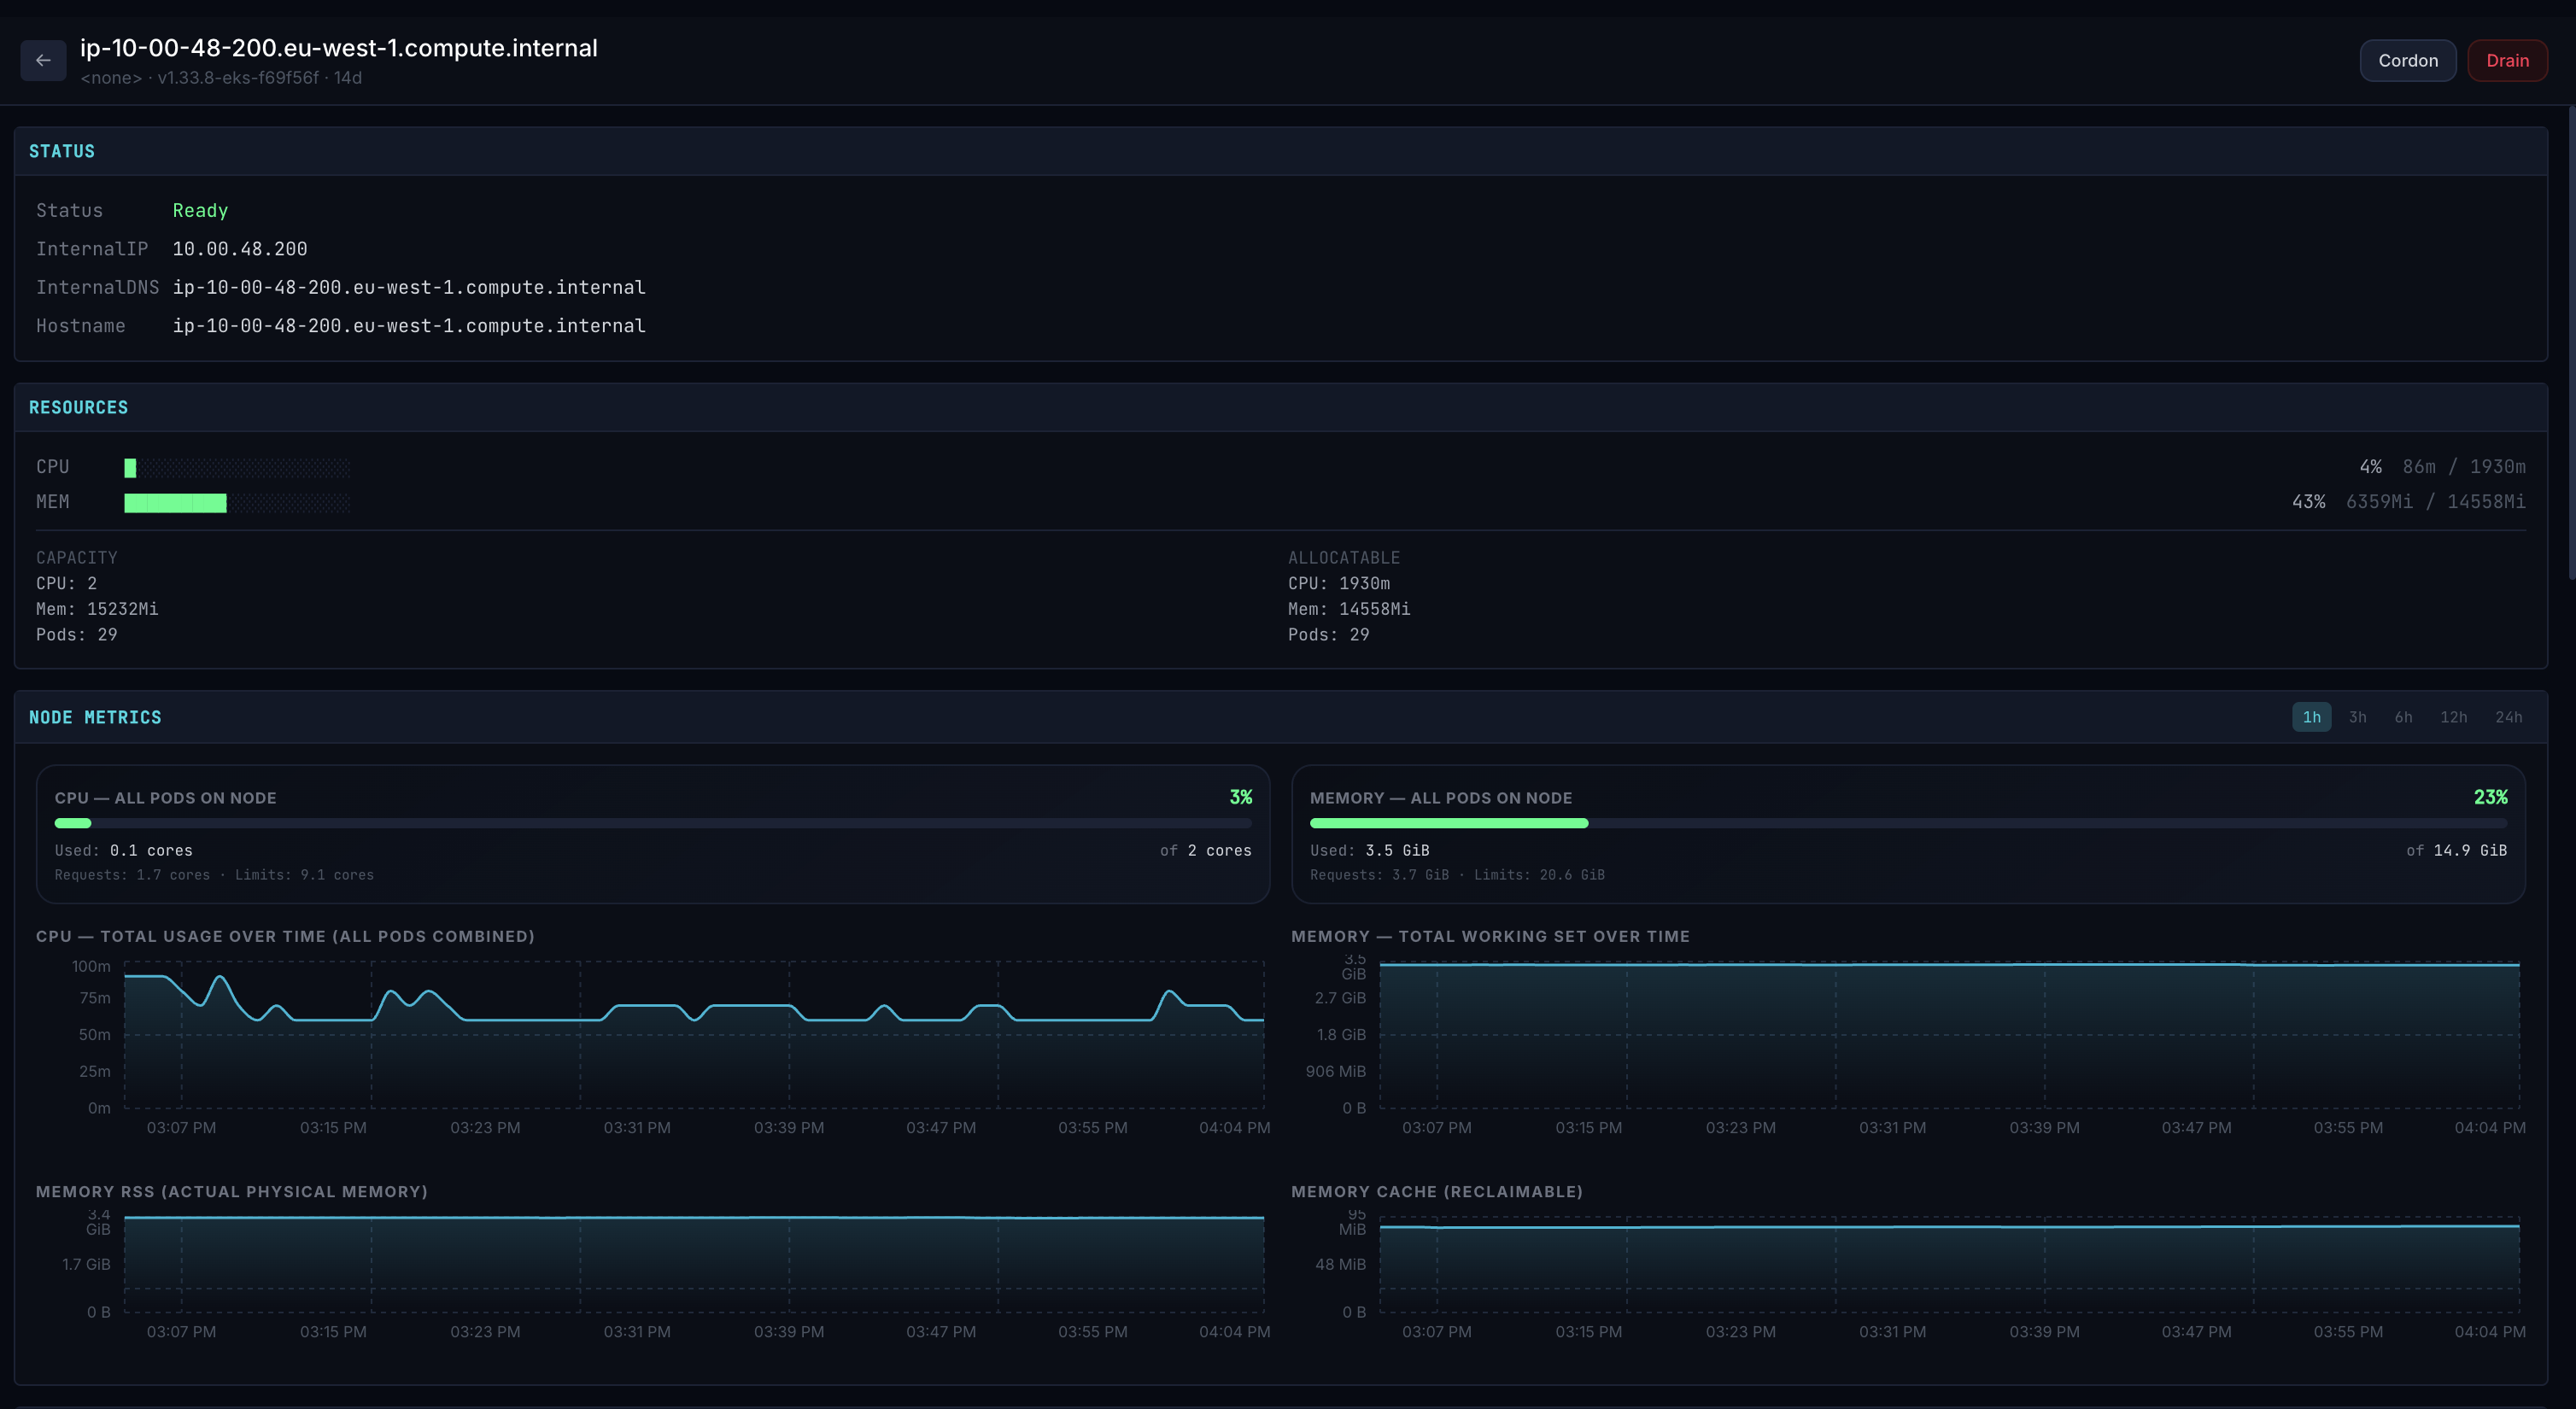
Node Detail — Pod heatmap, conditions, and drain wizard
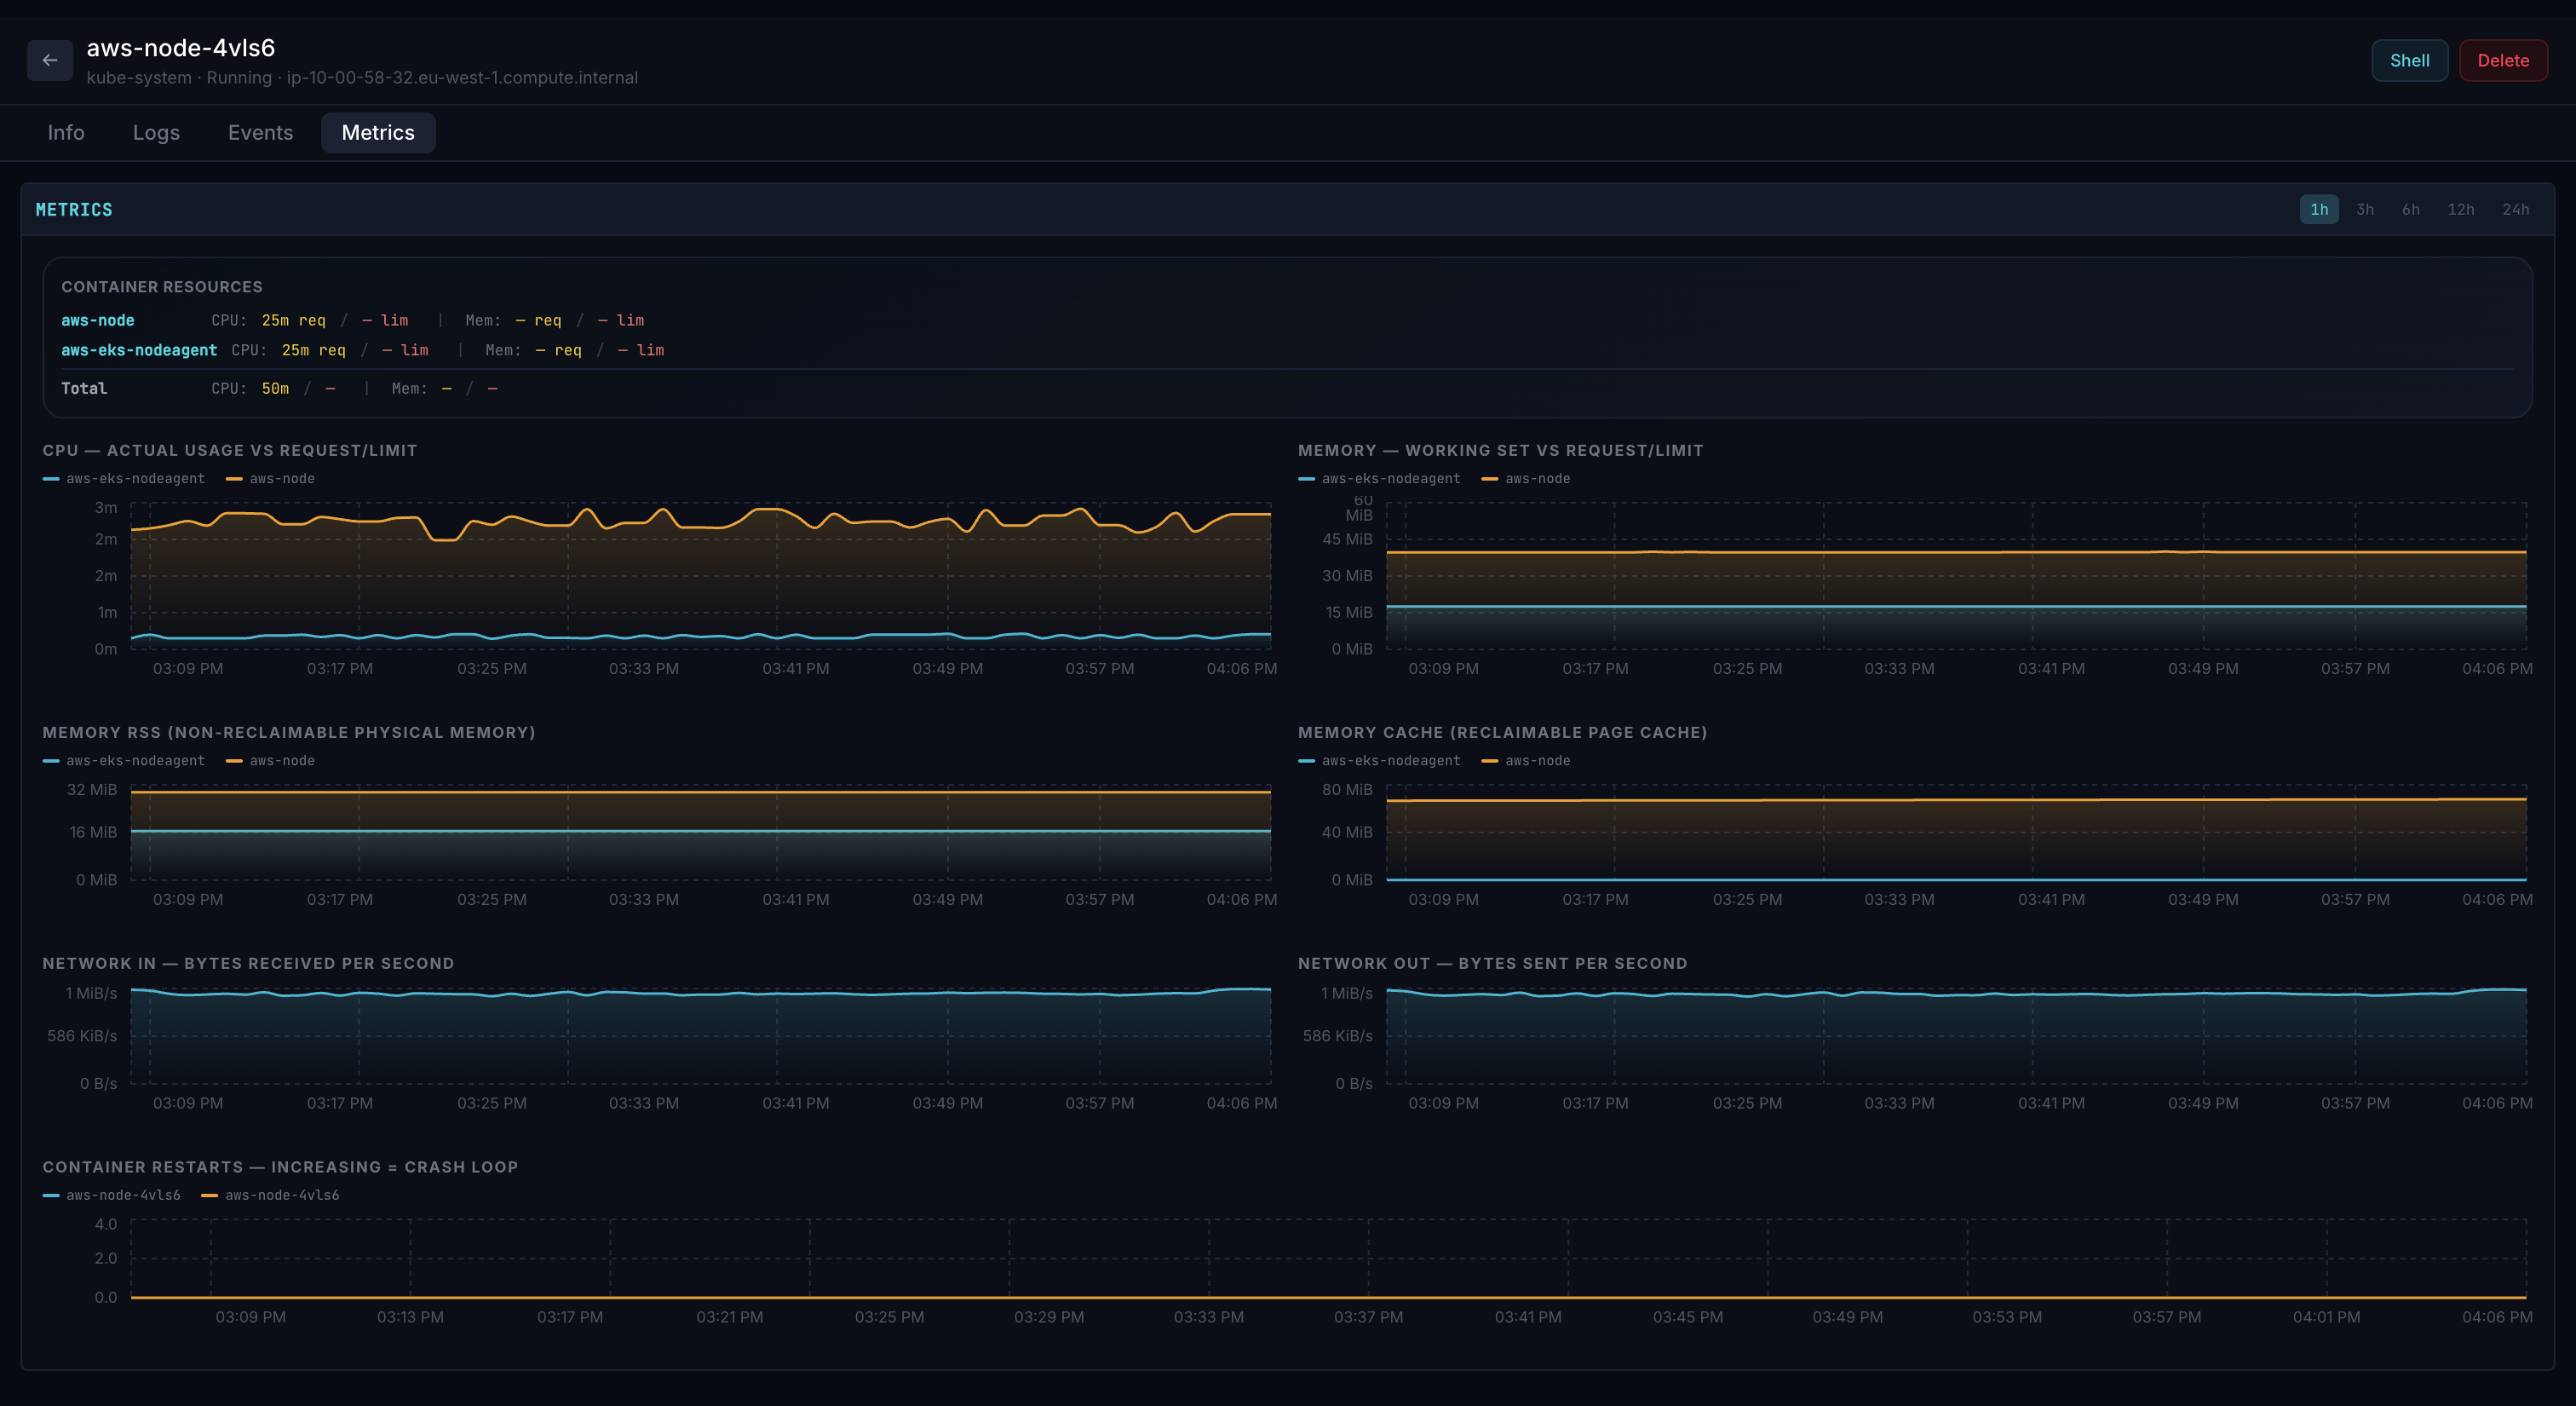
Pod Metrics — Prometheus CPU and memory charts
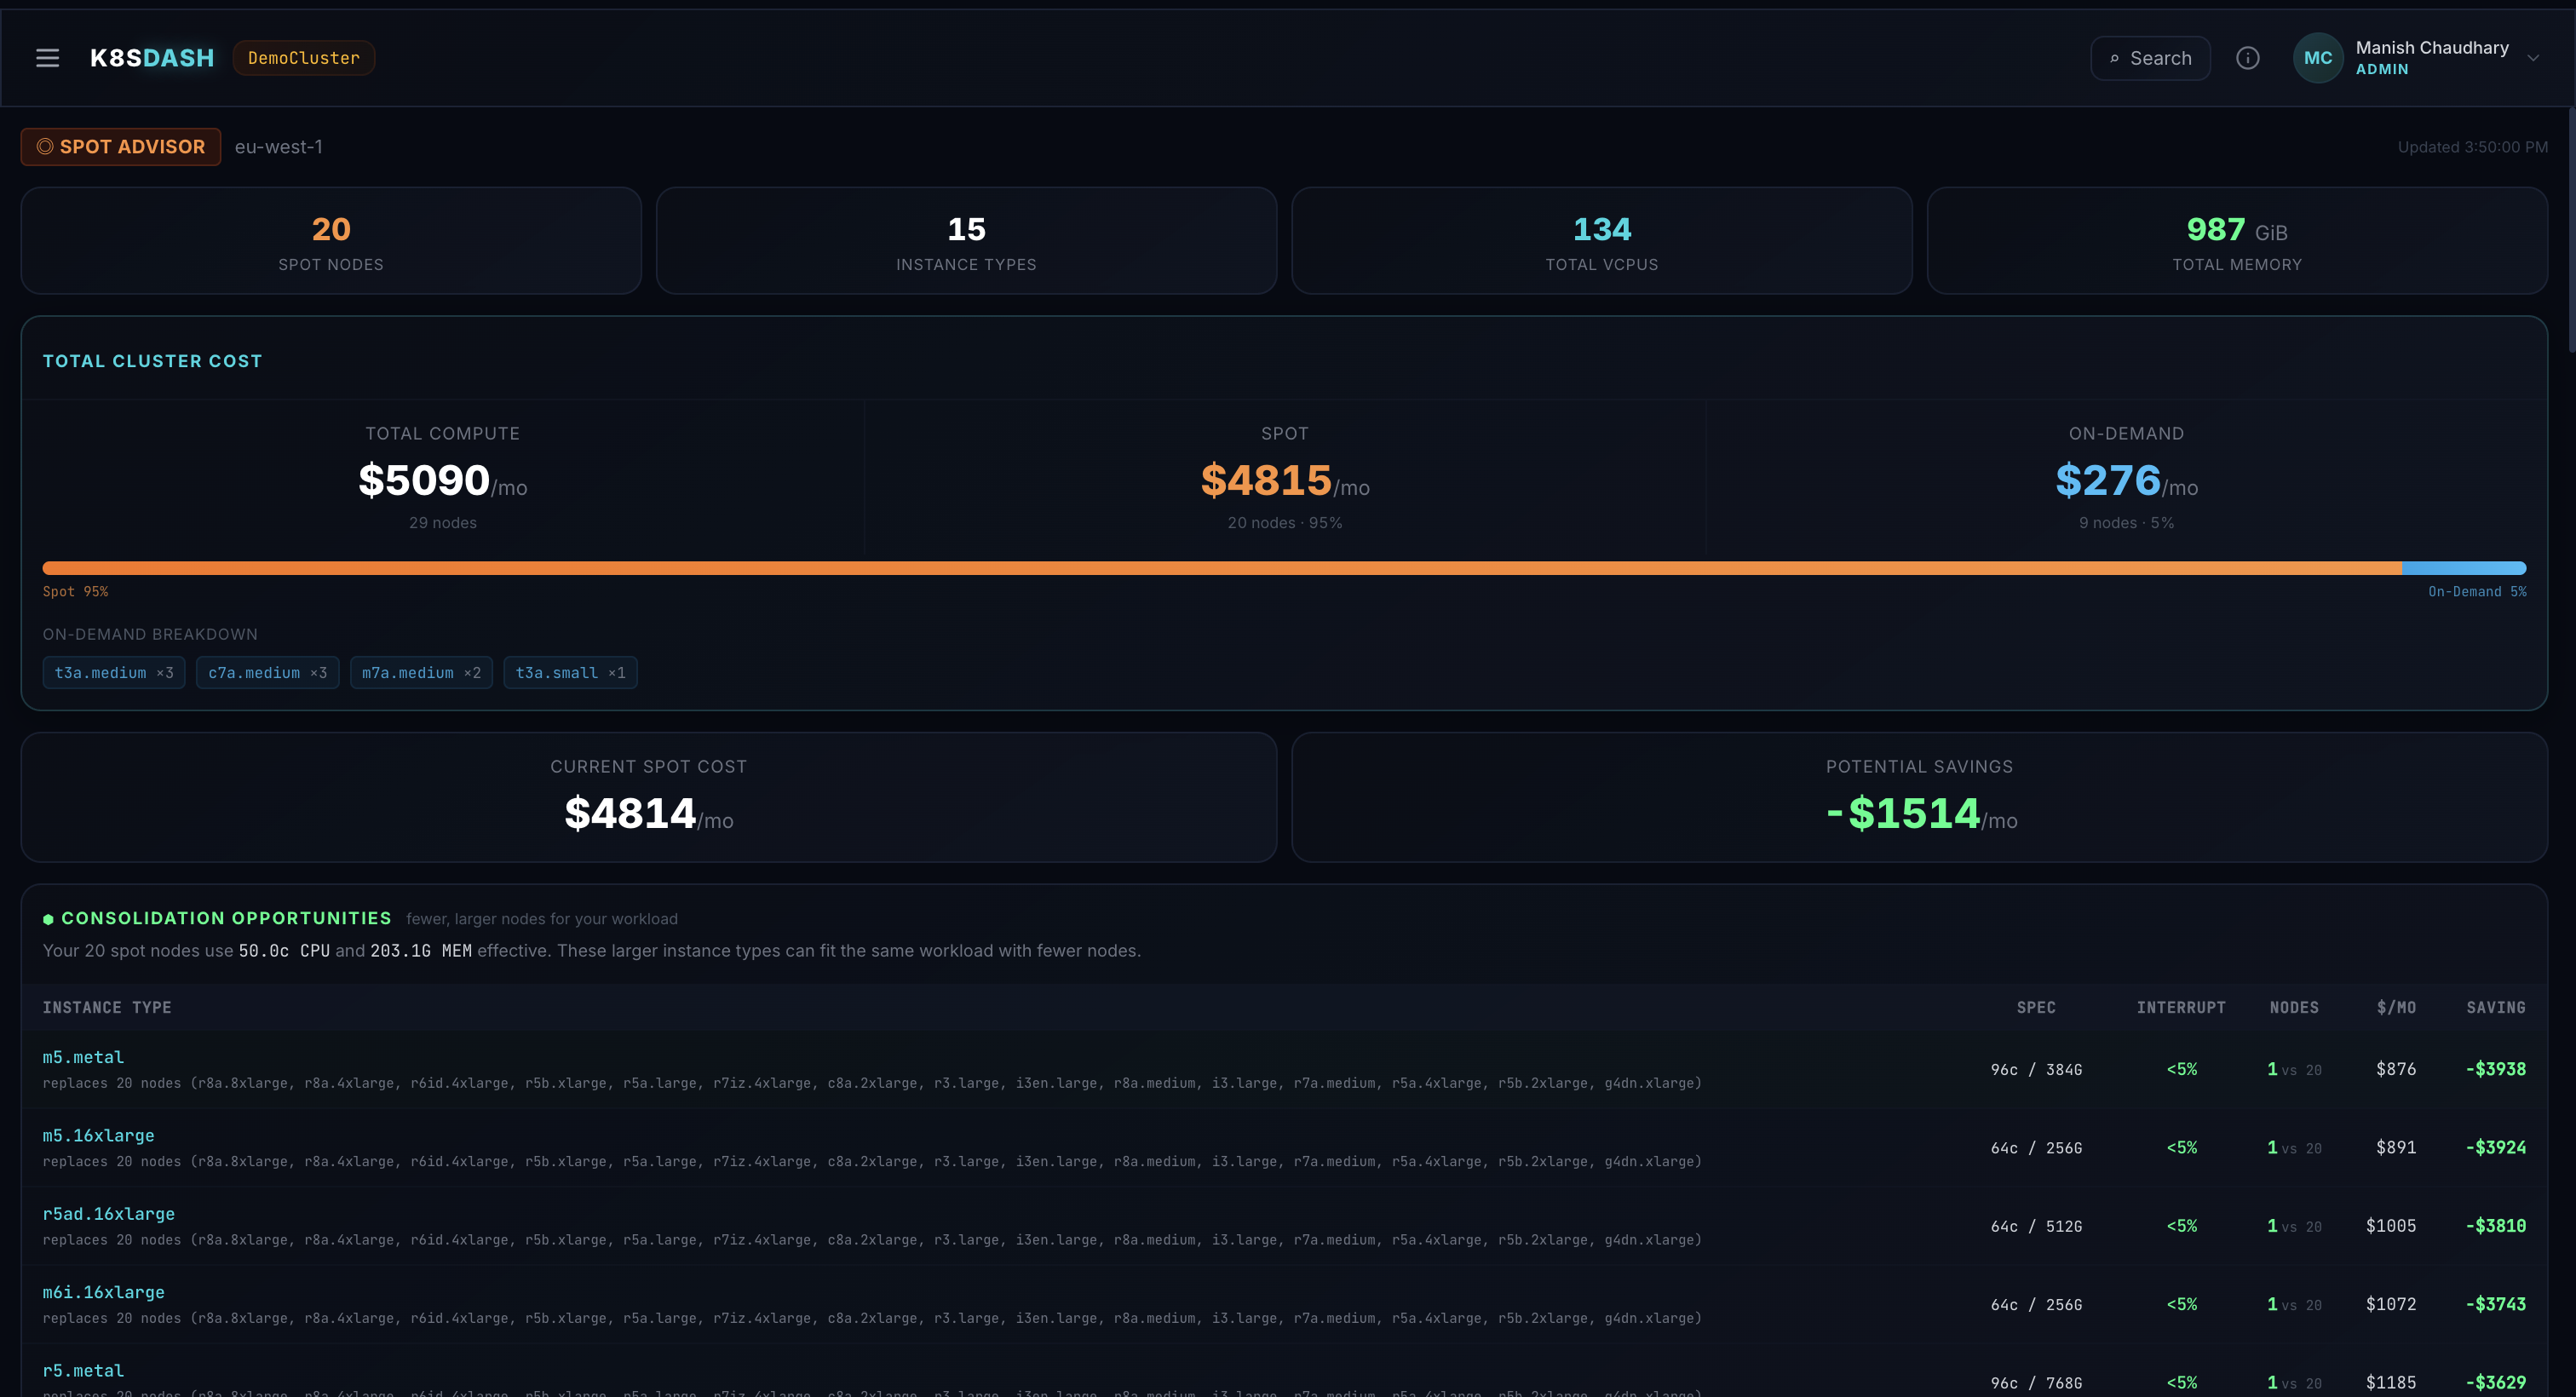
Spot Advisor — Cost optimization and instance recommendations