I created an interactive clustering visualization of 142K+ posts from HackerNews that were posted this past year and analyzed other parts of the dataset.
5 min read Published Updated
Try it out
https://hackernews-clustered-2025.labs.lincolnmaxwell.com/
HEADS UP: The visualization is ~20mb - don’t use on a metered connection!
Background
I’ve been lurking on HackerNews for the better part of the last four years now (wow, time flies!), but I didn’t actually create an account until this past December. It’s great to see a community of curious people, and I love how people are open to sharing their projects since before I was even born.
Since first messing around with the HN API in 2022, I’ve been meaning to do some larger scale analysis of the data for some time now, especially with AI becoming so ubiquitous and accessible nowadays.
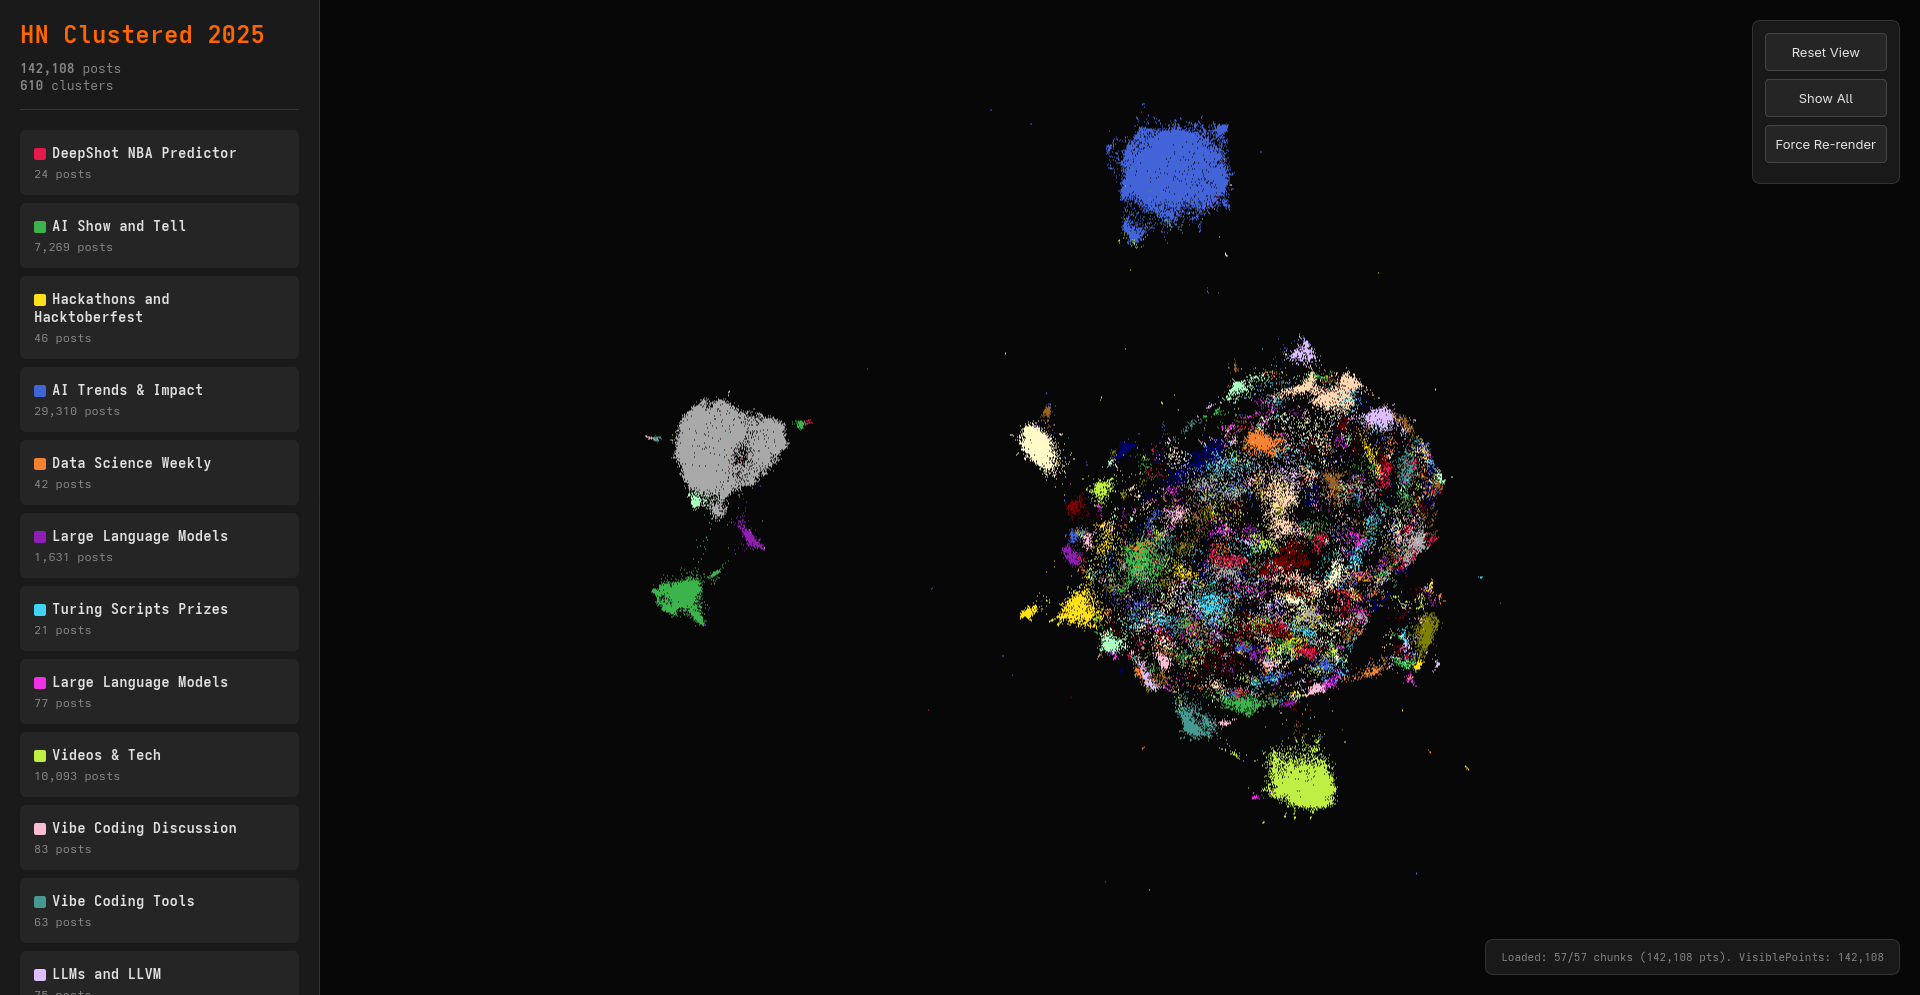
I think these cluster visualizations are fascinating, so I thought I’d make one for HackerNews posts in 2025. I had Gemma3-27B label each of the 610 clusters which contain a total of 142,108 posts shown here (although there were over 400K+ HN posts this past year). The visualization is not perfect by any means (embedding only the title doesn’t provide enough context for many posts), but I thought it was accurate and interesting enough to share.
Some of my favorite clusters from this year that came up were:
- “Service outages, disruptions” (348 posts)
- “Database systems performance” (1,631 posts)
- “Startup Founder Journey” (915 posts)
Technical overview
- Downloaded every post from January 1, 2025 until January 18, 2026 via the HN API
- Embedded titles locally with
transformersandnomic-ai/nomic-embed-text-v1via HuggingFace - Clustered posts with Nomic embeddings, PCA, UMAP, and HDBSCAN
- 2-day weekend project, ~14 hours total
- Code available on GitHub
- Data available on HuggingFace
Notable trends
- AI, AI, AI: The entire blue cluster at the top is all about AI. Gemma titled it “AI Trends & Impact.”
- Show HN: There are several clusters on the left comprised of only Show HN projects. Continuing with the popularity of AI on HN, the smaller purple cluster is Show HNs related to LLMs, the pink/teal cluster to the left of the gray cluster is Show HNs related to vibecoding, and the green cluster is titled “AI Show and Tell.” So there’s a lot of AI (unsurprisingly).
- DeepSeek: DeepSeek was so prevalent this year that several discrete clusters were created specifically for it.
- Rust: Similarly to DeepSeek, HN seems to love Rust enough that it came up in several different clusters.
- Cluster density: Clusters like “AI Trends & Impact,” “Space Exploration Discoveries,” and “Videos & Tech” are much more dense than clusters like “Linux Package Management.”
- The giant middle cluster: Consists of various tech news topics.
Other findings from the dataset
HN was most active during the workday in 2025
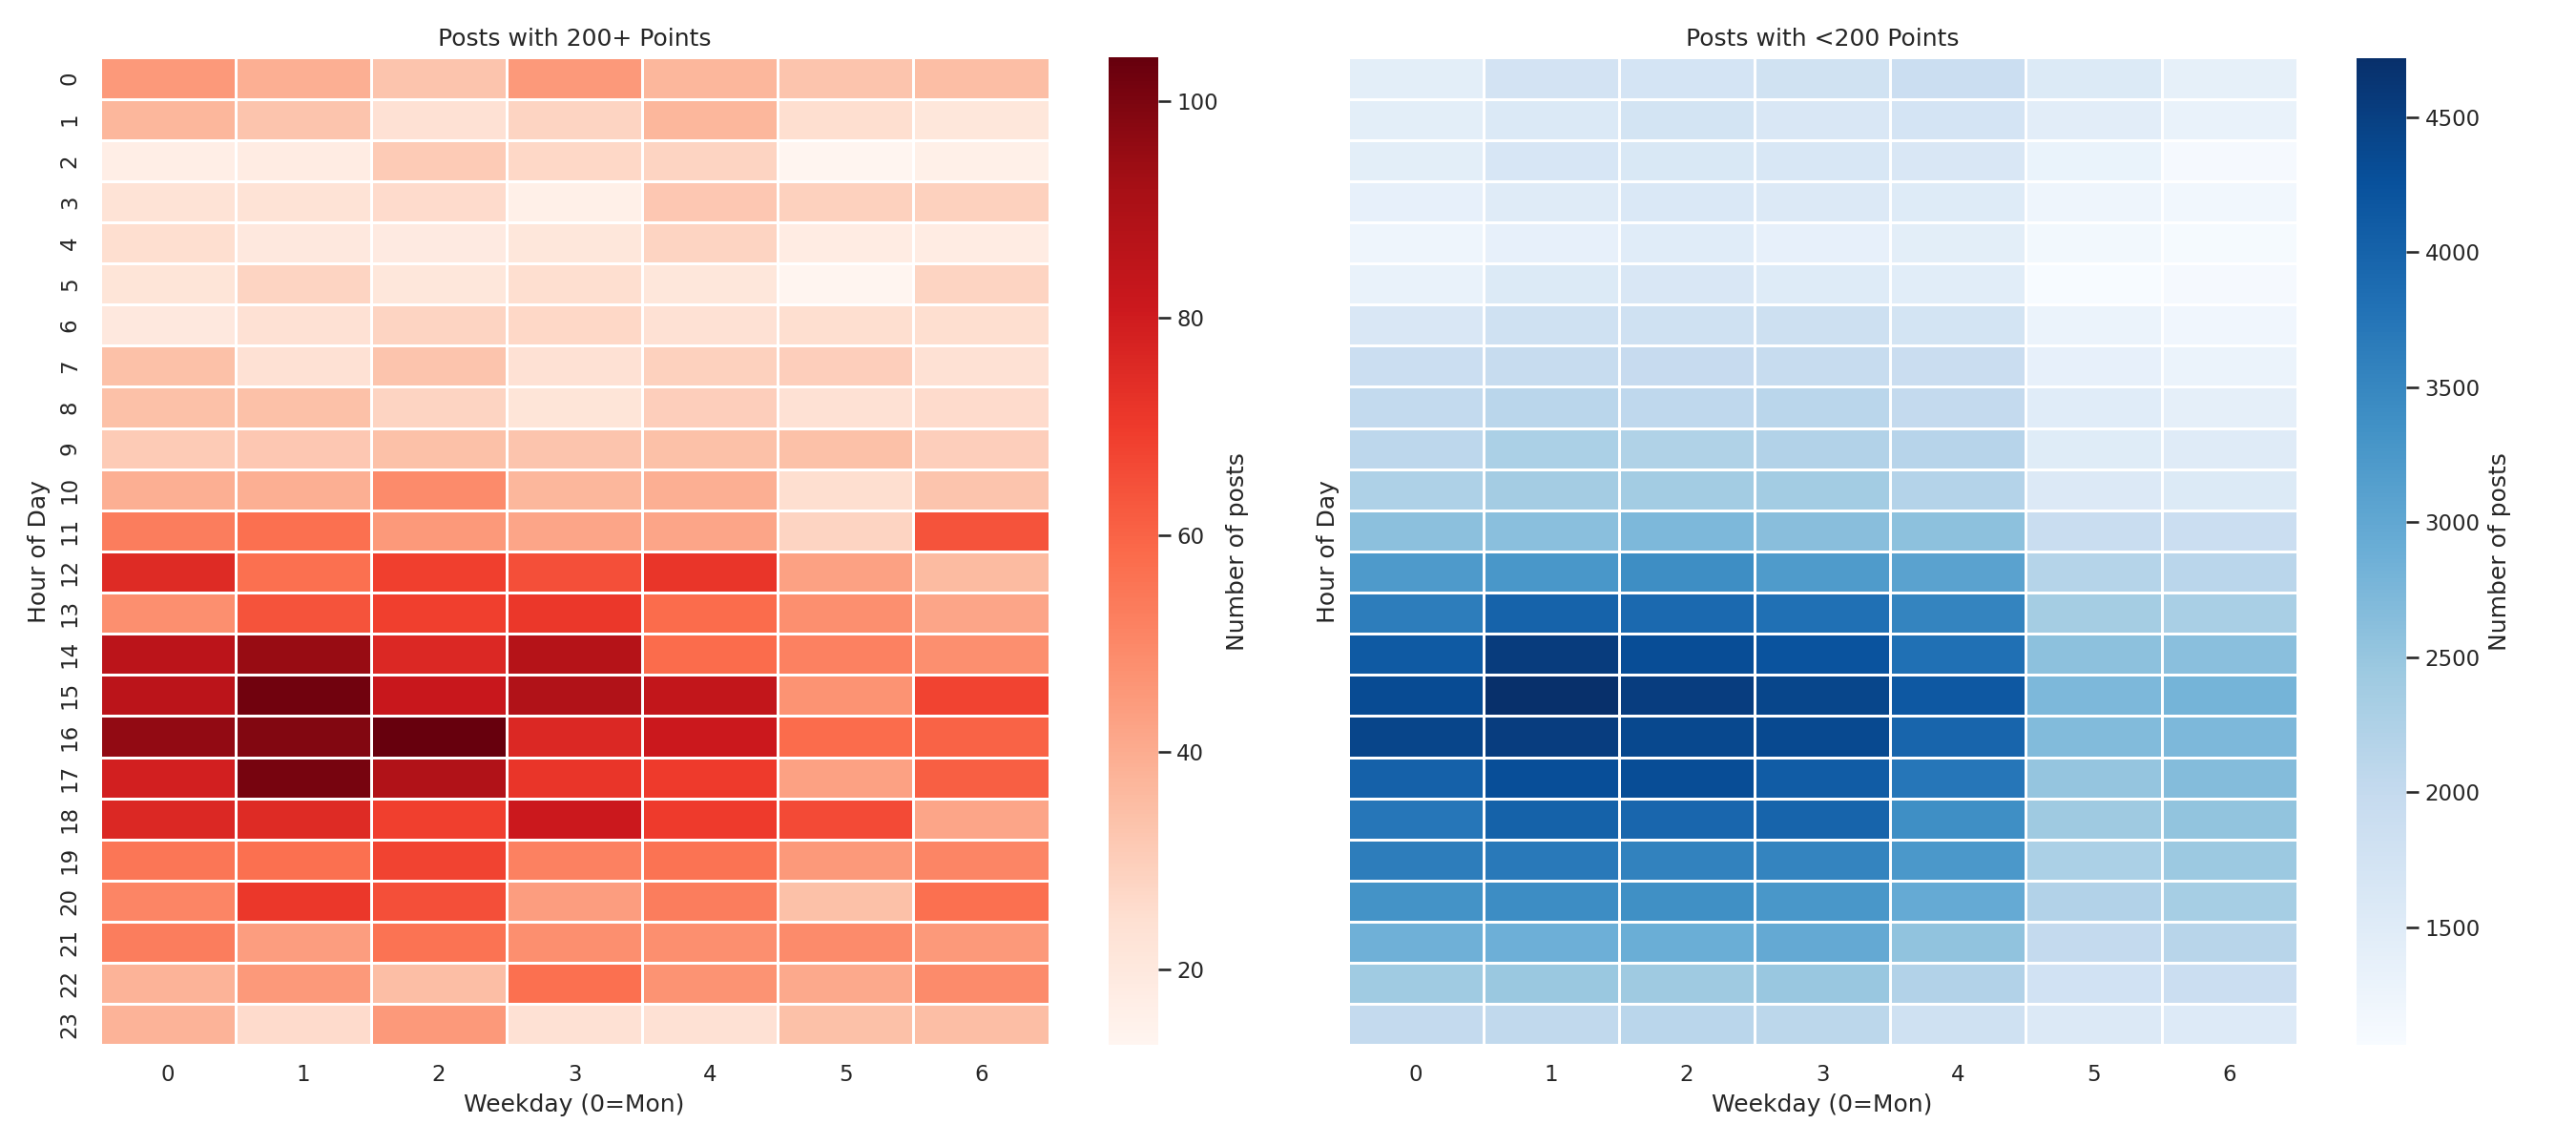
These two heatmaps show the times during the week when posts most frequently were created (in UTC). The left one is for popular posts (defined as having at least 200 points), while the right one is for posts with less than 200 points.
A few trends emerge:
- The most popular posts are created on Tuesday and Wednesday from 15-17 o’clock UTC. This corresponds to 10am in New York, 7am in the Bay Area, and 3pm in England. Considering these times all line up during the workday, it makes sense why popular posts emerge during this time. This is also roughly lines up with posts with less than 200 points.
- The weekends are significantly less active than the rest of the week. For posts with less than 200 points, there is a significant drop off on the weekends compared to the weekdays.
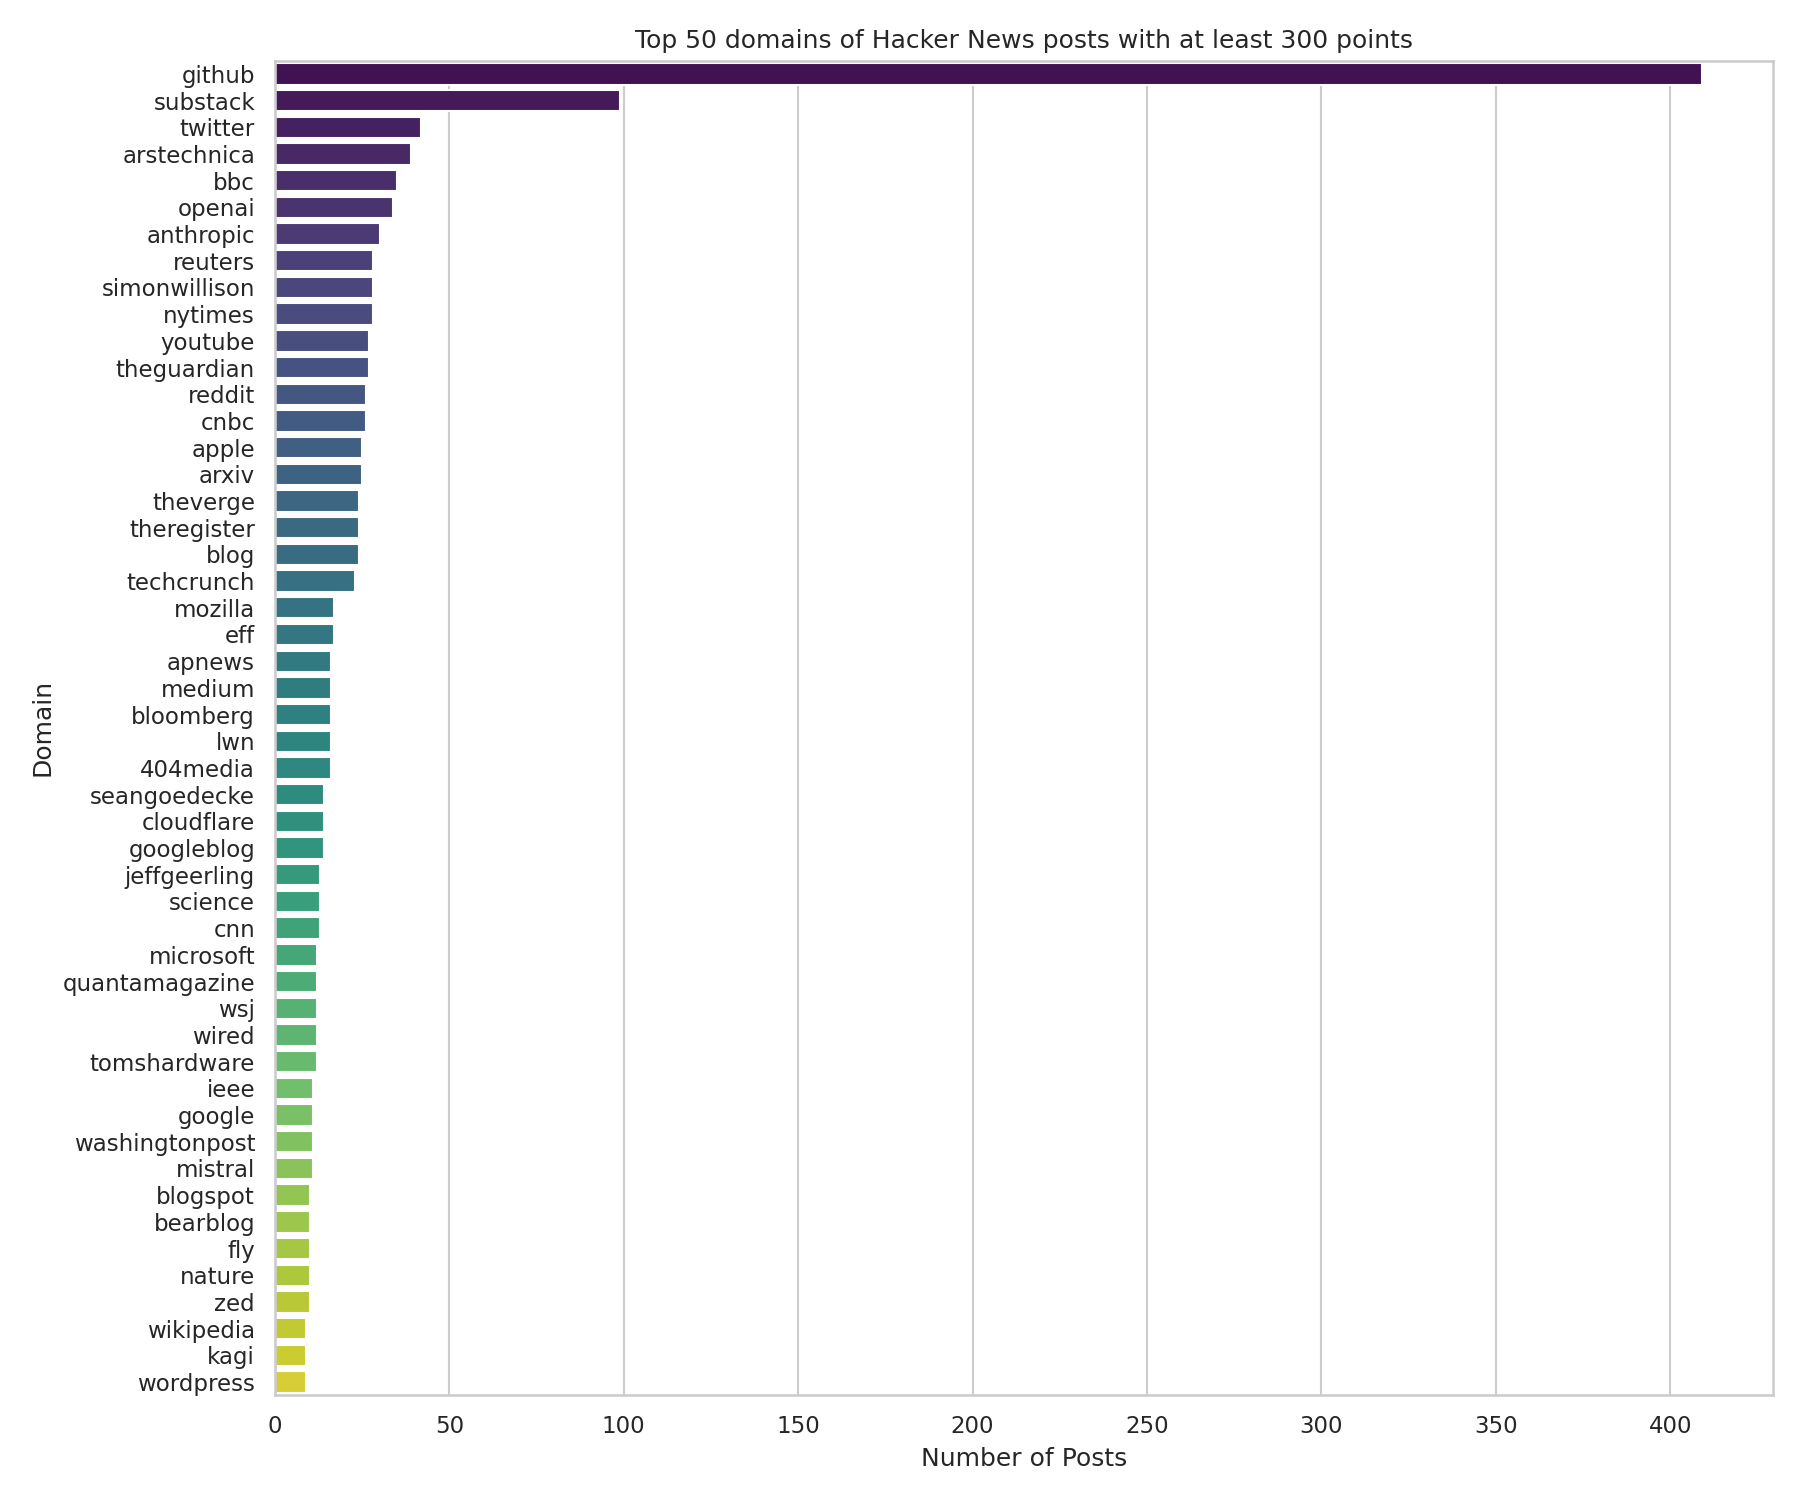
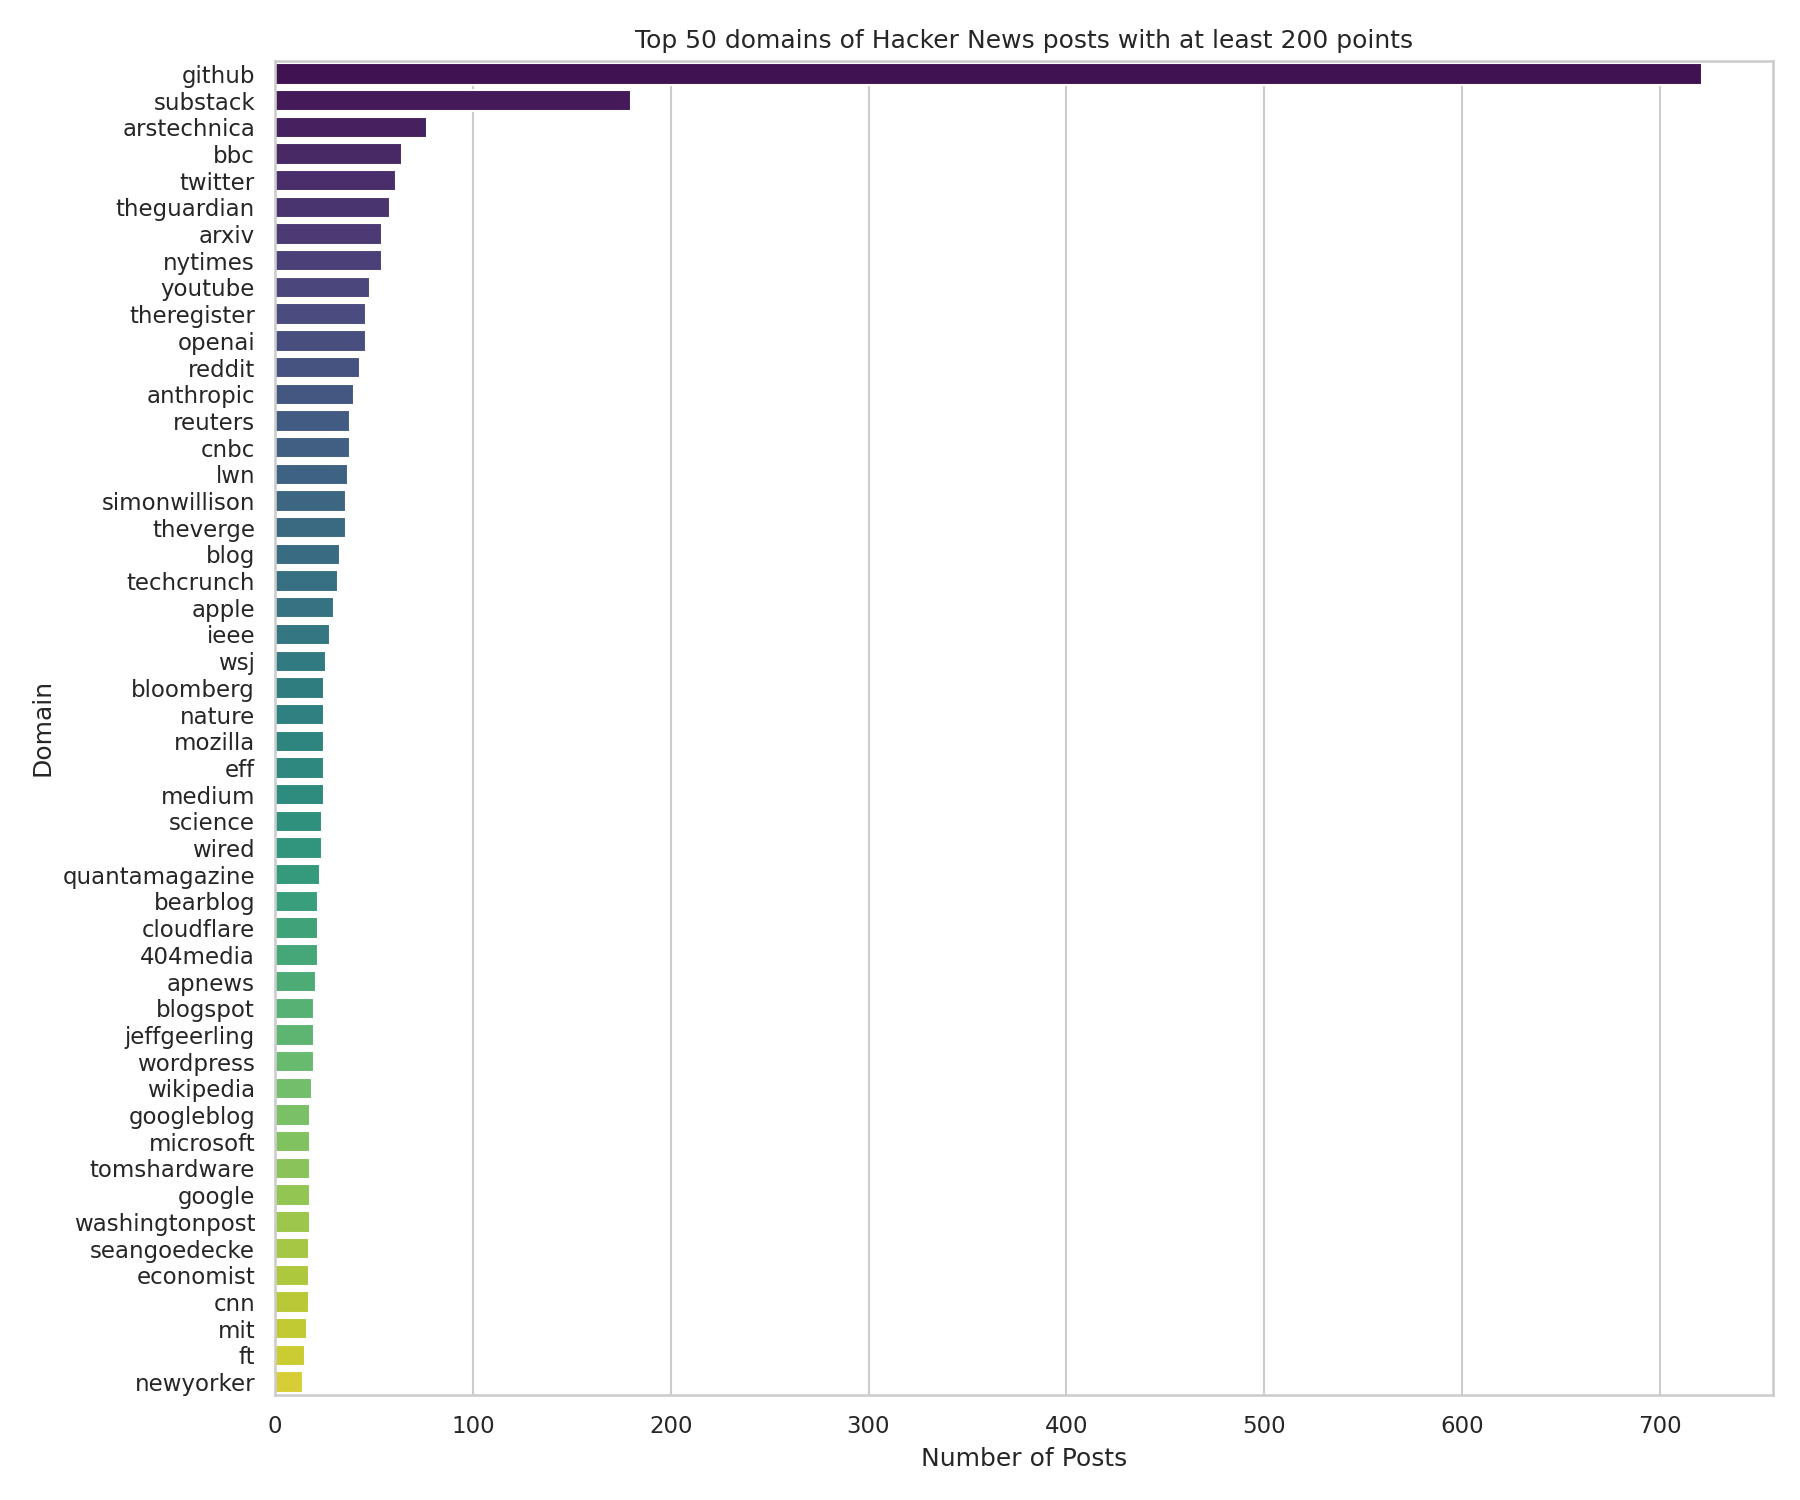
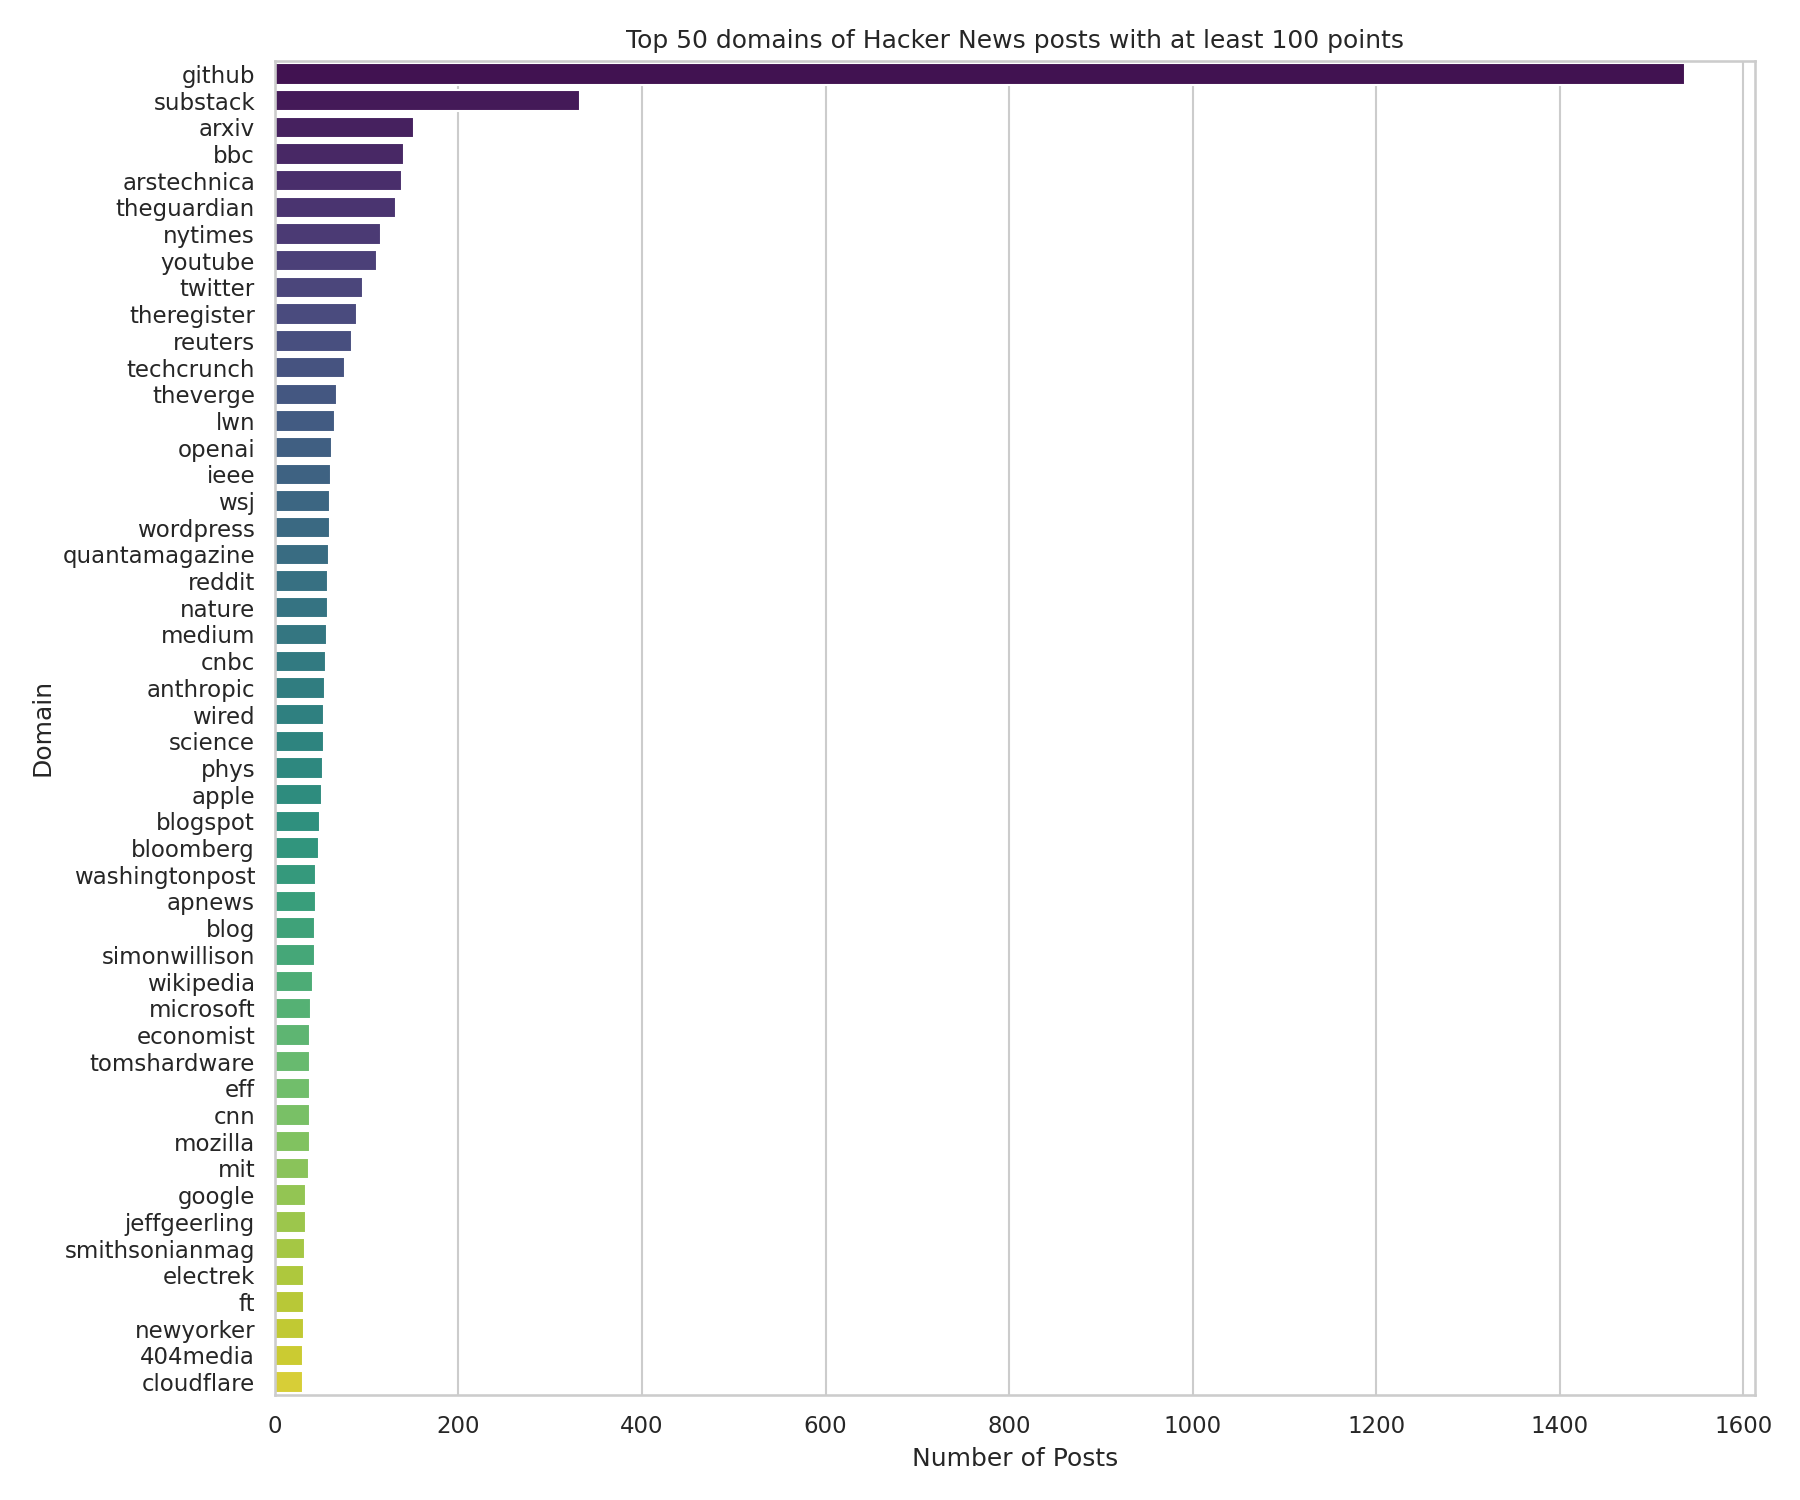
HN loved GitHub projects in 2025
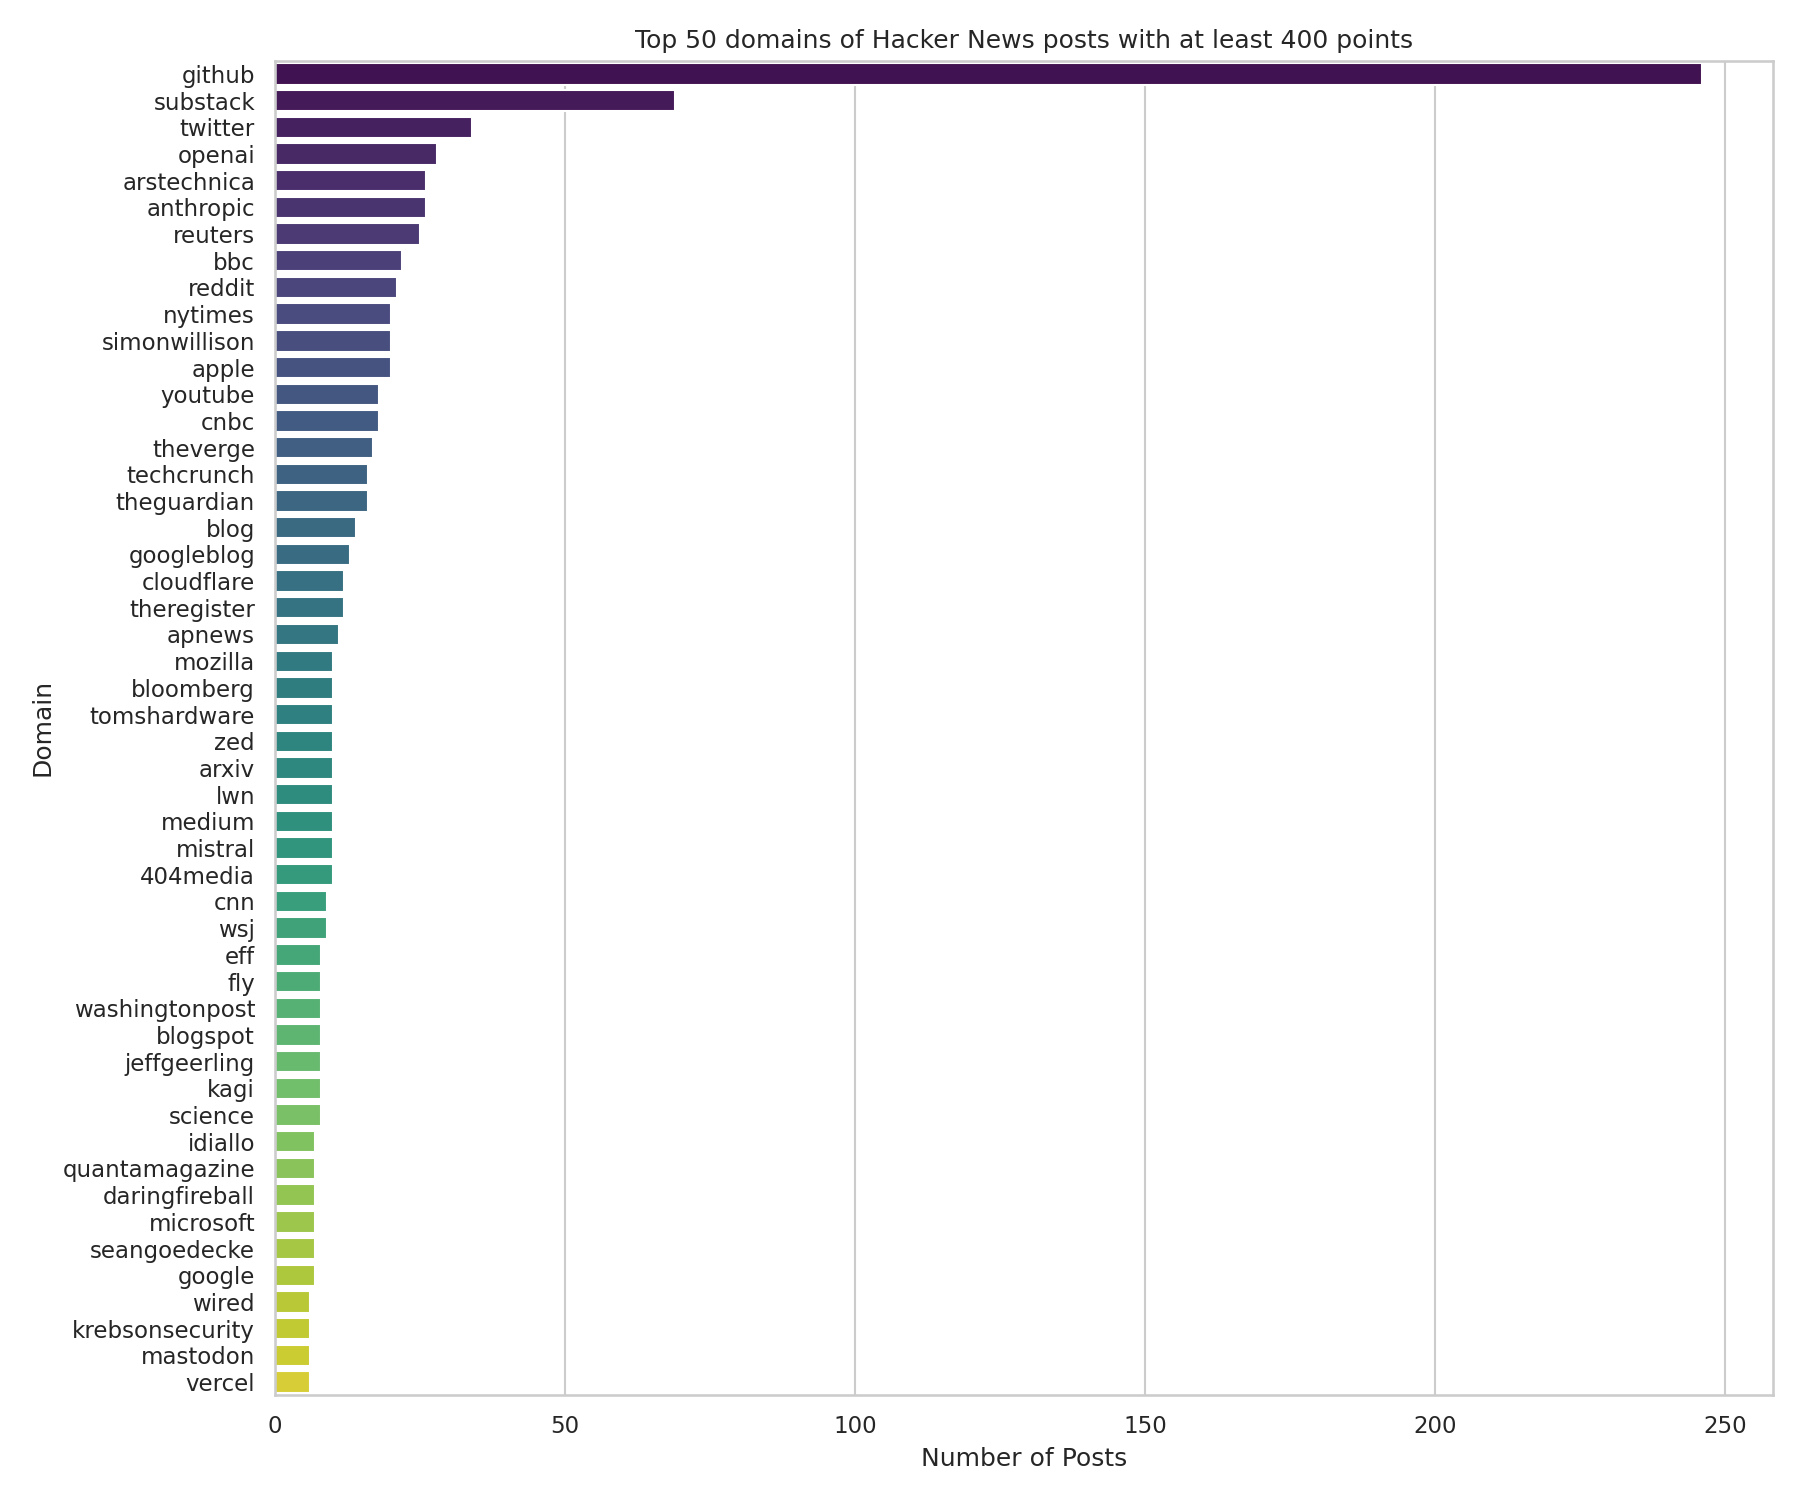
This chart shows the most frequent domains in posts with at least 400 points. GitHub tops the list by far with Substack and Twitter behind.
Interestingly, this trend stays about the same for posts with at least 300, 200, and 100 points, but changes dramatically when considering all posts.
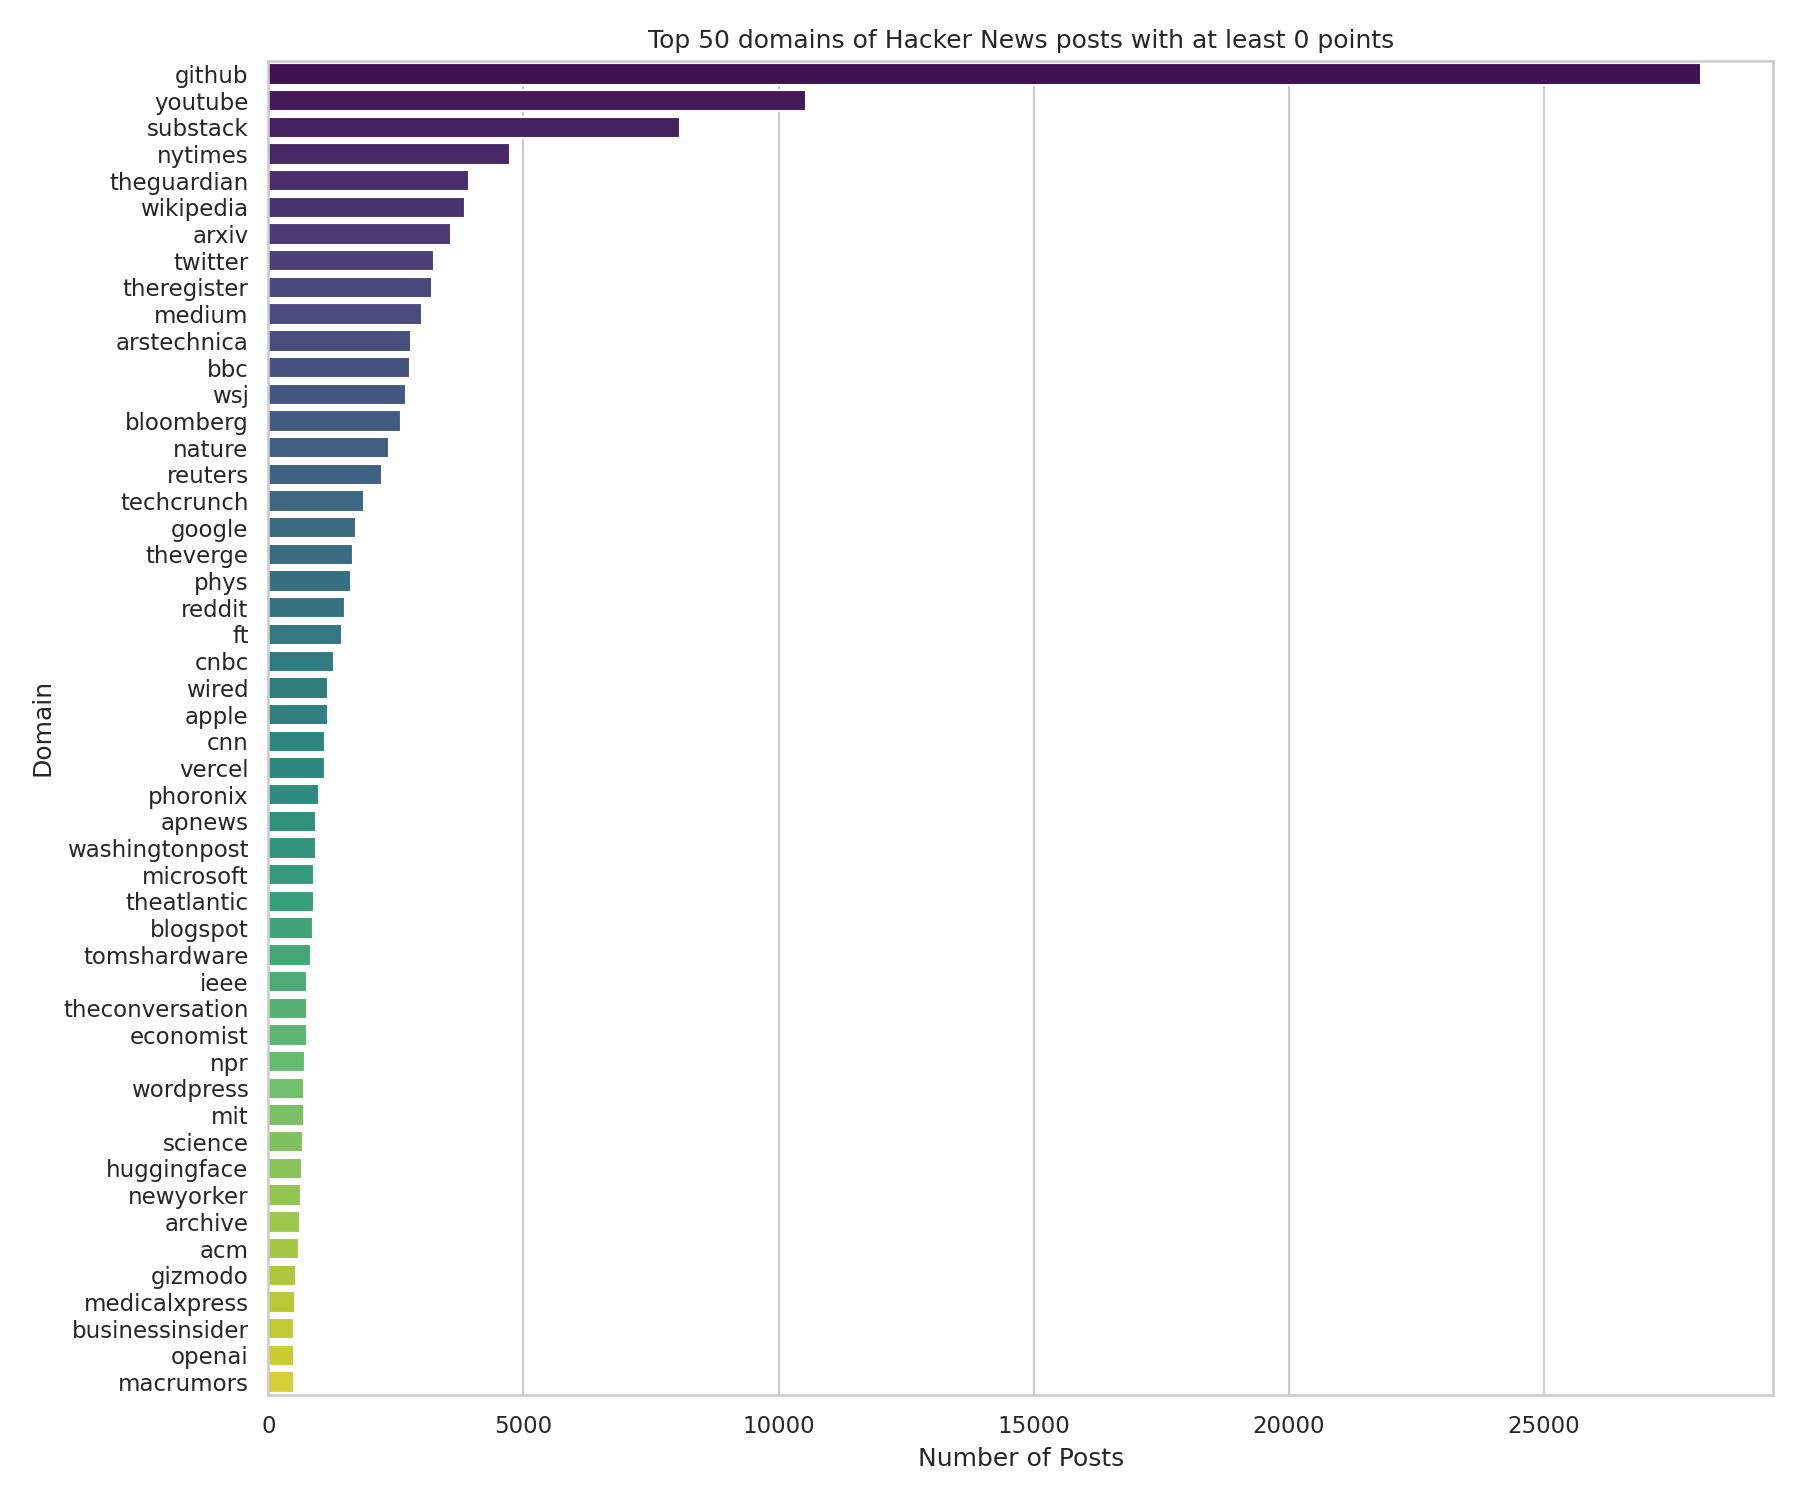
Considering all posts: YouTube takes second place, the New York Times jumps on the leaderboard, and so does Wikipedia.
HN’s favorite unigram of 2025: “ai”
| term | tfidf |
|---|---|
| ai | 6561.2543924697875 |
| new | 2277.11209141719 |
| code | 1867.078520835832 |
| open | 1803.6693148450092 |
| data | 1608.3677803441306 |
| source | 1508.9338636215111 |
| built | 1476.331440232781 |
| 2025 | 1432.4272968661385 |
| using | 1354.1435637483144 |
| app | 1350.5135146895277 |
| 1232.953205459649 | |
| tool | 1232.7890045959239 |
| time | 1178.4444878049483 |
| free | 1148.574446079199 |
| use | 1147.7354590473624 |
| agents | 1112.605337890672 |
| llm | 1084.69573963431 |
| software | 1079.7480326617667 |
| building | 1046.627708731249 |
| language | 1029.4686161799164 |
| web | 1025.763828274812 |
| coding | 1020.054456593646 |
| 1019.530766435755 | |
| agent | 1005.3172057324996 |
| apple | 987.3657681813922 |
| claude | 986.137952153375 |
| tech | 978.665871306545 |
| world | 964.990415743092 |
| llms | 959.2074352469024 |
| model | 940.5591168437396 |
| rust | 932.0167255258633 |
| trump | 922.2534409782381 |
| game | 914.1110501482614 |
| build | 894.14736189237 |
| models | 890.5546112551049 |
| china | 885.7370741268501 |
| like | 863.081571184089 |
| mcp | 862.4935143975465 |
| based | 841.3154741857576 |
| work | 831.7520929424049 |
| just | 818.356090283206 |
| openai | 808.5284375867557 |
| make | 788.812869969981 |
| linux | 778.8873338879072 |
| years | 772.0731107250441 |
| search | 754.8735116465413 |
| year | 741.2352439127106 |
| people | 740.959083444269 |
| real | 740.3703841144818 |
| python | 737.078432780251 |
The above table is the top 50 unigrams from HN this past year by running TF-IDF over the data. Unsurprisingly, “ai” tops the list be far.
HN was relatively safe in 2025
===== SUMMARY =====
Total posts: 416,829
Blacklisted posts: 2 (0.00%)
Non-blacklisted posts: 416,827 (100.00%)

===== SCORE DISTRIBUTION (5-NUMBER SUMMARY) =====

Blacklisted domains:
     min: 1
      q1: 1.5
  median: 2.0
      q3: 2.5
     max: 3
As I was downloading the dataset, I was exploring some of the links people had sent in just for fun. I wasn’t really thinking about what I was really doing until I clicked on a link and a red Firefox screen came up saying “deceptive site ahead” or something like that.
So, after the dataset was fully downloaded, I got curious. I compiled a blacklist of 48,519 domains from multiple filters, and ran it through the data. With only 2 bad domains posted this year, I guess I just got pretty (un)lucky!
Wrapping up
I can’t help but think about how AI has flipped the tech industry over during the past few years. It feels like 95% of posts and tech news nowadays are about AI. I don’t think that this is a bad thing, though. If I were to pick between a new JavaScript framework or LLM daily, I’d choose a new LLM daily in a heartbeat.
This project was a blast to put together, and I’m looking forward to seeing how these clusters shift by the time 2026 wraps up. If you want to dive into the data yourself or poke around the code, everything is linked in the technical overview above.
Feel free to contact me via email with any questions, comments, concerns, praise, opportunities, or anything else!