tl;dr: I tested whether framing an LLM evaluator as a “safety researcher” changes how it classifies AI failures. After measuring noise baselines across 25 models, 9 showed frame effects entirely explained by randomness. Where real effects exist, they operate through vocabulary flooding, not improved evaluation. Without baseline correction, I would have come to the opposite conclusion.
How this started
I use AI coding agents as part of my work environment. I started
instrumenting them, logging every tool call, tracking failures,
documenting what went wrong, and built an adversarial review framework
that has now recorded 23,000+ tool invocations across 490+ sessions and
250+ tagged failures. Each failure gets a taxonomy label and a
detected_by field recording who caught it: the
user, an automated check, or the agent itself.
During a routine retrospective, while the agent was analysing past failures, it committed the same type of failure it was reviewing. That made me look more carefully at the logs. The same failure type, logged in different operational contexts (development versus policy work), got entirely different descriptions: different vocabulary, different emphasis, different framing of what went wrong. The failure categories themselves had been shaped by the perspective of whoever was logging them. The instrument was contaminated by the observer.
That raised a harder question: if the human-defined taxonomy was observer-shaped, what about model-generated classifications? When I ask an LLM to evaluate a trace, is the result a property of the trace or a property of the evaluator?
The experiment
I took 23 traces from the MAST dataset (Multi-Agent Systems Failure Taxonomy.), annotated examples of multi-agent coordination failures with a clean taxonomy. Each trace is a concrete record of what happened in a multi-agent system, with human-annotated failure categories.
For each model, I ran every trace through a three-stage evaluation process:
- Observation: Describe what happened in the trace (free text)
- Interpretation: Analyse whether and what went wrong (free text)
- Classification: Assign a failure category from the MAST taxonomy
Each model evaluated each trace twice: once with a neutral frame (“evaluate this trace”) and once as a “safety researcher”, but otherwise same traces, same taxonomy, same process with only the framing changed.
The raw difference between the two runs is the “frame effect”, the percentage of traces where classification changed between frames.
The first results
My initial experiment used three commercial API models: Claude Sonnet 4, Gemini 2.0 Flash, and GPT-4o. The results looked clean:
- Gemini 2.0 Flash: 59% frame effect, entirely vocabulary-mediated (the safety frame triggered a flood of safety-related vocabulary)
- Claude Sonnet: 40% frame effect, mostly vocabulary-mediated
- GPT-4o: 17.4% frame effect, but with a twist: the classifications changed without vocabulary changes. The frame seemed to operate at the decision boundary, not perception.
The GPT-4o finding was especially interesting. It suggested two distinct mechanisms: vocabulary flooding (Claude/Gemini) versus an “invisible” decision-boundary effect (GPT-4o). Then I ran baselines.
The baseline that changed my perception
Here’s what a baseline test looks like: run the exact same evaluation (same trace, same frame, same prompt) twice at temperature 0.3 (a common setting for evaluation tasks) and check how often the classification differs between the two runs. No manipulation, just measuring how much the model varies on its own.
This is the noise floor. If your “effect” doesn’t exceed it, you’re measuring randomness. The difference between frame effect and noise floor is the net signal, measured in percentage points (pp).
The results were not what I expected:
| Model | Frame Effect | Noise Floor | Net Signal |
|---|---|---|---|
| Claude Sonnet 4 | 35-48% | 30.4% | ~4pp |
| GPT-4o | 17.4% | 30.4% | -13.0pp |
| Gemini 2.5 Flash | 52.2% | 39.1% | 13.1pp |
Note: the pilot used Gemini 2.0 Flash (59% raw frame effect). By the time I ran baselines, I used Gemini 2.5 Flash, so the baseline comparison uses 2.5 Flash with a fresh frame measurement (52.2%). The two versions are not directly comparable and the 2.5 Flash numbers are added because they have matched baselines. Claude Sonnet 4 was measured multiple times (initial: 40%, two re-runs on matched 23-trace sets: 35%, 48%). The table shows ~4pp from the canonical re-run (35%); the averaged figure across all three runs would give ~10pp.
Claude Sonnet 4’s frame effect varied between 35% and 48% across re-runs, with the canonical measurement giving just 4pp after noise correction, weak and barely above the floor. The averaged figure across all three runs (~10pp) is more generous, but the 13pp spread between identical setups illustrates why no single point estimate should be trusted. GPT-4o was worse: its frame effect was actually below its noise floor. The “invisible decision-boundary mechanism” I’d found was an artefact of insufficient controls. Gemini 2.5 Flash showed moderate real signal (13pp), but nearly half its raw effect was noise.
Scaling up
Once I understood the importance of baselines, I expanded to 25 models spanning commercial APIs, open-weight models via DeepInfra, and local models via Ollama. For each model: frame effect measurement, noise baseline, and t=0 measurement to decompose the noise further.
Here’s what survived baseline correction:
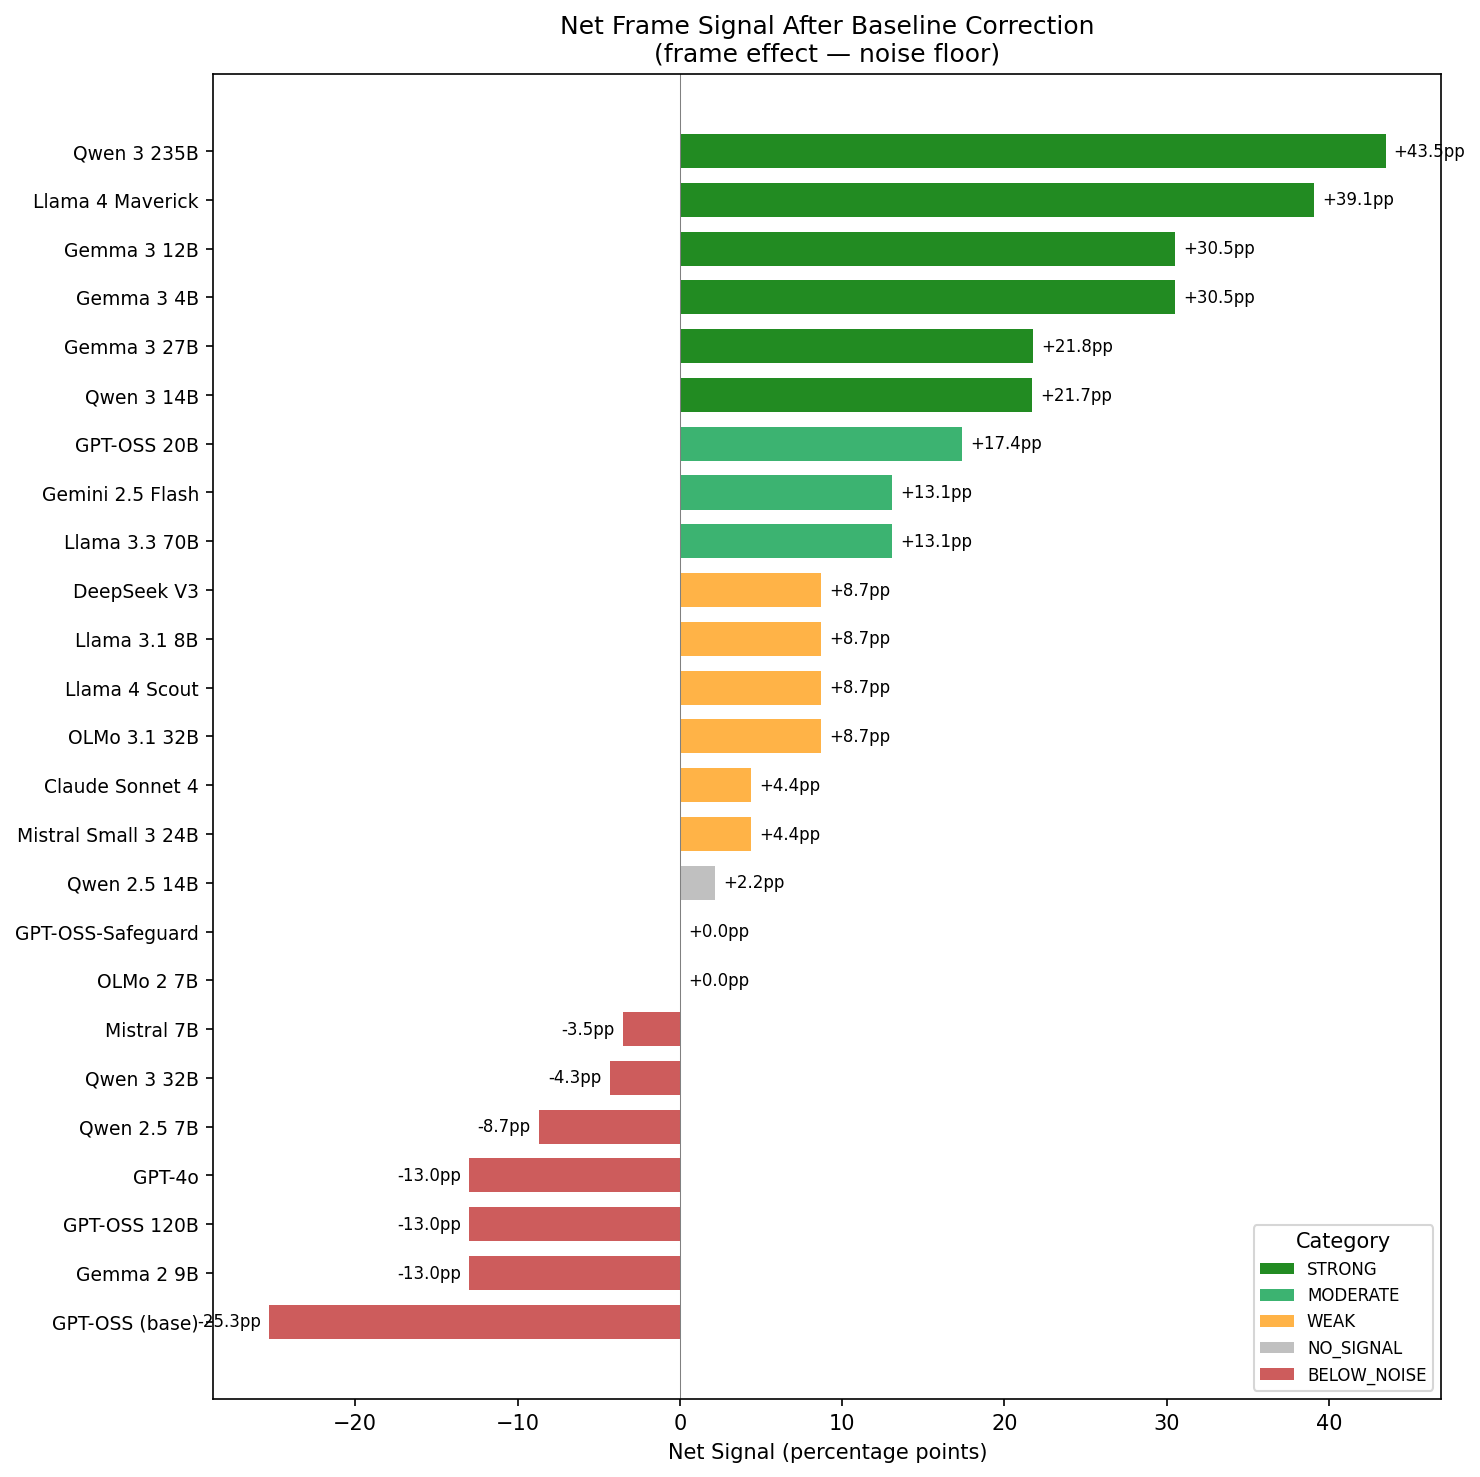 Net
signal = frame effect - noise floor. Green = real effect. Grey/red =
noise.
Net
signal = frame effect - noise floor. Green = real effect. Grey/red =
noise.
Out of the 25 models with matched baselines:
- 6 showed strong signal (>20pp net): Qwen 3 235B, Llama 4 Maverick, Gemma 3 4B, Gemma 3 12B, Gemma 3 27B, Qwen 3 14B
- 3 moderate (13-20pp): GPT-OSS 20B, Gemini 2.5 Flash, Llama 3.3 70B
- 6 weak (4-13pp): including Claude Sonnet 4, DeepSeek V3, Llama 3.1 8B, Mistral Small 3 24B
- 2 no signal: GPT-OSS-Safeguard, OLMo 2 7B
- 1 borderline (~2pp): Qwen 2.5 14B
- 7 below noise: including GPT-4o, GPT-OSS 120B, Gemma 2 9B, Mistral 7B, GPT-OSS (base)
The scatter plot makes the pattern clearer:
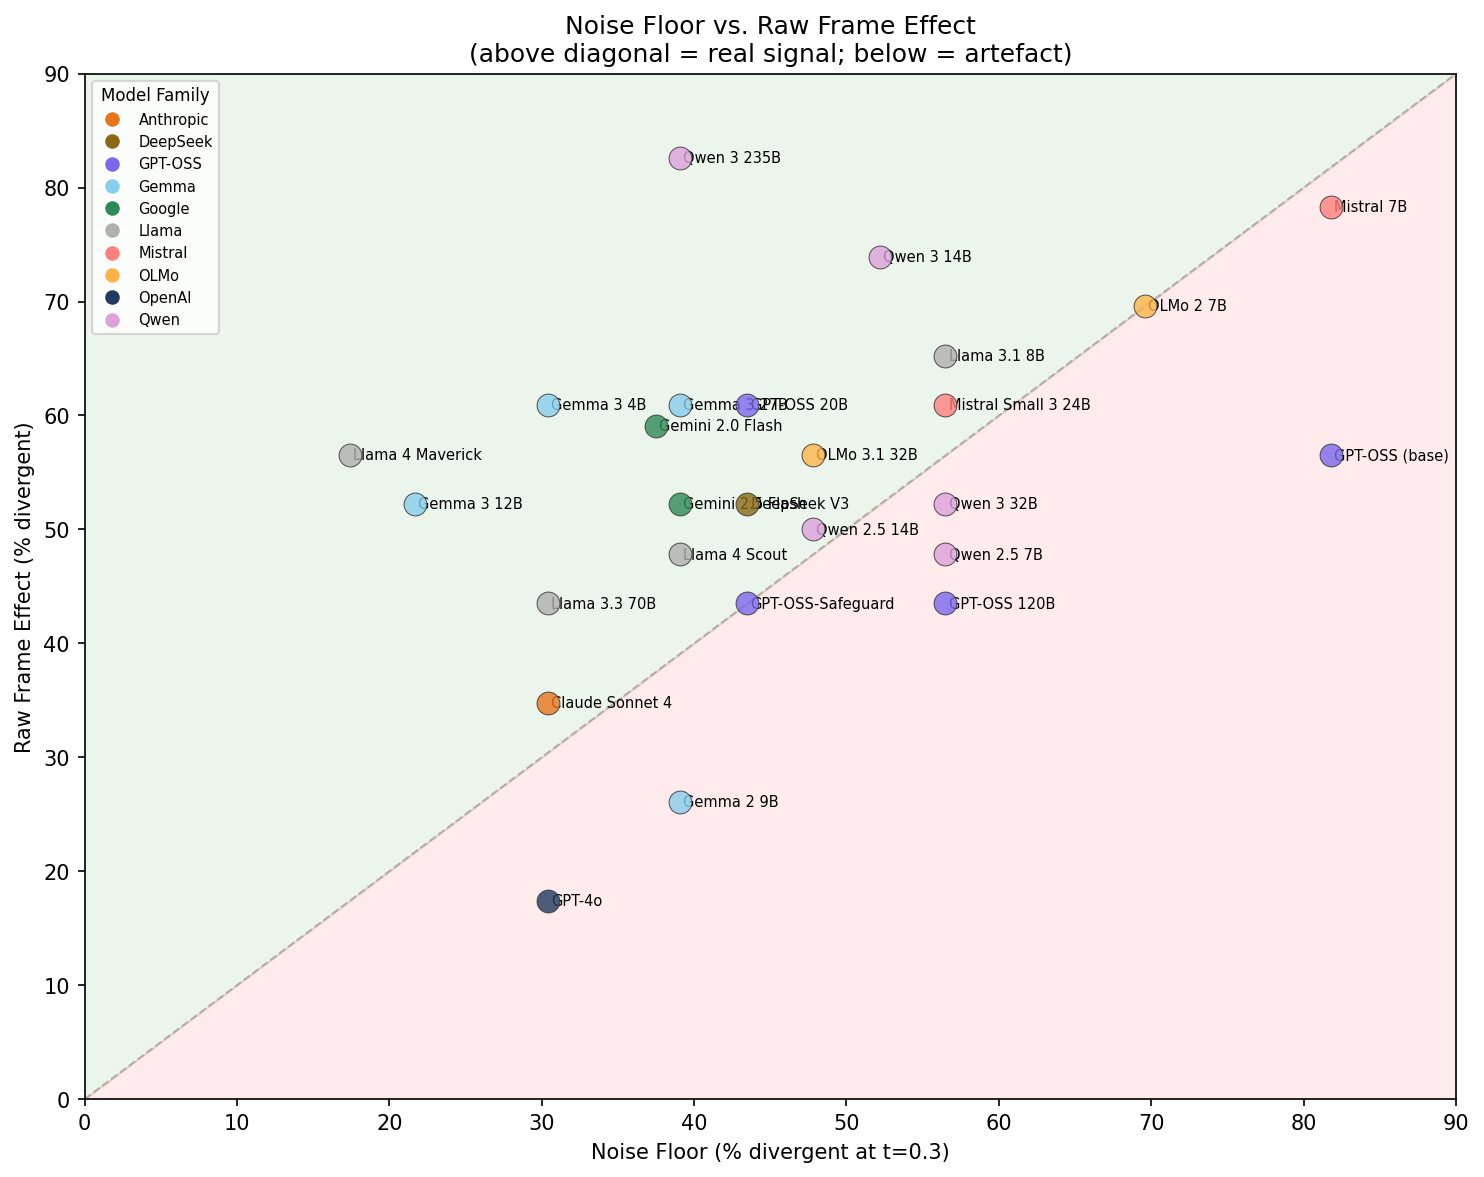 The diagonal is
where frame effect equals noise. Above = real signal. Below =
artefact.
The diagonal is
where frame effect equals noise. Above = real signal. Below =
artefact.
Two things jumped out:
First, the models with genuine frame effects were not the well-known commercial models. They were mid-tier open-weights, specifically the Gemma 3 family, Qwen 3 235B, and Llama 4 Maverick. Claude Sonnet 4 showed weak signal (~4pp), GPT-4o showed none. The strongest effects came from models most practitioners wouldn’t pick as evaluators.
Second, raw frame effect numbers are almost meaningless without baselines. A model showing 60% frame effect and 56% noise floor looks dramatic until you realise it has 4pp of real signal. A model showing 82% frame effect with 39% noise has 43pp of real signal but looks less impressive in raw numbers.
Where does the noise come from?
I wanted to understand what “noise” actually is, so I added a third measurement: running evaluations at t=0 twice and checking for divergence. This decomposes the noise floor into two components:
- Inherent instability (t=0 divergence): The model gives different answers even with greedy decoding, likely from floating-point non-determinism, batching effects, or MoE routing
- Sampling variance (t=0.3 minus t=0): The additional divergence introduced by temperature
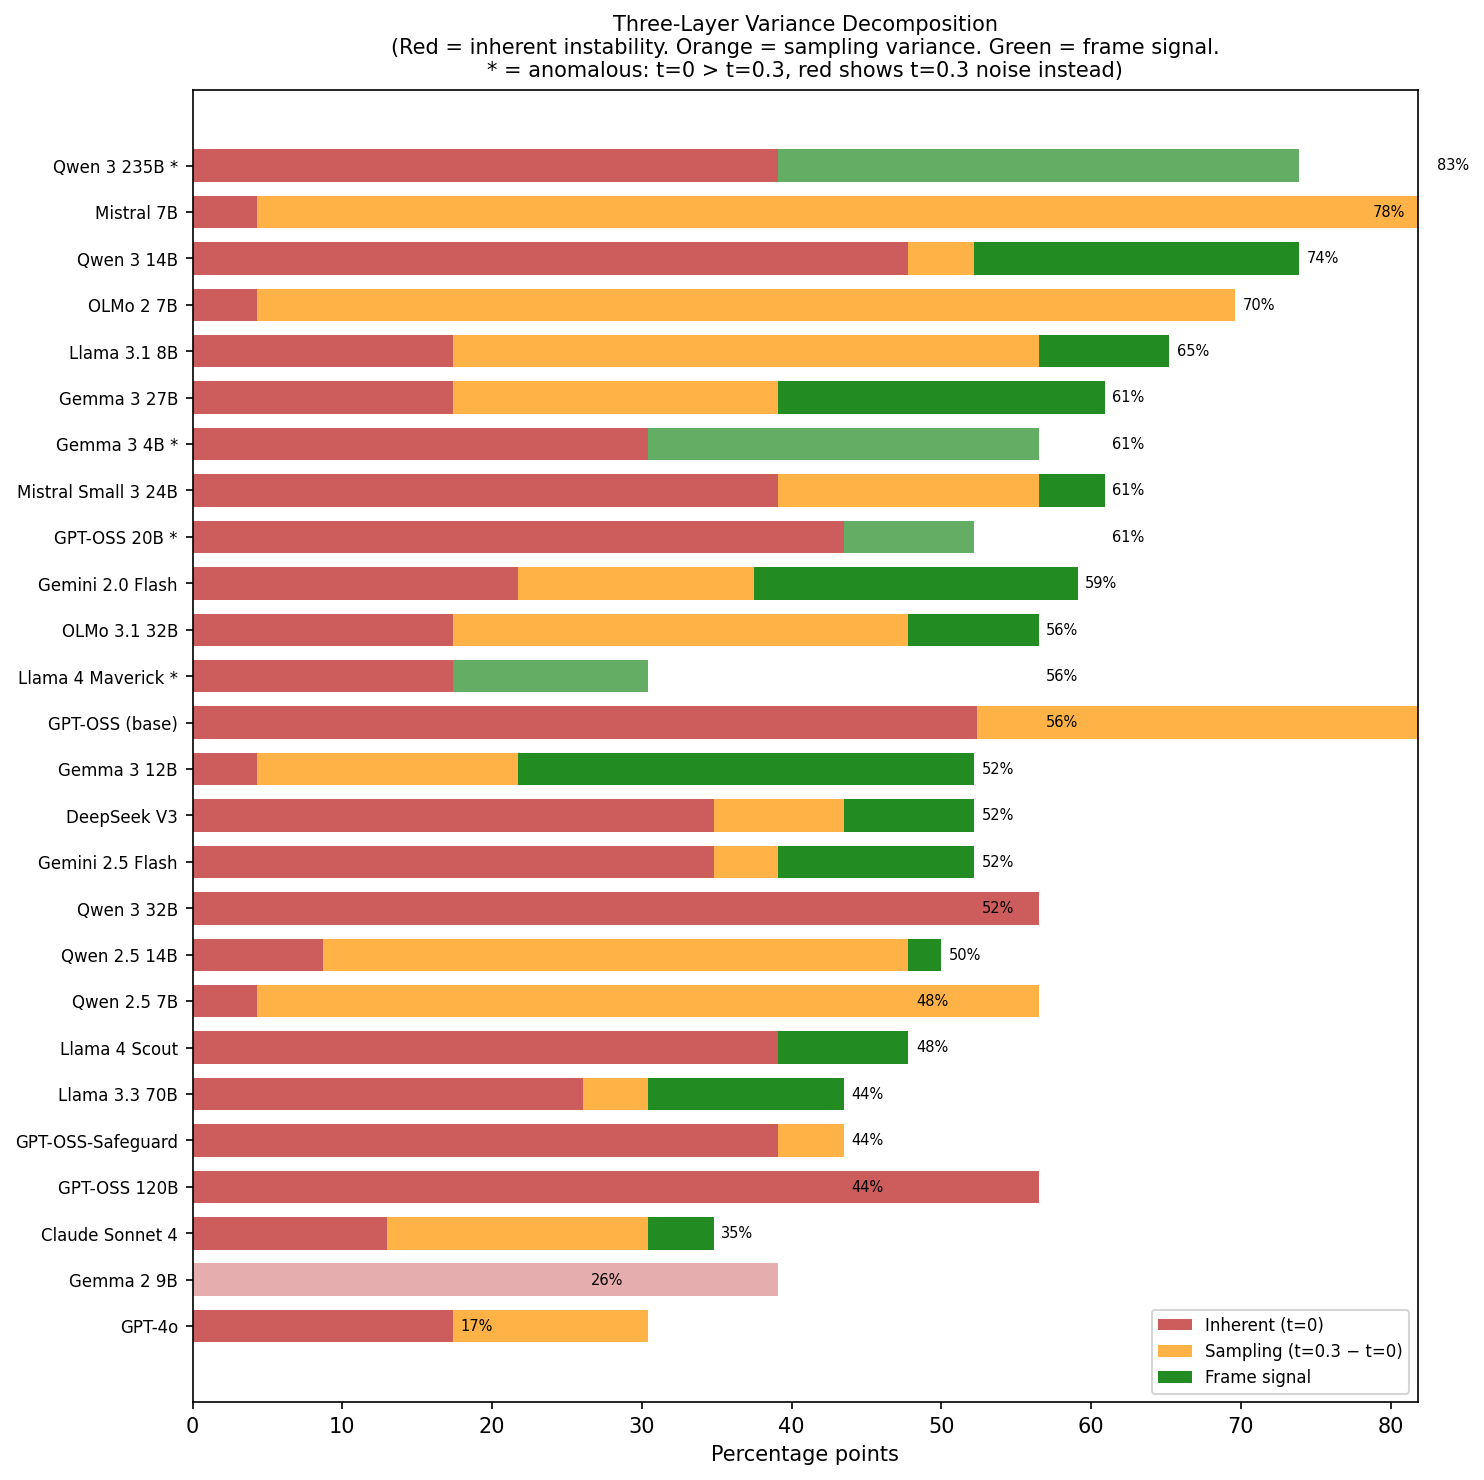 Red = inherent
instability. Orange = sampling variance. Green = frame signal. Hatched =
anomalous cases where t=0 > t=0.3.
Red = inherent
instability. Orange = sampling variance. Green = frame signal. Hatched =
anomalous cases where t=0 > t=0.3.
This decomposition revealed distinct model archetypes:
Near-deterministic but sampling-sensitive: Gemma 3 12B, Mistral 7B, and Qwen 2.5 7B all have ~4% divergence at t=0, but diverge wildly at t=0.3 (22-82%). They’re stable models that become chaotic with even modest temperature. Mistral 7B goes from 4% to 82%, and its entire 78% “frame effect” is just sampling noise.
Inherently unstable: GPT-OSS 120B and Qwen 3 32B show 56.5% divergence at both t=0 and t=0.3. Temperature adds nothing because they’re already maximally unstable at greedy decoding. Neither shows real frame signal, both fall below noise.
Genuine frame sensitivity: Gemma 3 12B is the cleanest example: 4.3% at t=0, 21.7% at t=0.3, but 52.2% frame effect. The frame adds 30.5pp beyond all noise sources.
Anomalies: Four models (Llama 4 Maverick, Qwen 3 235B, GPT-OSS 20B, Gemma 3 4B) showed higher divergence at t=0 than at t=0.3, which shouldn’t happen with standard sampling. For the two MoE models (Maverick and Qwen 3 235B), this might reflect non-deterministic expert routing. I don’t have an explanation for this and would be interested to hear if others have seen similar patterns.
When classification changes, does the language change too?
For the original three models and the broader set, I tracked whether classification changes co-occurred with shifts in safety-related vocabulary (counting safety-specific terms in the model’s output).
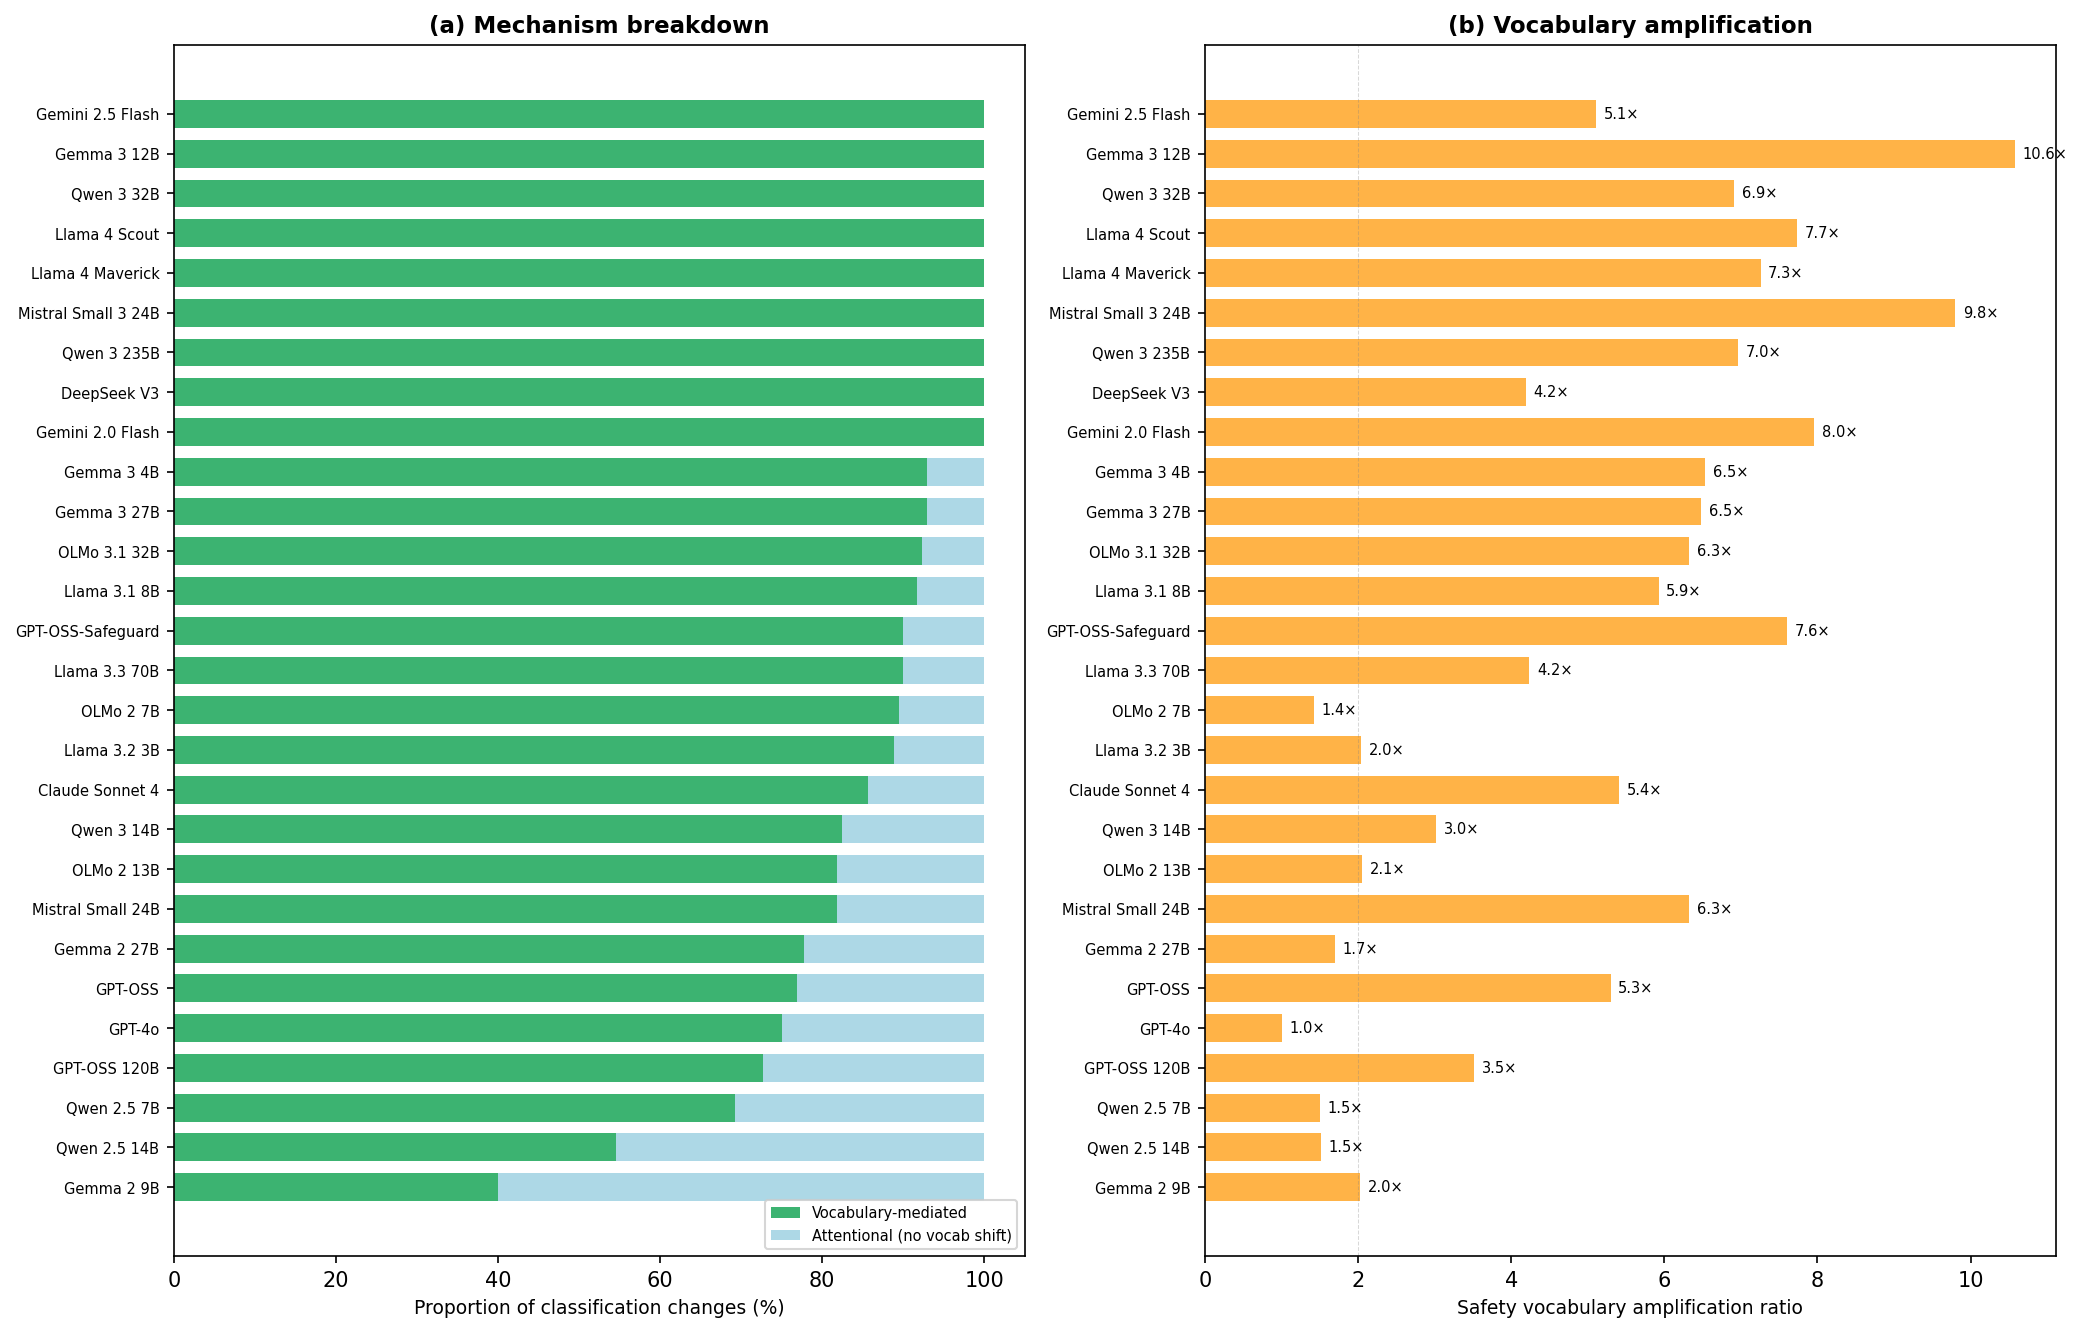 (a) Proportion of
classification changes that co-occur with vocabulary shifts
vs. “attentional” changes (classification changes without vocabulary
change). (b) Average safety vocabulary amplification ratio. Lexical
analysis was run on all models with frame effect data, including pilot
models not shown in Figures 1-3.
(a) Proportion of
classification changes that co-occur with vocabulary shifts
vs. “attentional” changes (classification changes without vocabulary
change). (b) Average safety vocabulary amplification ratio. Lexical
analysis was run on all models with frame effect data, including pilot
models not shown in Figures 1-3.
Models with genuine frame effects (top of chart) show near-100% vocabulary-mediated patterns. When the safety frame changes a classification, it does so by flooding the output with safety-related vocabulary. Gemma 3 12B shows a 10.6x vocabulary amplification ratio, meaning the safety-framed output contains roughly 10 times more safety-specific terms than the neutral output for the same trace.
What does this look like in practice? Across all 25 models, the word “safety” appeared once in the combined neutral-frame output and 1,507 times under the safety researcher frame. Nine words never appeared at all under neutral framing but materialised under safety framing: adversarial, vulnerability, dangerous, attack, harm, exploit, mitigation, ethics, danger. These are ghost vocabulary: they don’t exist in the model’s analysis until you tell it what kind of researcher it is.
Different model families leave distinctive vocabulary fingerprints: Mistral models consistently reach for “security” over “safety”, the Gemma 2 family prefers the hedge word “potential” even under safety framing, and “adversarial” is almost exclusively a Gemma 2 9B word. The instrument doesn’t just shape the measurement, it signs it.
The displacement is as telling as the amplification. The word “review” decreases from 299 to 238 occurrences, and “possibly” drops by more than half. The models don’t add safety thinking on top of their analysis. They replace analytical vocabulary with safety vocabulary. Five words from the safety lexicon were never used by any model in either frame: threat, caution, guardrail, regulation, governance. “Guardrail” appears to be a word safety researchers use about models, not one models use about failures.
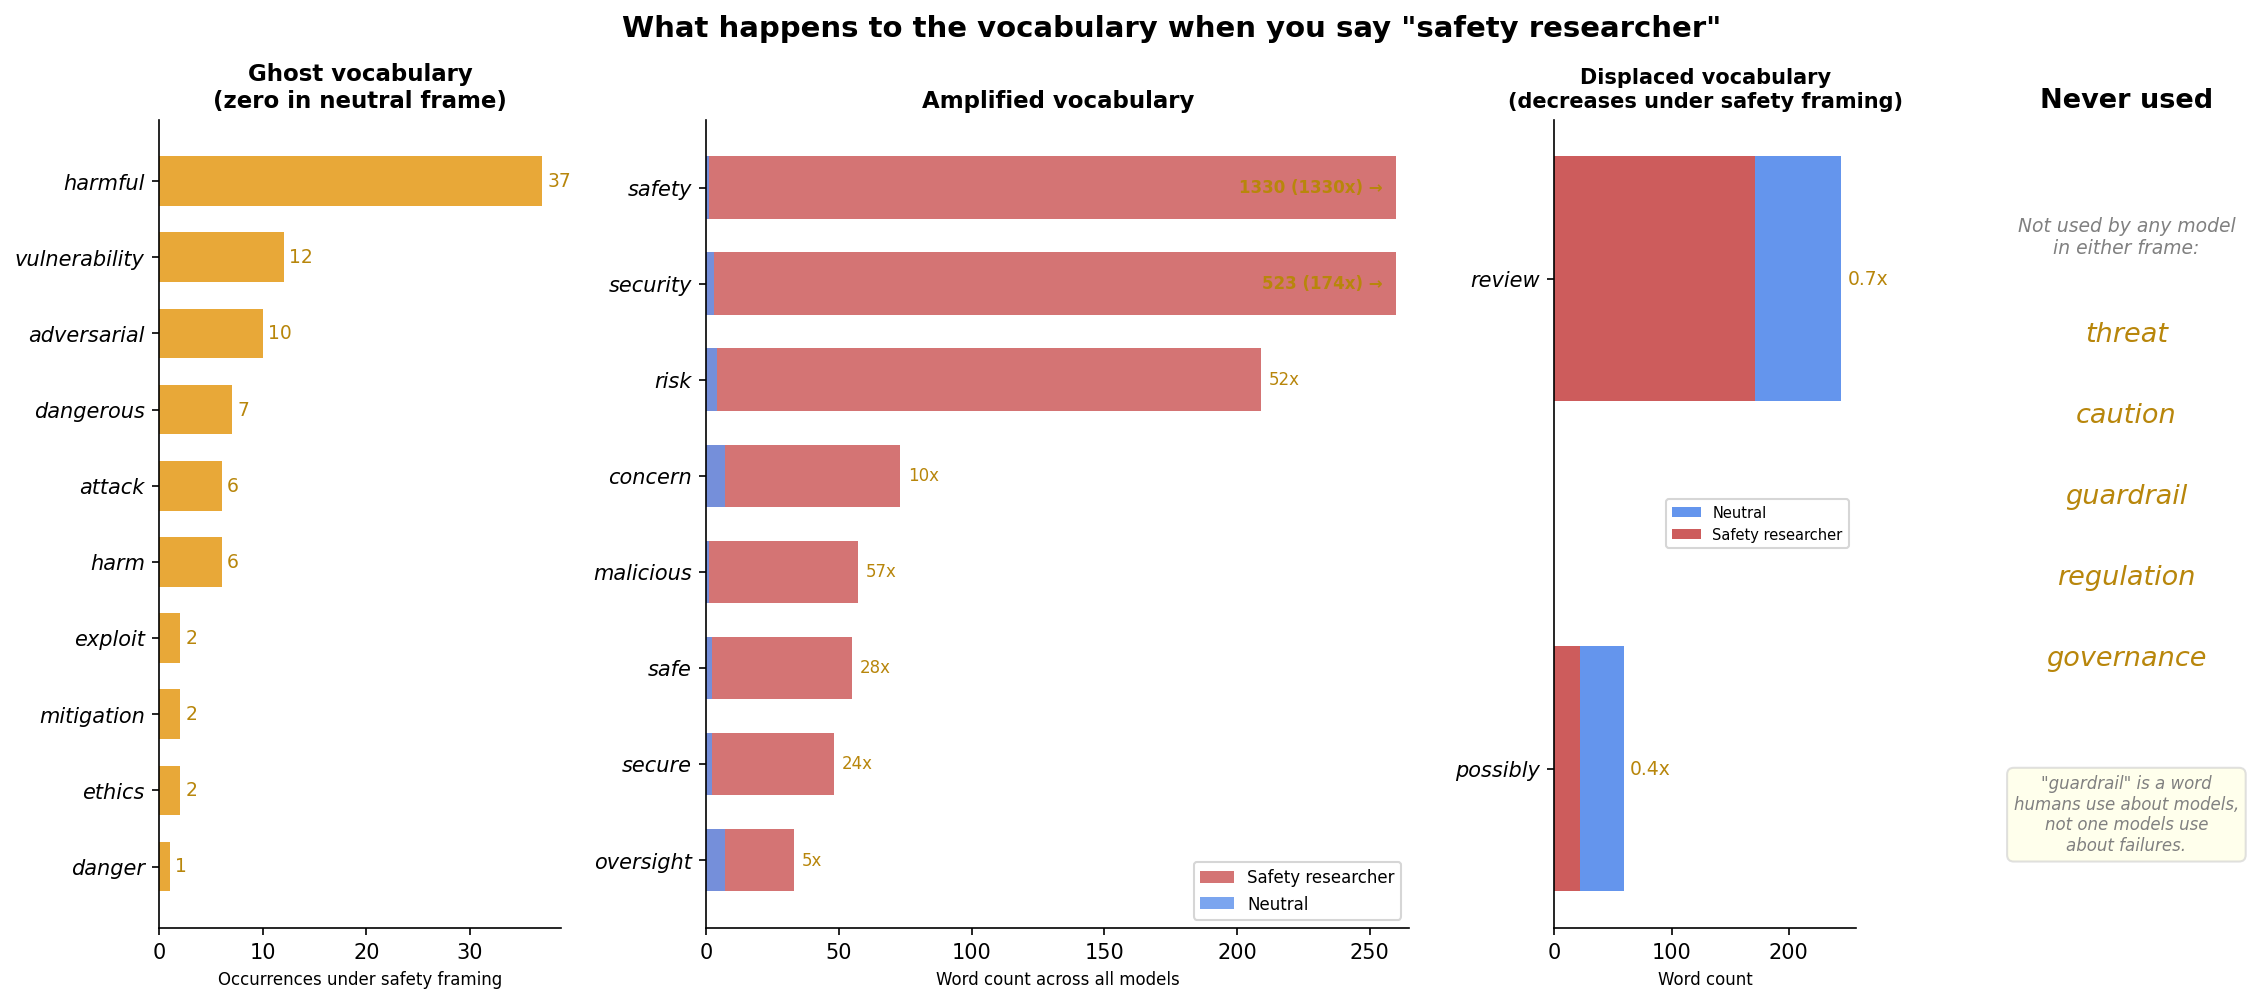 Left: word counts
under neutral (blue) vs. safety researcher (red) framing across all 25
models. Ghost vocabulary (orange) has zero baseline occurrences. Right:
words that appear only under safety framing and words never used in
either frame.
Left: word counts
under neutral (blue) vs. safety researcher (red) framing across all 25
models. Ghost vocabulary (orange) has zero baseline occurrences. Right:
words that appear only under safety framing and words never used in
either frame.
Models at the bottom (Qwen 2.5 14B and Mistral 7B) show high proportions of “attentional” classification changes (no vocabulary shift). But these models have no real frame signal after baseline correction. The “attentional mechanism” appears to be what noise looks like when you decompose it: random classification changes naturally won’t correlate with vocabulary changes, because they’re random.
This was a significant update for me. In the three-model pilot, GPT-4o’s attentional pattern looked like a genuinely different mechanism. At scale, with baselines, it looks like an artefact.
What this connects to
Zheng et al. (2023) documented position bias, verbosity bias, and self-enhancement bias in LLM-as-a-judge setups. This work adds frame sensitivity and noise baselines to that picture.
More directly relevant: while writing this up, I found concurrent work by Lim, Kim & Whang (2026), DeFrame: Debiasing Large Language Models Against Framing Effects, which examines framing effects on LLM fairness evaluations. They test role assignment (“-ROLE”: assigning the model the role of an unbiased person) as one of several debiasing strategies and find it doesn’t robustly reduce bias. Worse, it can increase framing disparity, making the model’s evaluations less consistent across alternative wordings.
Their finding and mine arrive at the same conclusion from different directions. They show role assignment fails to fix bias in social fairness evaluations. I show role assignment fails to improve failure detection in safety evaluations. In both cases, the role changes surface behaviour without changing the underlying judgement.
What my work may add is a different kind of baseline. There are two things you can mean by “baseline” in this context. A method baseline asks: does my intervention beat doing nothing? DeFrame uses these, comparing debiasing strategies against unmodified prompts. A noise baseline asks: how much does the output vary when I change nothing at all, just the same prompt run twice? That’s what I measure. I haven’t found evidence that DeFrame separates framing disparity from stochastic variation, though I may have missed it in their methodology. Without that second kind of baseline, you can’t tell whether an observed effect is signal or stochastic variation. In my data, 9 of 25 models showed frame effects that were entirely noise.
The terminology matters here: “role assignment” is the prompt engineering technique (telling the model “you are a safety researcher”). “Frame effect” is the measured outcome (the resulting shift in classification). The role is the intervention and the frame effect is what you measure. DeFrame’s work and mine both suggest the intervention doesn’t produce the effect practitioners expect.
What I think this means
For anyone running LLM-as-a-judge evaluations: If you’re not measuring your noise floor, you don’t know how much of what your evaluation pipeline reports is signal versus stochastic variation. The procedure is simple: run the same evaluation twice under identical conditions. If your effect doesn’t exceed that baseline, you may not be measuring what you think you’re measuring. In this study, 9 of 25 models would have been false positives without this step.
For AI safety evaluation: The “safety researcher” frame doesn’t reliably increase detection of multi-agent coordination failures, the one failure type I tested intensively. In the models where it does have an effect, it operates by flooding the output with safety vocabulary, which changes classifications but doesn’t obviously improve the quality of the underlying analysis. Whether the frame changes what the model attends to, or only what vocabulary it reaches for, is something I can’t distinguish from these measurements.
For cross-model comparison: Model rankings are unstable without baselines. A model with a high raw frame effect might just be noisy. A model with a low raw effect might be genuinely stable. The naive ranking and the baseline-corrected ranking can be completely different, and in my data, they were.
As a broader observation: These results are consistent with the idea that AI failure classification is partly observer-dependent. What an evaluator reports depends on how it’s framed, which model you use, what temperature you set, and how much of the output is stochastic variation. I can’t establish that claim from this experiment alone, but the pattern is suggestive: across 25 models, the instrument consistently shapes the measurement. If that holds up under replication, it has implications for how I think about standardised evaluation.
This is what my failure logs were hinting at. The same failure,
logged in a development context and a policy context, got different
descriptions and different categories, not because the failure was
different, but because the observer was in a different mode. When I
moved from my own logs to controlled experiments with LLM evaluators, a
similar pattern appeared at scale: the frame shapes the classification.
The detected_by field I built to track who catches failures
may tell us as much about the observation as about the failure itself.
If we want reliable behavioural assessment of AI systems, we probably
need to understand and measure the instrument, not just the subject.
Limitations
These are real and I want to be explicit about them:
- n=23 traces. This is small. With 23 traces, only Qwen 3 235B would survive a formal significance test. The pattern across 25 models matters more than any single model’s numbers. The precise effect sizes will shift with more data. I plan to expand to ~40 traces for models with the strongest signal (which a power analysis suggests is enough to confirm 30pp+ effects) and to a larger subset of the MAST dataset more broadly.
- Single taxonomy. All traces are multi-agent coordination failures from MAST. Frame effects might behave differently for tool misuse, jailbreak attempts, or other failure types. I also plan to test with ToolEmu traces next.
- Binary frame comparison. I tested neutral vs. safety researcher. There are many possible frames and I tested one intensively. The effect size and mechanism might differ for other frames.
- Model range. I tested mid-range commercial models (Claude Sonnet 4, GPT-4o), not the top of each provider’s lineup (Opus 4.6, GPT-5.2, Gemini 3 Pro). Models at the actual capability frontier may behave differently.
- Provider variation. Some models were tested via different providers (DeepInfra, Ollama, Together). Provider infrastructure might contribute to the t=0 anomalies. The Llama 4 Scout cross-provider comparison (DeepInfra: 39.1% noise, Together: 34.8%) suggests this is a real but modest factor.
- Mechanism claims are correlational. “Vocabulary-mediated” means classification changes co-occur with vocabulary shifts. I can’t confirm the causal direction: the vocabulary shift might cause the classification change, or both might be effects of a shared upstream process.
- Claude Sonnet 4 instability. Claude’s frame effect varied across runs: 40% on the initial 20-trace set, 35% and 48% on two matched 23-trace re-runs. The 13pp spread between identical setups is consistent with the noise floor and illustrates why I don’t put much weight on any single model’s number.
What I’d like to know
I’m not sure how much of this is already well-established in literatures I haven’t found. DeFrame (cited above) addresses some of the framing questions, but from a different angle and domain. If you know of prior work specifically measuring noise baselines for LLM-as-a-judge evaluations, or work that separates framing effects from stochastic variation, I’d appreciate pointers.
Specific things I’m uncertain about:
- Is the t=0 anomaly (higher divergence at greedy than at t=0.3) a known property of MoE models, or something others have encountered?
- Are there established methods for computing confidence intervals on frame effects with this kind of nested design (traces x frames x runs)?
- DeFrame compares frame sensitivity across models for fairness evaluations. Has anyone done something similar for safety or failure evaluations specifically?
- Within the GPT-OSS family, only the 20B variant shows genuine frame signal (+17pp, moderate), while the base model (-25pp), 120B (-13pp), and safety-tuned Safeguard (0pp) all fall at or below noise. The base model is extremely noisy (82% noise floor), so its 57% raw frame effect is meaningless. The Safeguard variant’s 44% raw effect exactly matches its noise floor. Why does the 20B show real signal when neither the smaller base, the larger 120B, nor the safety-tuned variant do?
The data and experiment configurations are available at lab.fukami.eu/data/LLMAAJ. If you want to replicate or extend this, I’d welcome it.
References
Zheng, L., Chiang, W.-L., Sheng, Y., et al. (2023). Judging LLM-as-a-Judge with MT-Bench and Chatbot Arena. arXiv:2306.05685.
Lim, K., Kim, S., & Whang, S. E. (2026). DeFrame: Debiasing Large Language Models Against Framing Effects. arXiv:2602.04306.
Part of a series on LLM-as-a-Judge. Part 2: “Under a safety frame: Exploring classification shifts in LLM-as-a-Judge evaluation”.
This work grew out of instrumenting AI coding agents in my day job at CrabNebula and MVC. If you have pointers to related work or want to discuss, find me on Mastodon.