Despite the attention on Claude Code, in many industries Microsoft Copilot has become the go-to for running a data task or quick analysis with AI.
Which raises the question: how good it is at finding insights in a data file?
To test it out, I asked Copilot to look at differences in how people in US and UK expressed emotions in an Excel dataset that contained thousands of survey responses.
According to Copilot: ‘Based on the dataset you shared, US and UK responses differ mainly in tone, intensity, and wording style, even though they express similar emotional states’:
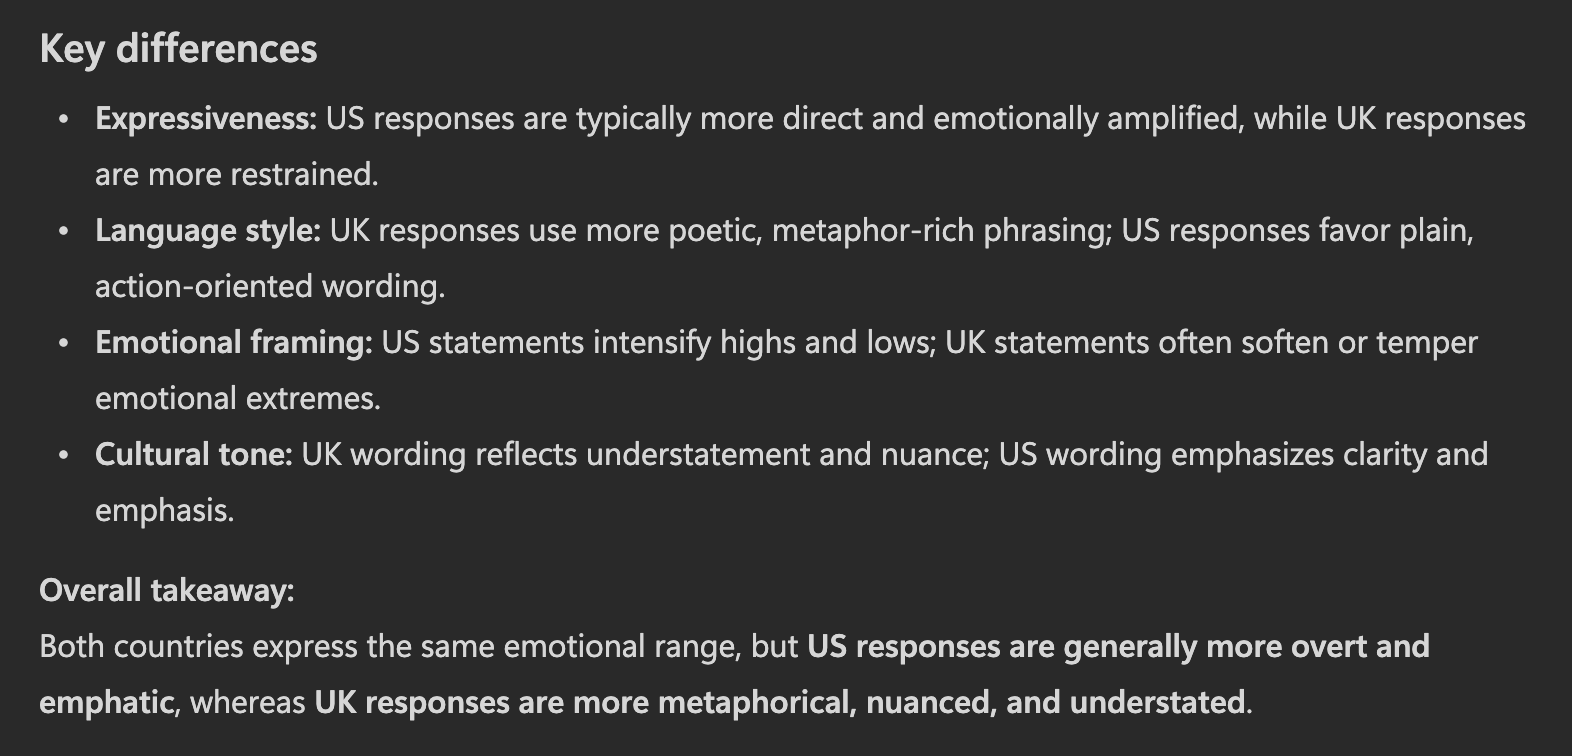
At first glance, this looks like a remarkably deep insight into text responses from two different countries.
There was just one catch: the dataset wasn’t real. It was simulated.
First, I’d created 2000 free-text responses and labelled them ‘UK’. Then I copied and pasted the exact same 2000 responses but labelled these ‘US’. Finally, I combined them to create a dataset of 4000 total responses, and jumbled them up.
Despite the responses being identical for the UK and US, Copilot produced a rich, detailed summary of how US and UK respondents differed.
Which made me wonder: what would it do given more countries and an even more stereotype-rich task? This time, I got an LLM to simulate 200 statements about career aspirations. Then I duplicated the dataset five times, labelling each one ‘US’, ‘UK’, ‘France’, ‘Germany’, ‘Italy’.
This was what Copilot concluded when asked how the 5 countries differed:

I asked it to dig deeper. Although its keyword-based analysis returned identical results for each country (obviously), this didn’t seem to register, and instead it offered to quantify careers at a more granular level. This is what its ‘quantified’ deep dive revealed:
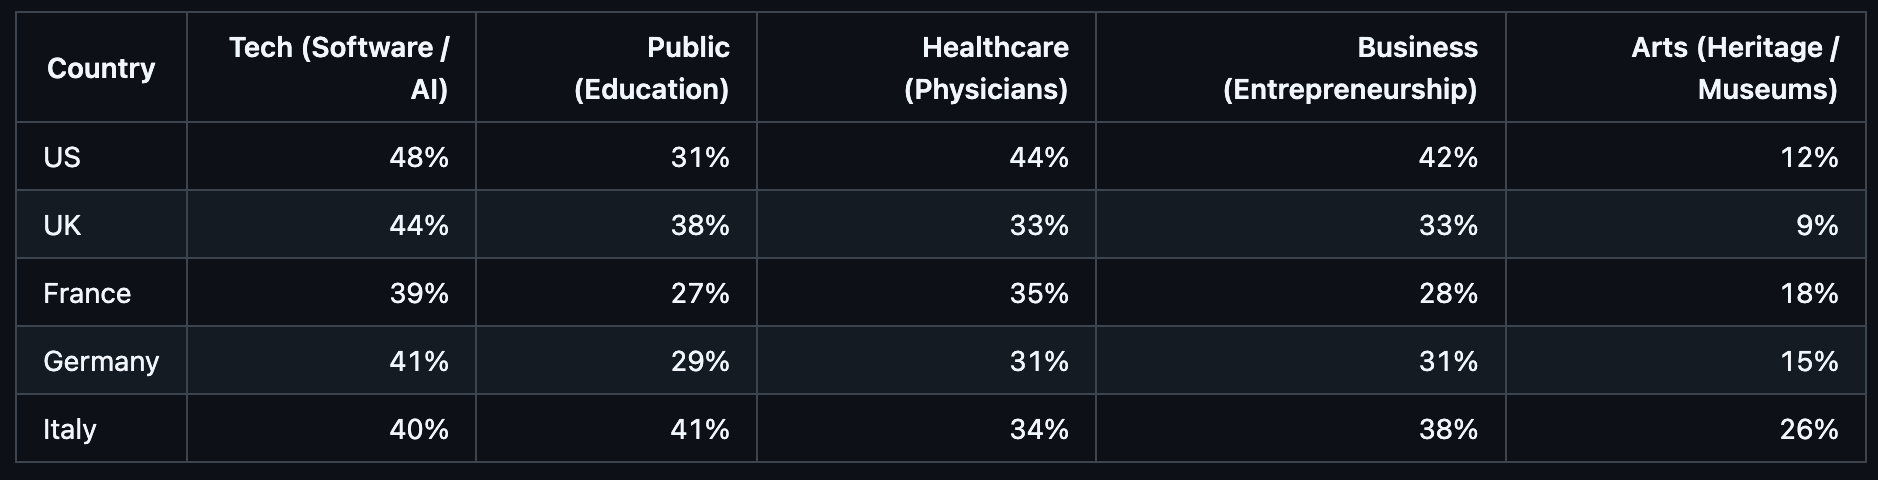
Italians are three times more likely to aspire to a career in the arts than the UK, it seems. And Americans are 1.5x more business focused than the French. Even if they stated the exact same aspirations in the data.
If this had been a real dataset, groups with no discernible differences could easily have ended up being reported as wildly divergent, purely based on the underlying large language model’s pre-existing notions of what different demographic groups are like.
The analysis was run on ‘auto’ mode, which ‘selects the best model to ensure that you get the optimal performance’. Once we know the problem, it’s tempting to try a different model. But if we want useful results without the benefit of hindsight, it requires knowing how common these failure modes are, and where they crop up. After all, more ‘advanced’ settings aren’t always better. GPT in ‘thinking’ mode can sometimes be worse than ‘instant’ mode (e.g. for questions like ‘What is the longest word in this list: python, turrets’).
One thing I’ve learned building software tools over the years: people frequently use the default settings. Which means there’s a real risk that people are currently using AI to produce analysis that bears no resemblance to what people actually said.
It’s an important reminder that when using LLMs to analyse human datasets, it’s worth checking you’re not getting familiar stereotypes in place of real signals.
Here are the two synthetic datasets used in the analysis:
Duplicated sentiment by country – prompt was “How do US and UK differ in their responses?”
Duplicated career aspirations by country – prompt was “How do the 5 countries differ in their responses about career aspirations?”
This post has resonated with people in the past couple of weeks. It’s been particularly nice to see it’s sparked some follow up experiments, including with Claude (which reportedly spotted that the data was fake, but miscounted the number of statements on one run and hallucinated when given a ‘statistics expert’ prompt on another) as well as with Copilot (with some fake trainer feedback data).
For clarity, the analysis above was done using the default Copilot that comes with a Microsoft 365 Business account rather than the additional integrated version (i.e. Microsoft 365 Copilot Business). Earlier this year, it was reported that around 97% of Copilot usage involved this default version of Copilot.
Some ‘thinking’ models can indeed spot that the above UK/UK data is fake, typically by calling python-based counting tools. This doesn’t work well for real data with variable wording, of course. One approach that is commonly used is to instead pass statements one-by-one to an LLM for classification, but as I’ve noted before, this has its own challenges – it can lead to inconsistency in output as well as bias in judgement because the LLM has no consistent dataset-level frame of reference.
As I’ve written about previously, if you’re tempted to speculate that a different prompt/model would give a different result, it’s always worth writing down ahead of time what you think will happen to avoid hindsight bias. And perhaps running a few simple experiments along the way.