The magic ingredient here is this weird little tool for planning Lean projects called Lean Blueprints.
Blueprints are a mechanism mathematicians have designed for planning out formalisations of their results. When translating a pen and paper result into a proof assistant, a mathematician must first encode all the necessary definitions, helper lemmas and so on before they can write the proof. The blueprint serves as a mechanism to keep track of this process.
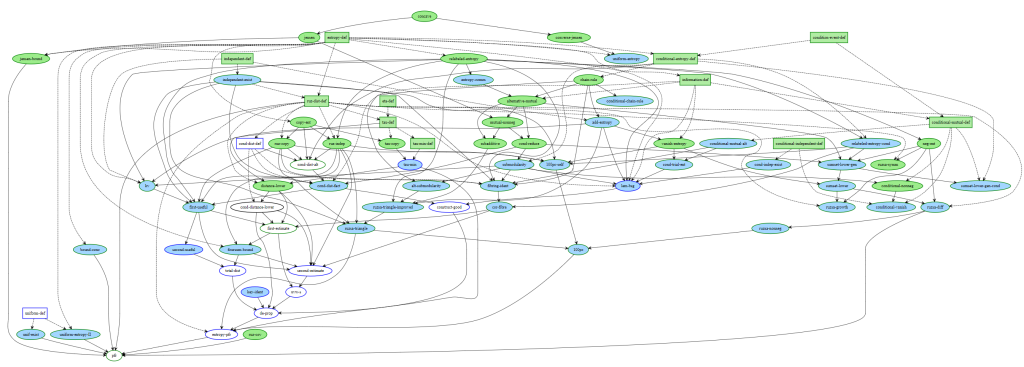
The above image shows an example blueprint, taken from Terence Tao's blog post on the PFR formalistion. It's a graph where the nodes represent different definitions, lemmas and theorems in the formalisation. The colour indicates the status of the formalisation. Green means that it is proven; light blue means that they can be stated but have not been proven, and the remaining nodes (black here) are those that can not even be written down yet (they might be require some definitions to be written down first).
The reason this is exciting is because for the first time we have features for proof assistants that have been developed by mathematicians for mathematicians, rather than by computer scientists, as was the case before in proof assistants such as Rocq. Furthermore, as these formalisations are done in version control, we actually have unique access to see how the blueprint itself changed over time as the project was formalised.
For example, if we keep track of a single node, we can see how it goes from not even being ready to be stated (yellow), stated (blue) and proven (green):
If we look at the state of the graph around these nodes, we have access to a huge amount of data providing unique insights into how mathematicians go about actually proving stuff and build new tools, techniques, maybe train a few ML models, to help mathematicians prove things.
To get the ball rolling, I've been playing around with extracting this data from the version control of active Lean formalisations and trying to plot it out.
Below is a visualisation of the evolution of the Lean Blueprint for Terence Tao's formalisation of the Polynomial Freiman Ruzsa conjecture: (Github URL: https://github.com/teorth/pfr)
If you play the animation, (it's quite calming), you can see how the blueprint graph is built up by the mathematicians over time. We can pause the animation whenever we see something interesting and take a look at what happened. If you watch for a while you'll see that very often the the graph grows in bursts of yellow bubbles, where presumably some mathematician has sat down and sketched out another part of the proof and broken it down into fragments for others to formalise. Then as the formalisation progresses, these nodes are gradually verified and go from blue to finally green.
Obviously, this is not a particularly deep observation, and was just the result of watching the graph for a bit, but I do think this data is really rich with a lot of previously hidden insights into how these proofs are done.
The code to generate this data, for which this blog post is partially an advertisement for, is available on my Github: https://github.com/kiranandcode/lean4-blueprint-extractor/tree/main