In the past day or two on social media I kept seeing this graph from a Semafor story on the declining volume of international visitors to the United States.

Semafor Graph.
It seems to show, and was being remarked on as showing, that the second Trump administration has been responsible for a drop in visitors from abroad from some countries on a scale comparable to the effects of the Covid-19 pandemic. My first thought was “that can’t be true”. And indeed it is not true. I mean, the pandemic shut down air travel almost completely for a while. The current administration’s actions have been terrible in many ways and led to direct, negative consequences for tourism, too. But they haven’t been on that scale. Something’s wrong with the graph.
These numbers come from International Trade Administration’s I-94 arrivals data. They maintain a spreadsheet that counts all international visitors by country of residence who arrive in the U.S., spend at least one night here, are among qualified visa holders, including tourist visas and waivers and so forth. This is a monthly series. Right now, we only have data up to August of 2026, and for a couple of countries in the graph only up till June. I think—I am only guessing—that what the person who made this graph did was aggregate to yearly totals, plot those points, and then smooth them. (That’s why the y-axis values are so large in comparison to the ones on the monthly graphs I’m about to show you.) But the data for 2026 are only for half the year, hence the giant drop.
I went and got the data myself and took a look at it. Here’s the raw monthly series for the same countries as in the one above:
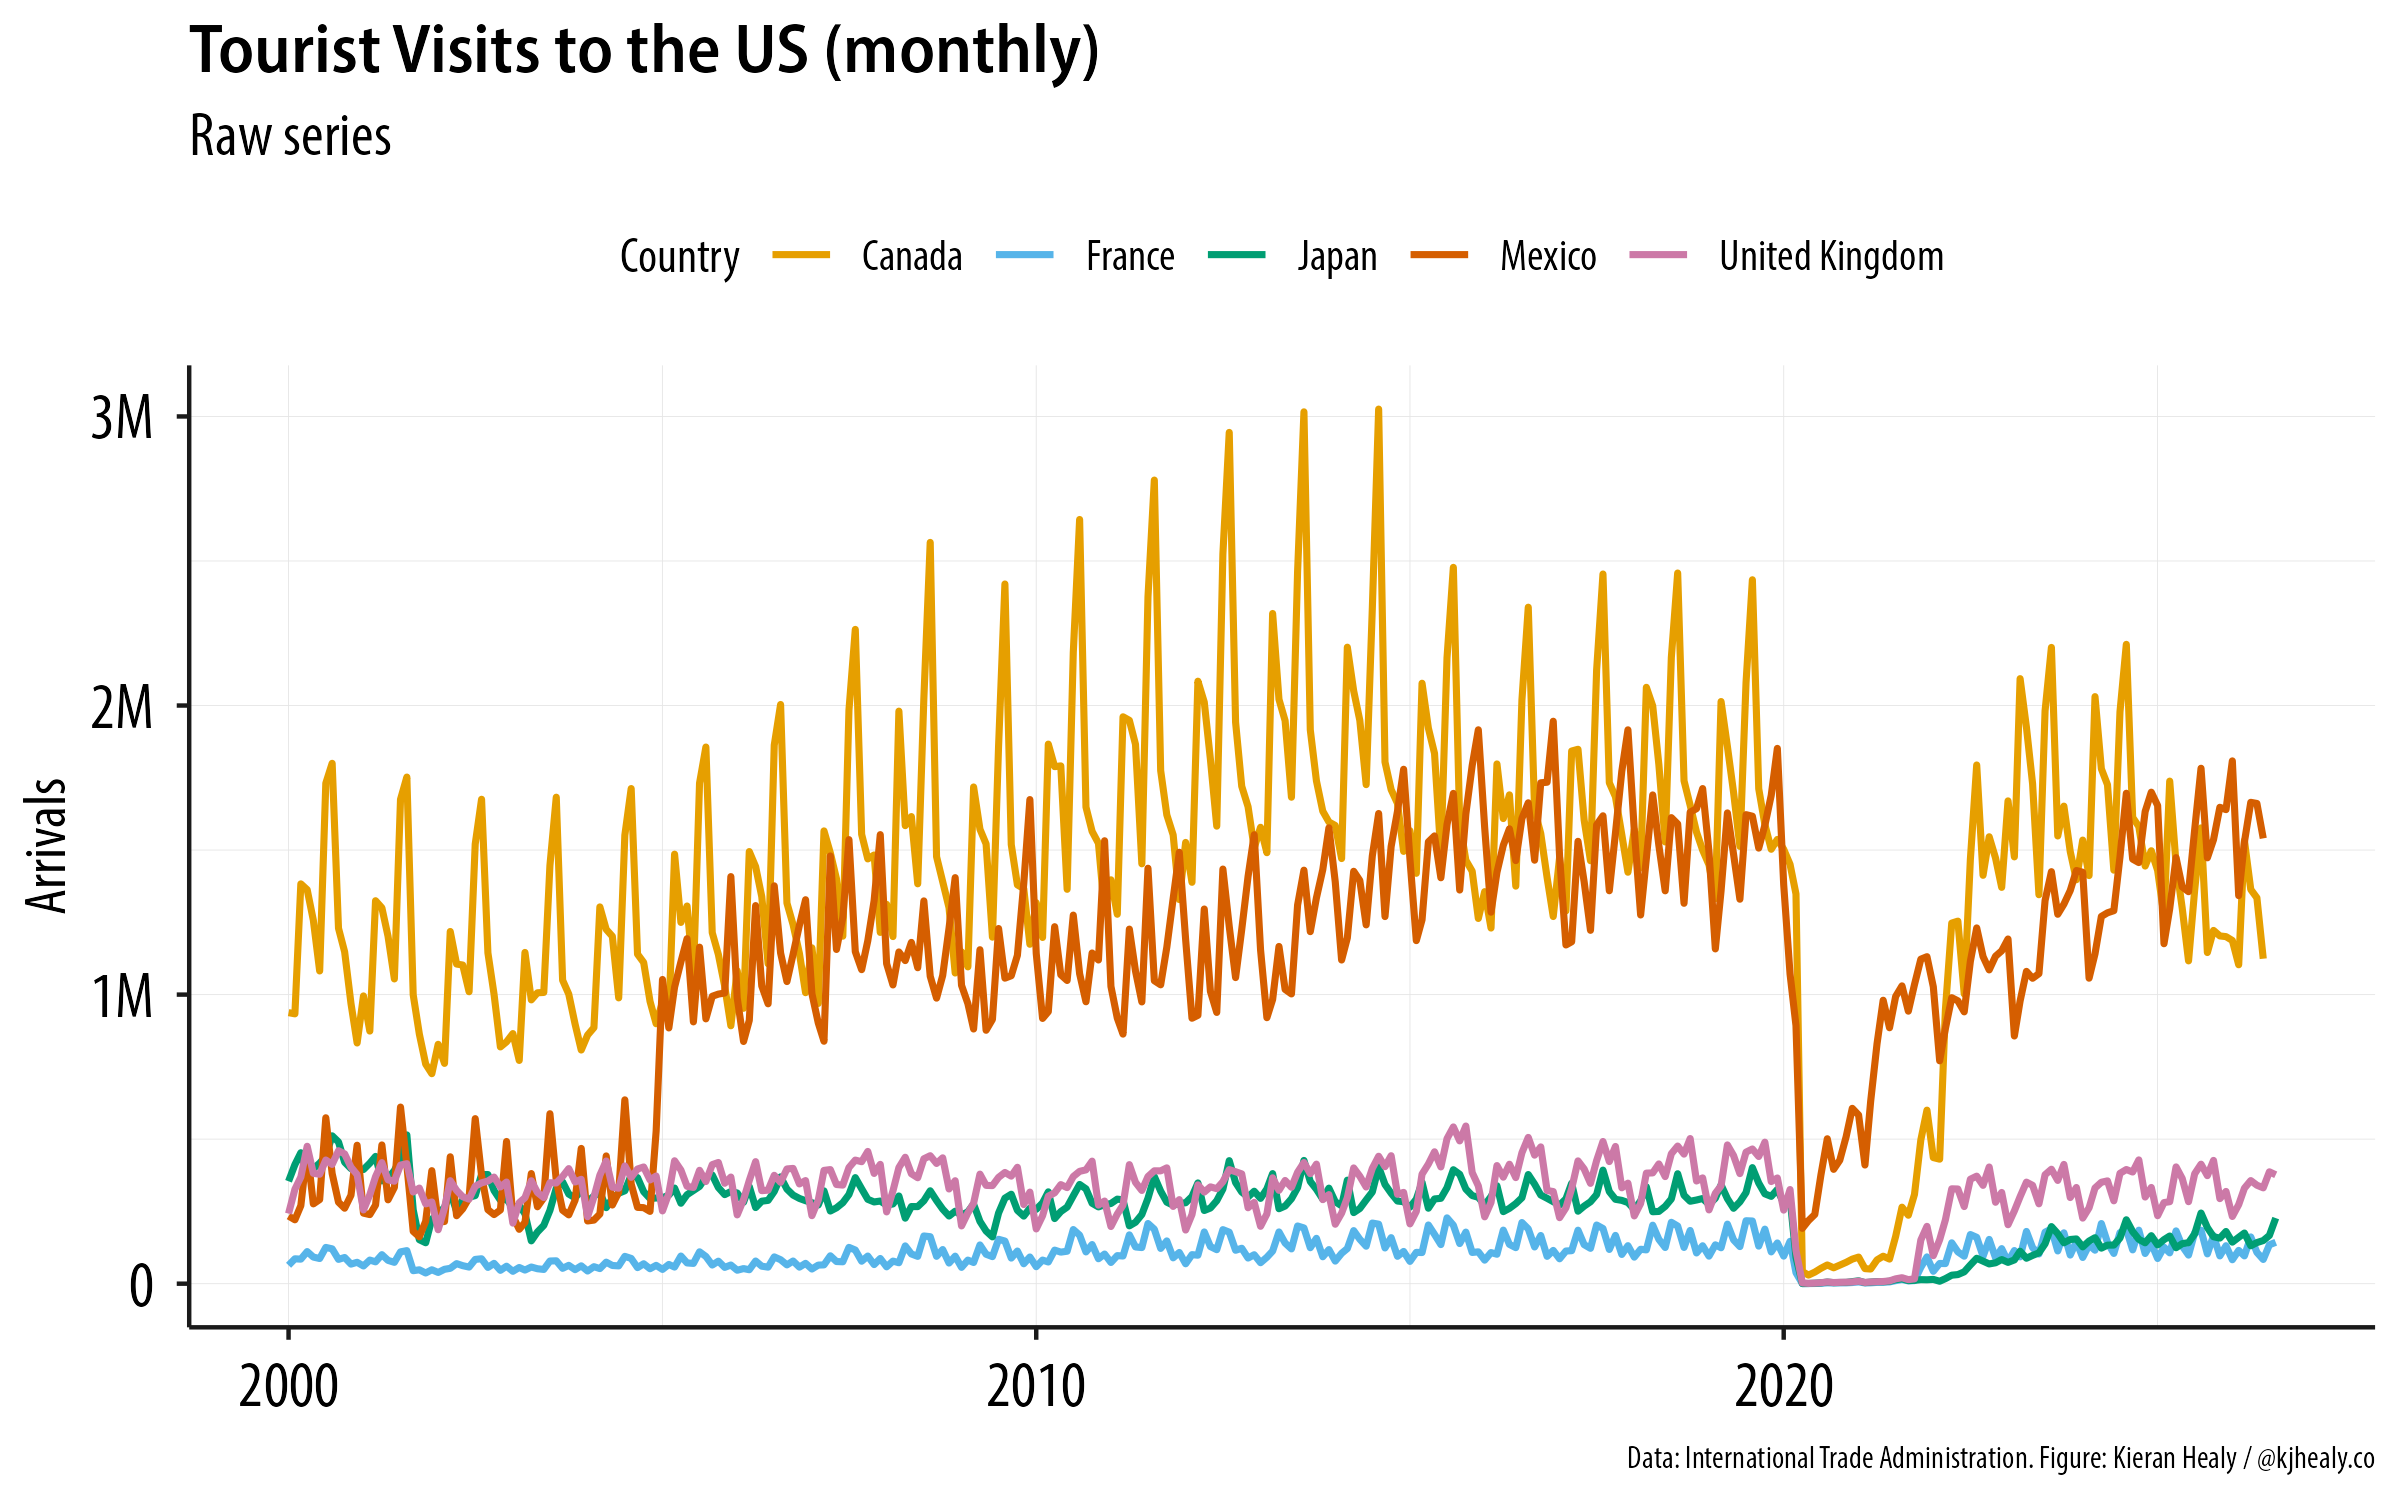
The monthly series.
It’s noisy because tourism is highly seasonal. Even so, the catastrophic effects of the pandemic are obvious, as is the fact that whatever is going on in the past year isn’t nearly as severe as that. Though something is going on. We can smooth the monthly data directly by calculating a trailing average, which is just a moving average except the window we’re moving across the data doesn’t extend beyond the current month. That way, we don’t illegitimately “look ahead” of the current month in a way that would make our moving average seem to anticipate the future. If we used an ordinary moving average it might seem like the trend was able to anticipate the Covid-19 downturn, for example. Here’s the result:
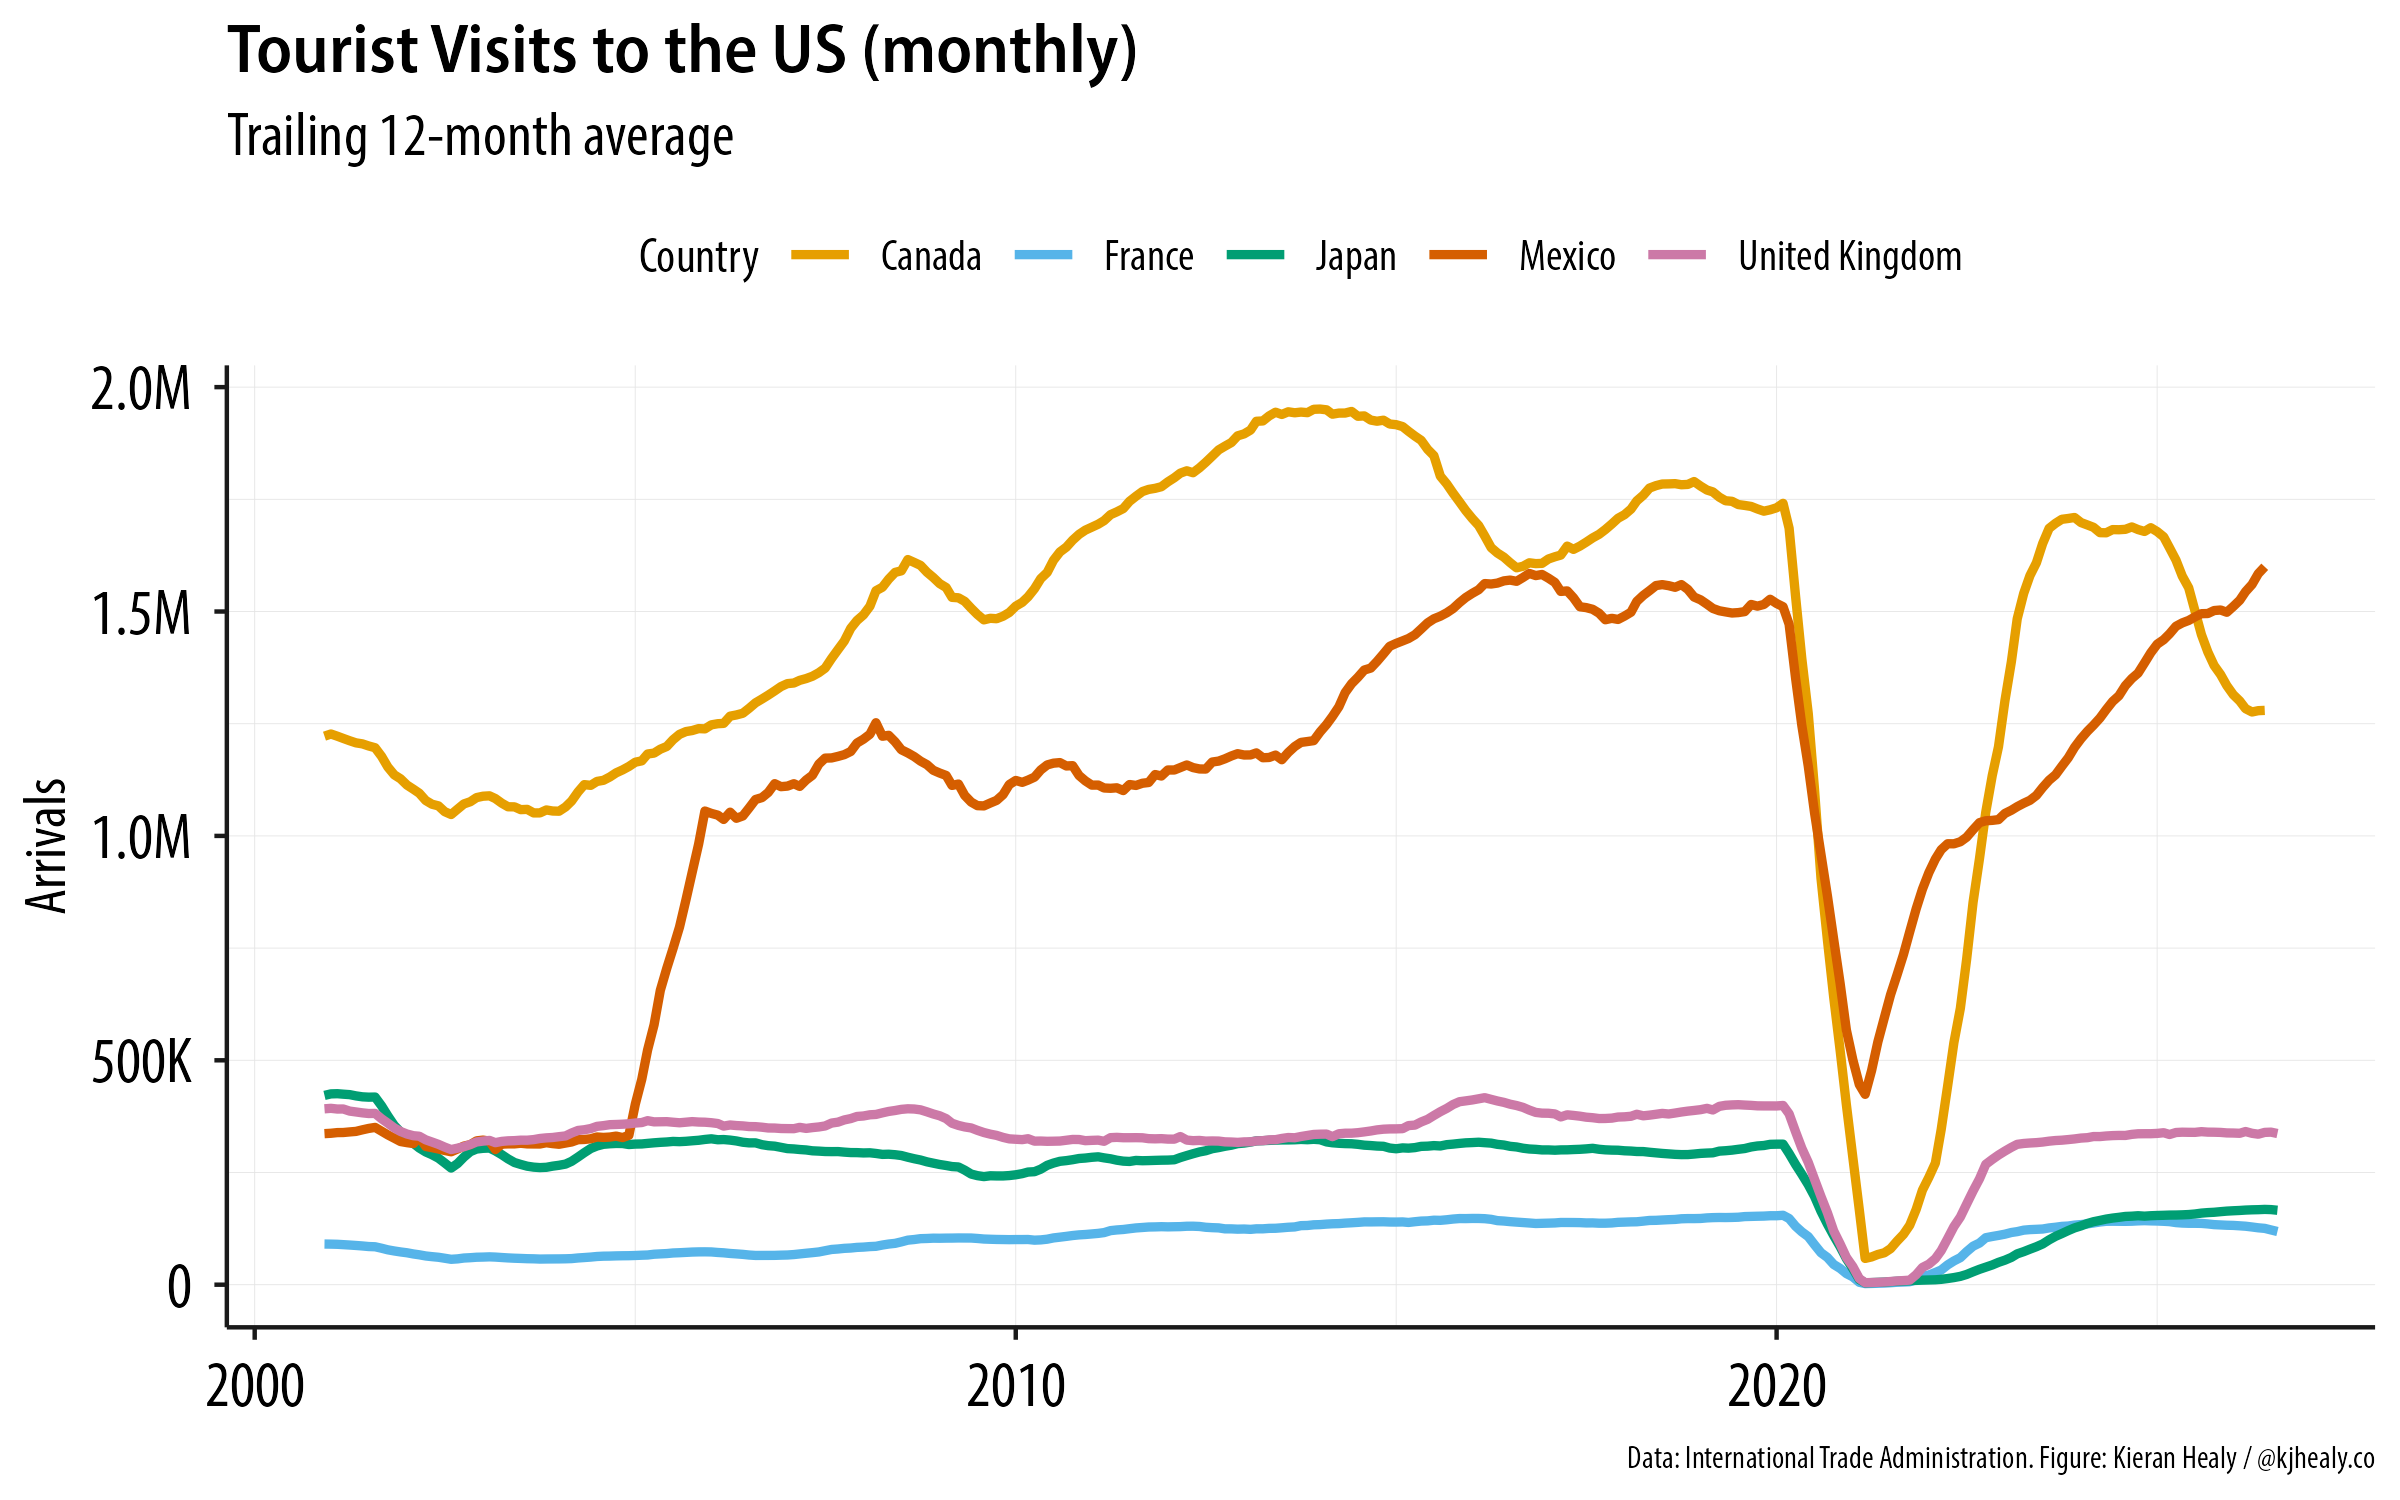
The smoothed monthly series.
So, no Covid-scale drop. But still, not nothing. The Canadian dip, following the trade war Trump started for no good reason, is very substantial. Just eyeballing it, it seems about twice as large as the downturn that followed the global financial crisis of the Great Recession, which is quite remarkable. It also looks like French tourism has declined, but I’d need to look a little more closely at that series by itself, as it’s on quite a different scale.
The general lesson, I suppose, is just that it’s always worth trying to cultivate some sort of rough comparative sense of how big or small an effect you should be expecting to see in your data, so that when something goes wrong (as things so often do) you’re more likely to be brought up short by it.
Speaking of which, you might also wonder about the remarkable leap in visitors from Mexico around 2004-2005 that’s visible in both the original graph and my version of it. What happened there? The answer is not some sudden shift in tourism preferences, but our old friend, measurement change. Prior to 2005, visitors from Mexico originating within 25 miles of the border weren’t counted as visitors. After 2005, they were. Hence the jump. In a smaller but still noticeable way, data for 2014 aren’t fully comparable either, because overseas one-night-stay visitors were included that year. There is some documentation of this on this old BTS page. If you want to measure change, you can’t change the measure.
Update: Now that I have this data and am messing around with it, here’s one more. This is monthly data averaged with a 12-month trailing window, showing all travel to the U.S., broken out by different “regions”. Canada and Mexico are large enough to each be their own region. Looking at things this way deliberately smooths away all the seasonality. The size of the Canadian reaction to the Trump administration’s attack on them really is remarkable. Elbows up, Canada.
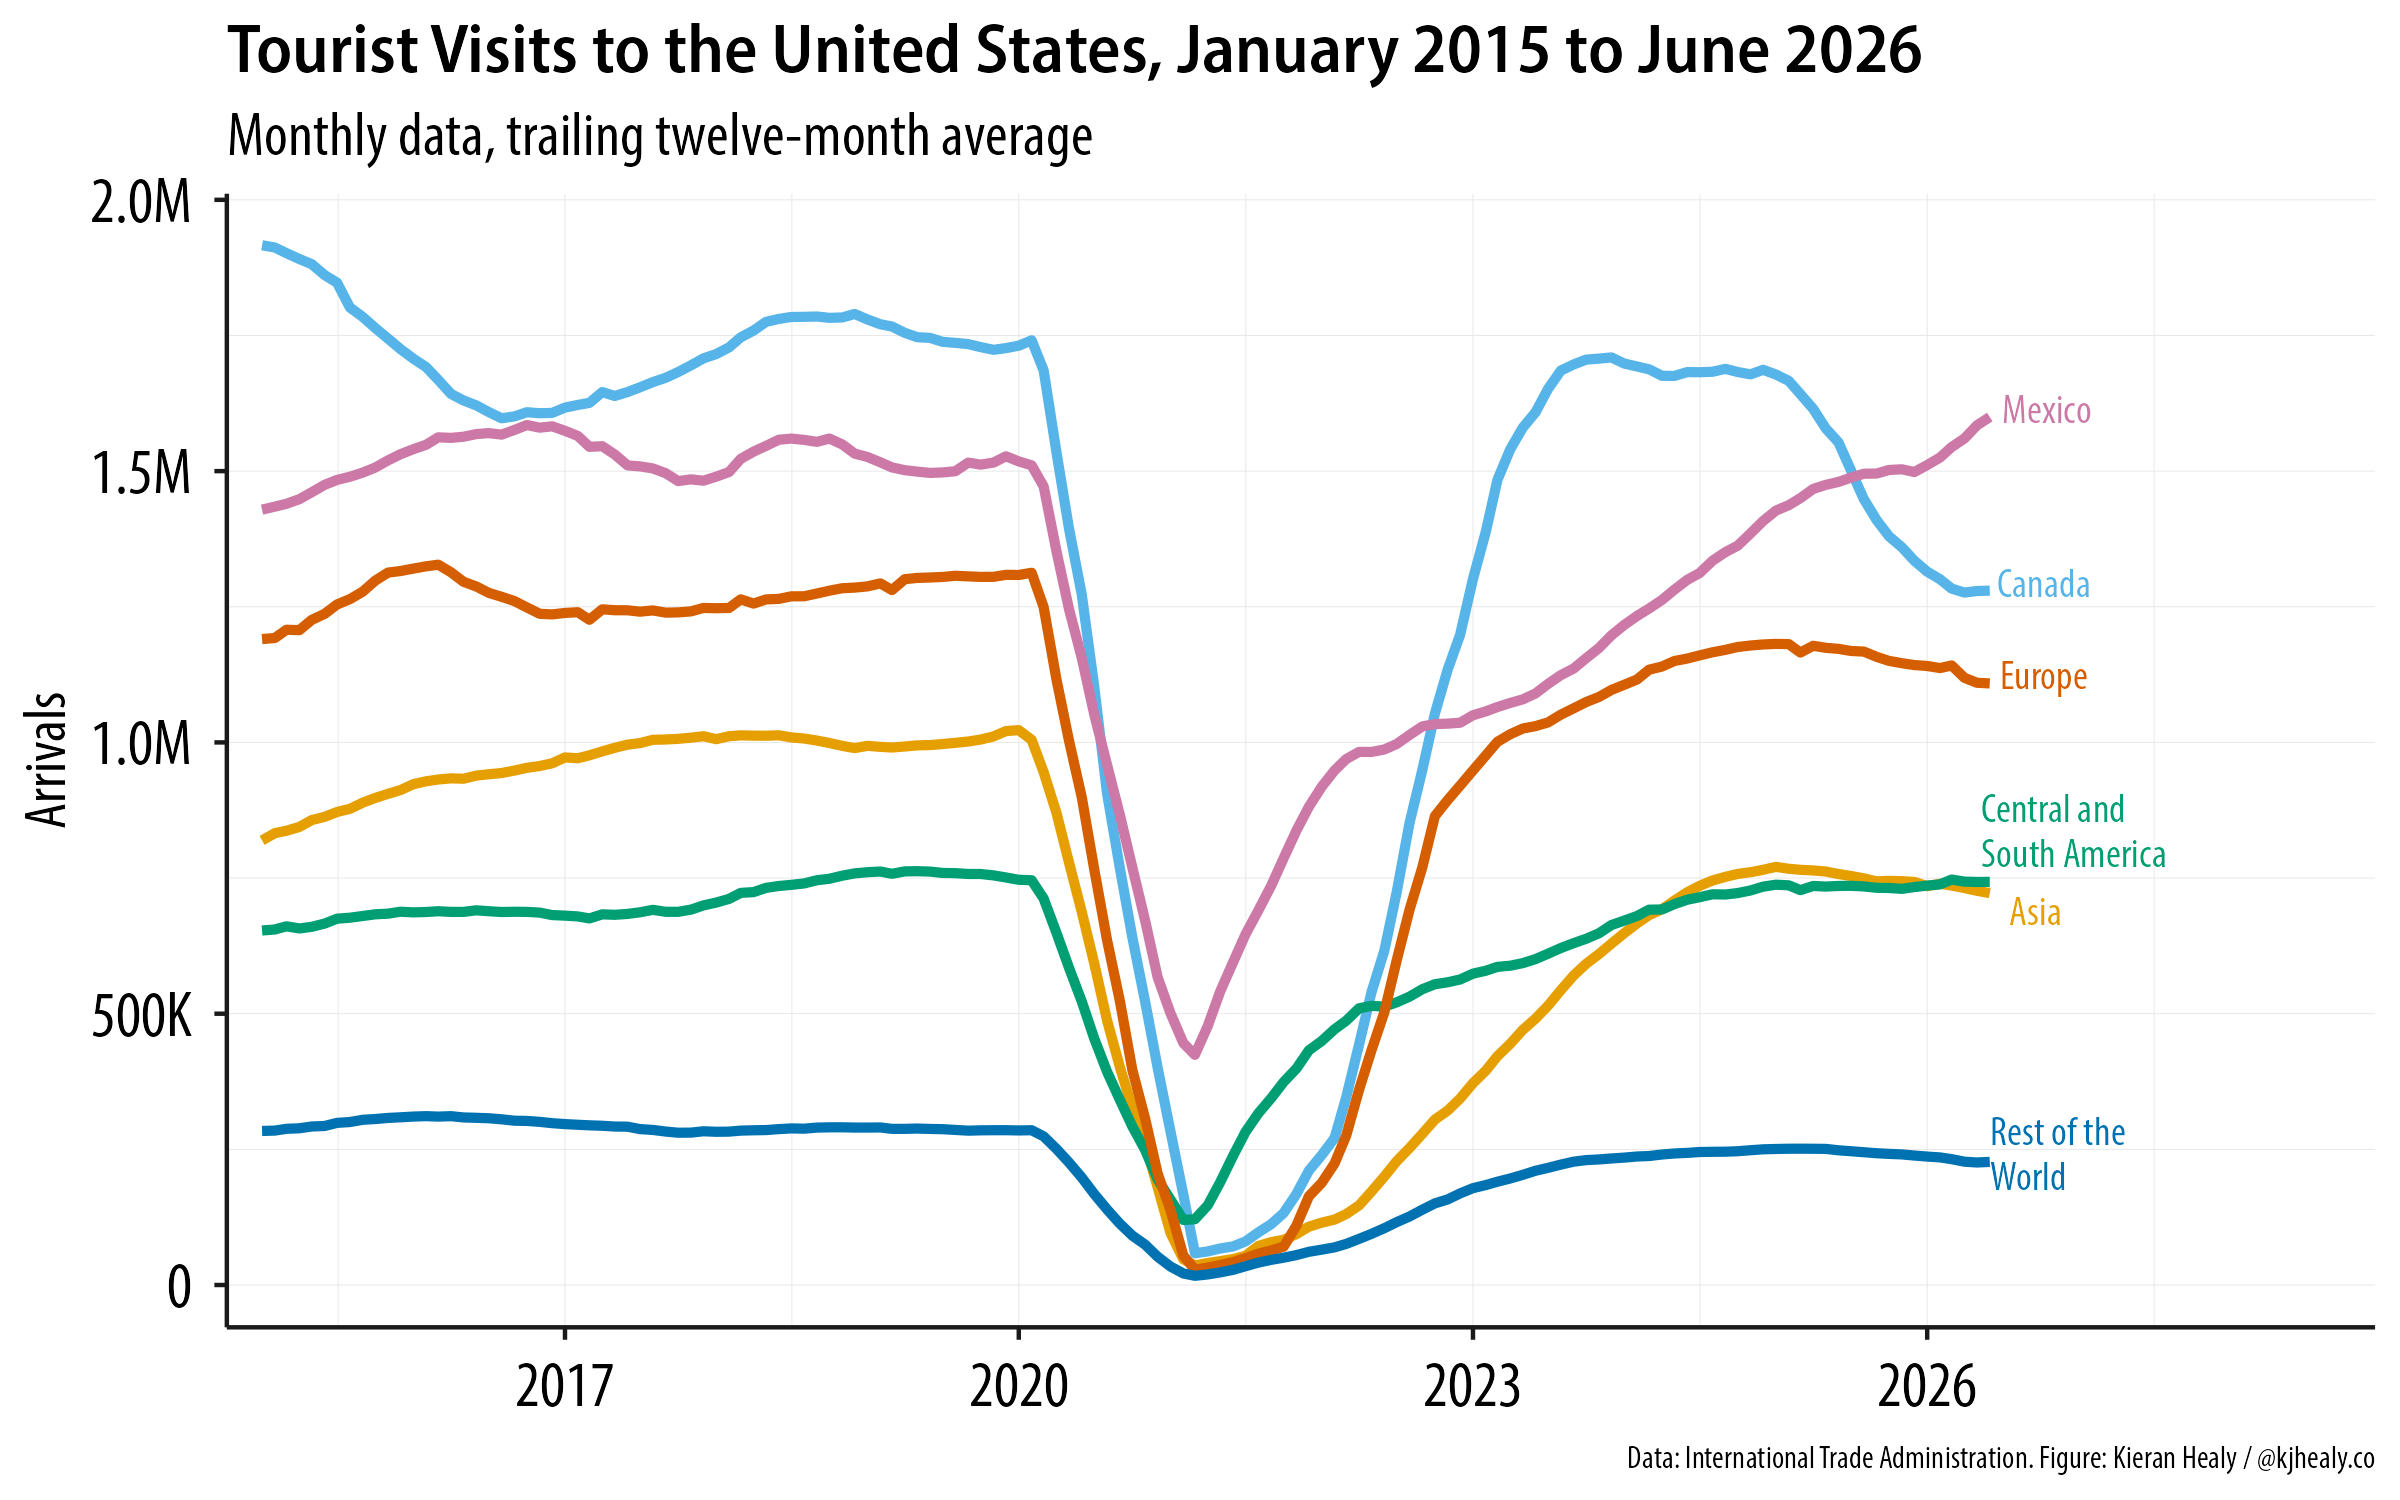
All visitor travel to the U.S.