
Every GPU programmer will tell you that you can’t beat cuBLAS at matrix multiplication. Matmul is the most popular operation by a large margin, and NVIDIA engineers have squeezed their GPUs dry. Of course, that doesn’t stop thousands of engineers, including myself, from playing this unfair sport.
I started this project as a learning exercise: write an FP32 SGEMM kernel for the RTX 5090 (Blackwell, sm_120) using the new TMA hardware introduced in Hopper and reach 80–90% of cuBLAS performance. That was the plan.
While benchmarking, the batched-mode numbers on the 5090 were 50–60% higher than cuBLAS at sizes from 1024 to 8192. That seemed suspiciously good for a learning exercise. So I profiled with ncu to see what was happening, and found that cuBLAS was dispatching a tiny simt_sgemm_128x32_8x5 kernel for the entire range of batched workloads, running at only 41% FMA pipe utilization (essentially using only 41% of available compute throughput).
I double-checked it on other GPUs and found out that the same libcublas.so binary uses a larger simt_sgemm_256x128_8x4 kernel at 73% FMA pipe utilization on the RTX PRO 6000, and an even better xmma_gemm family at 82% on the H200. RTX GPUs clearly receive less love from NVIDIA.
The reference kernel that I wrote using the new Blackwell feature — TMA (Tensor Memory Accelerator) — is still interesting. It achieves ~68% FMA pipe utilization with ~300 lines of generated C, whereas CUTLASS’s hand-tuned kernels require thousands of lines of templates to reach 73%. I will break down the TMA implementation to show how you can hit ~80–120% of cuBLAS performance with 10x less code than traditional templated approaches
Data and implementation are available in the DeploDock repository — GPU and LLM deployment, benchmarking, and optimization framework.
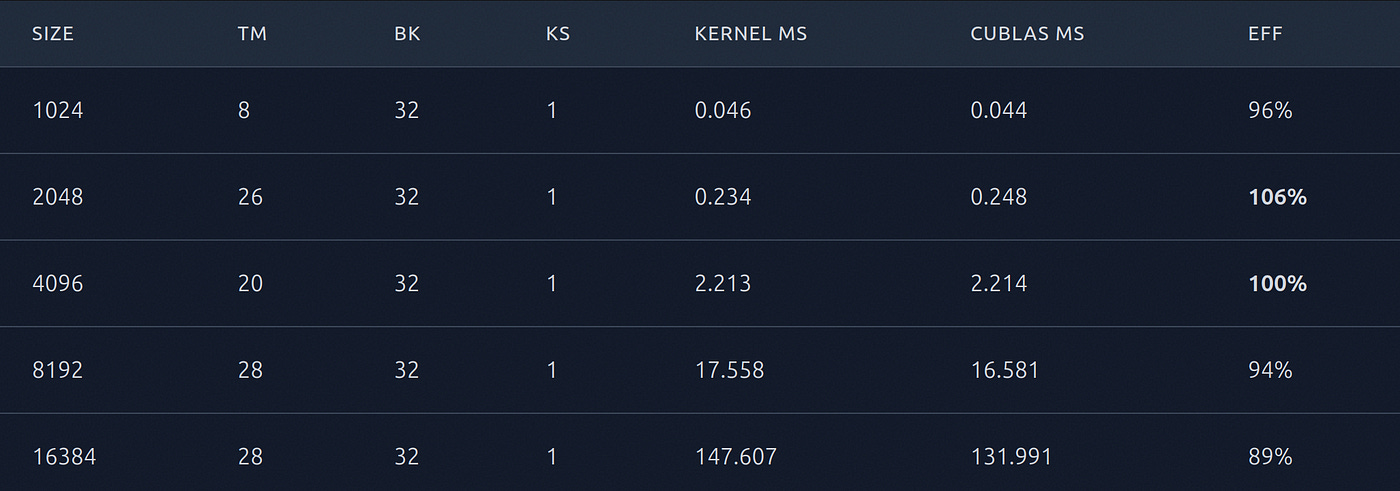
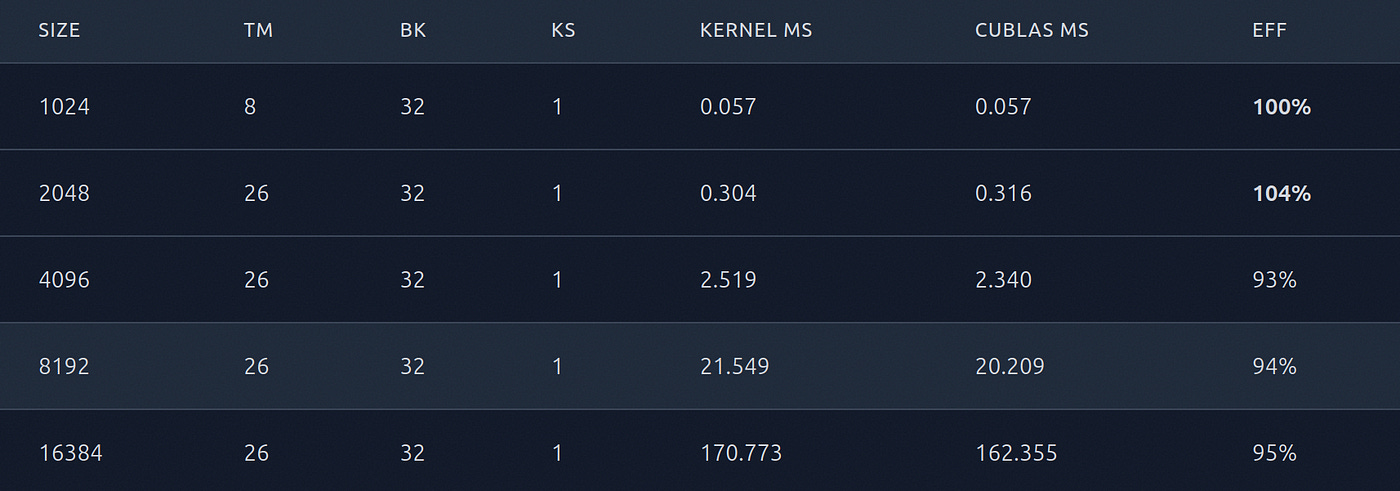
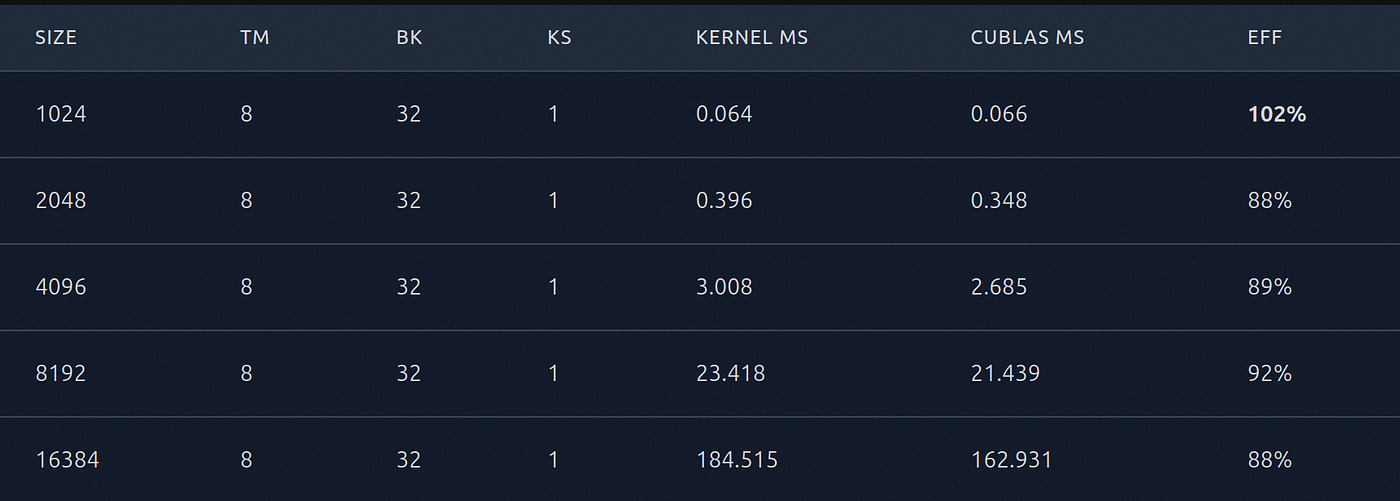
Single matmul on RTX 5090 — my kernel matches cuBLAS within 5 percentage points of FMA pipe utilization on every size (256 and 512 omitted; the per-call duration is too short and measurement variance is too high):
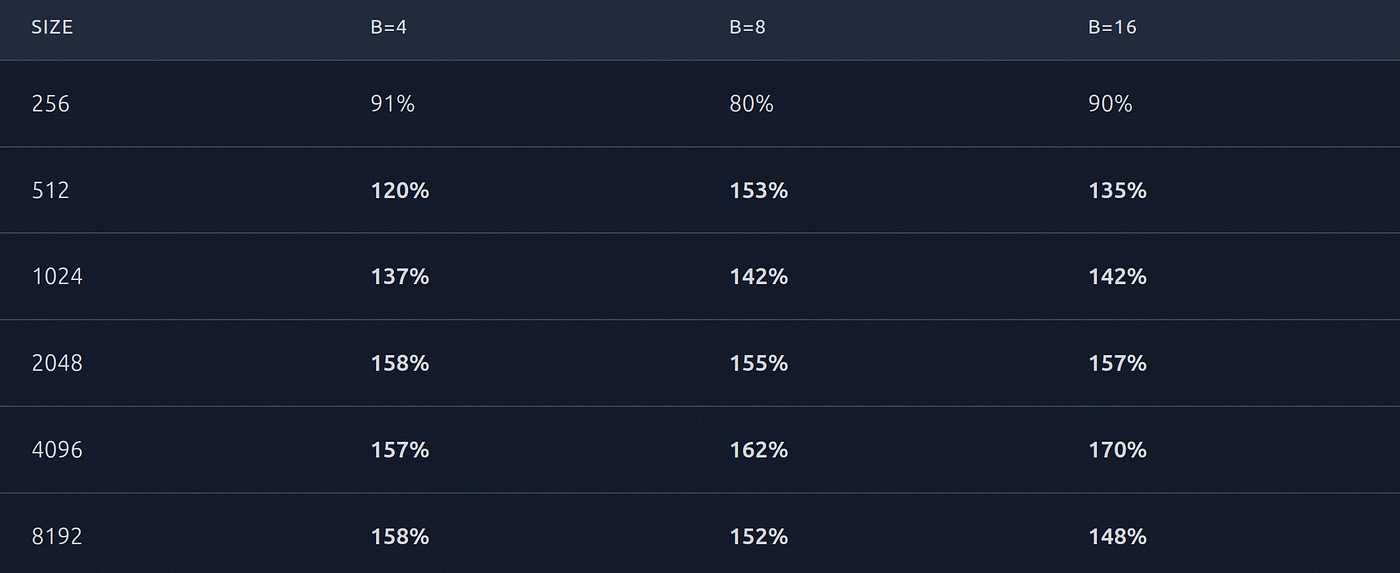
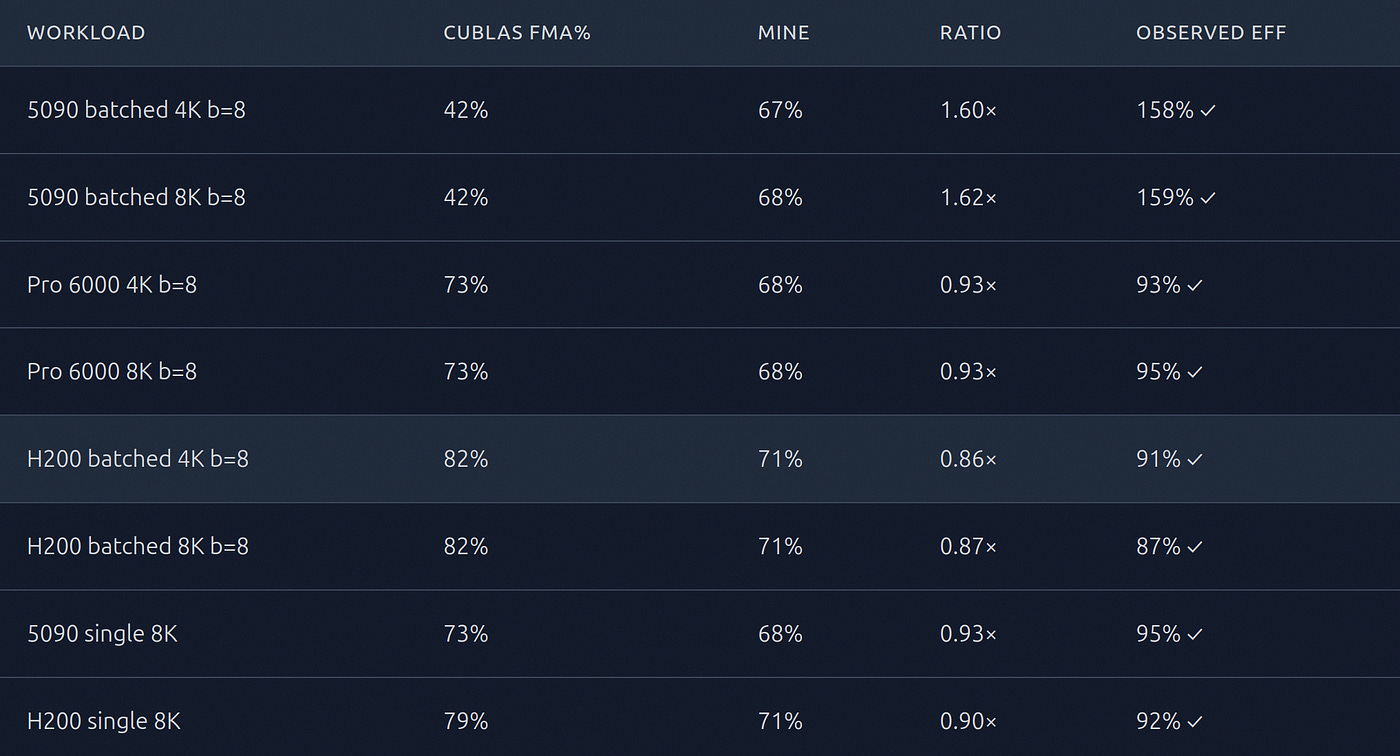
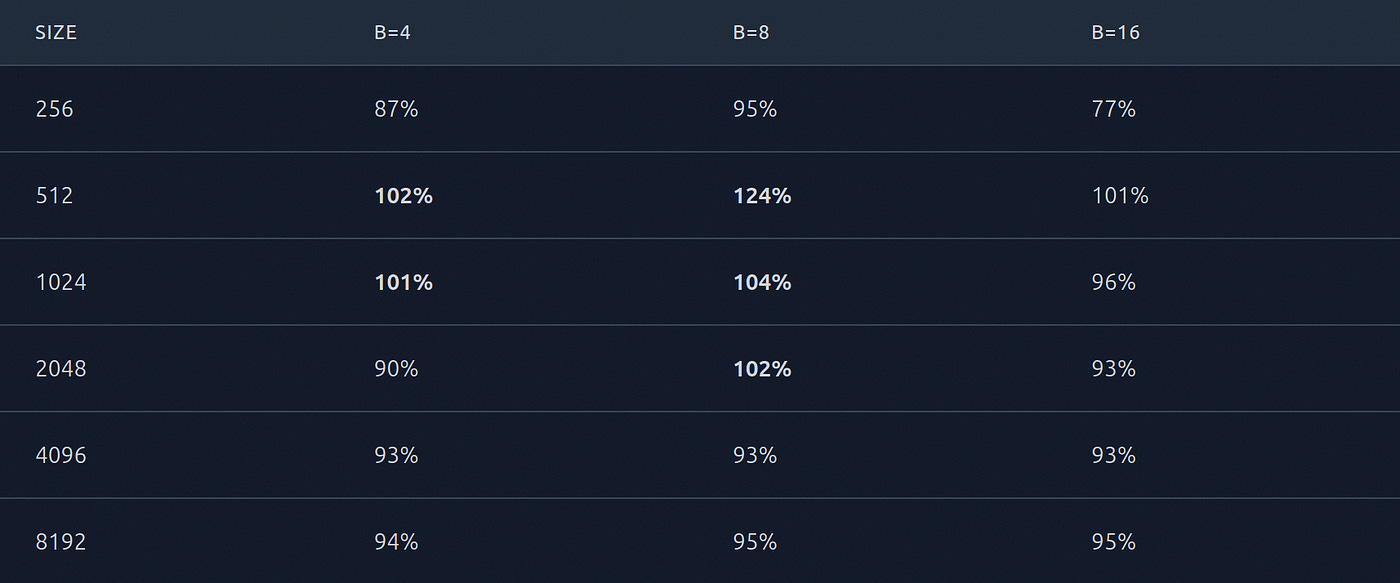
Batched matmul on RTX 5090–1.4–1.7× cuBLAS across the board:
The batched table is where it gets weird. Here’s the same cublasSgemmStridedBatched call on three different sm_90/sm_120 GPUs at batch=8, captured by ncu, showing the dispatched kernel and its FMA pipe utilization:
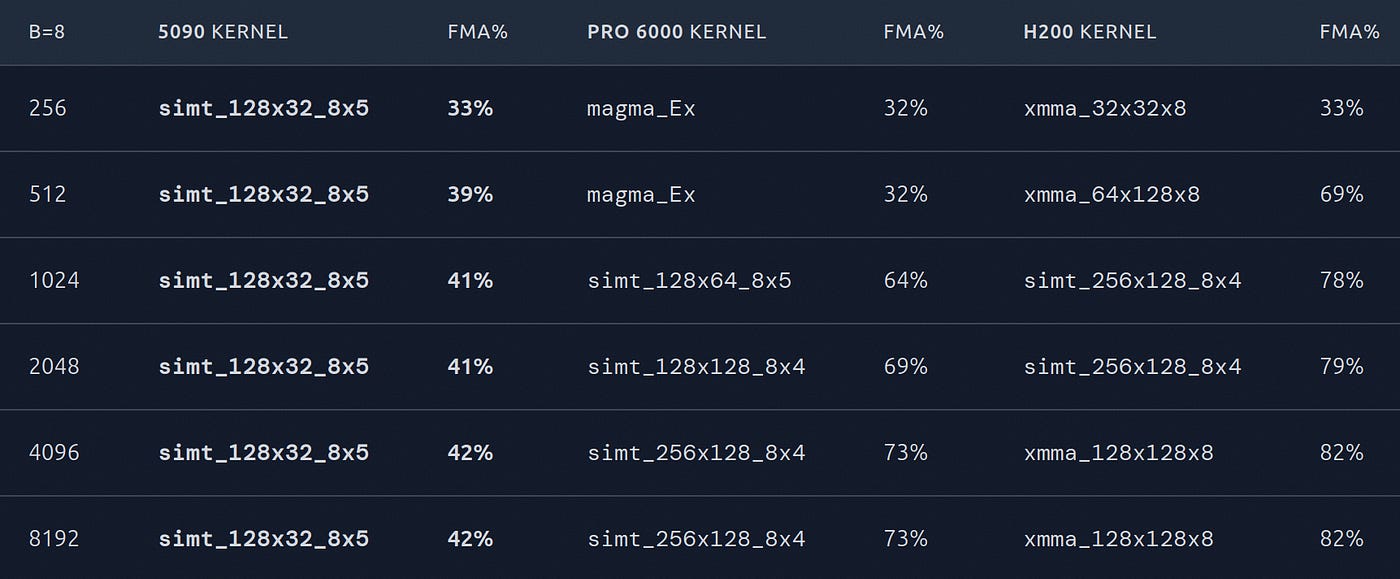
It is no surprise that cuBLAS schedules a different kernel for different matrix sizes. Kernels might perform differently on different matrix sizes, so cuBLAS tries to choose the best one. However, the behavior on different GPUs is quite different.
H200 (Hopper, sm_90) mixes the open-source CUTLASS template family at 1024–2048 with NVIDIA’s closed-source
xmma_gemmfamily at 4096+. Withinxmma_gemmit picks three different tile sizes (32×32 → 64×128 → 128×128) escalating with workload. Peak hits 82% FMA pipe utilization.RTX PRO 6000 Blackwell Max-Q (sm_120) escalates within the CUTLASS family across three tile sizes (128×64 → 128×128 → 256×128), increasing FMA pipe utilization from 64% to 73%. Less sophisticated than H200, but still good. The one bug: at 256 / 512, it falls into a legacy
magma_sgemmEx_kernelcode path at 32% FMA pipe util. (MAGMA was NVIDIA’s pre-CUTLASS linear algebra library from the early 2010s, largely absorbed into cuBLAS — the fact that its kernels still appear in the dispatch path on a 2026 GPU is a window into how deep the legacy debt goes in NVIDIA’s stack.)RTX 5090 (sm_120) picks the same
simt_sgemm_128x32_8x5kernel for every workload from 256×256 (≈microseconds per call) all the way to 8192×8192×8 batches (≈0.5 seconds per call). FMA pipe utilization stuck in the 33–42% band across the entire 32× range of linear dimensions.
This isn’t a wrong threshold somewhere in the dispatcher. There’s no escalation at any threshold. The escalation logic for the 5090 sm_120 batched FP32 path is missing entirely.
I haven’t tested kernels on other RTX GPUs like 5070 or 4090, but it is likely that the bug is present on all consumer GPUs.
cuBLASLt is NVIDIA’s “lightweight” BLAS API that exposes more control than plain cuBLAS — you can query available algorithms, set workspace sizes, and force specific compute modes. A natural question: can cuBLASLt’s algorithm heuristics route around the 5090 batched-dispatch bug? And what about hybrid approaches using tensor cores with FP32 accumulators?
I tested all cuBLASLt compute modes at 4096×4096:
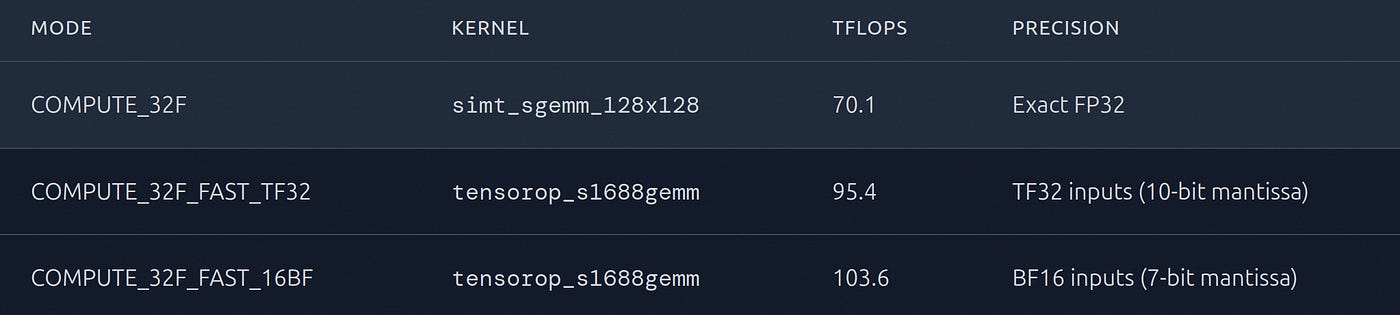
The FP32 path is locked to SIMT regardless of heuristic settings — cuBLASLt picks a simt_sgemm with a different tile (128×128 vs 256×128) but still cooperative cp.async loading, no TMA, and still no path to the dispatcher’s broken heuristic. The FAST_TF32/BF16 modes switch to tensor cores (tensorop_s1688gemm) and are 36–48% faster — but with reduced input precision. Note all three are cutlass_80-prefixed Ampere-era kernels.
For strict FP32 accuracy, tensor cores aren’t an option. TF32 truncates to a 10-bit mantissa; BF16 to a 7-bit mantissa. If your workload tolerates ~0.1% relative error, FAST_TF32 is the pragmatic choice. For exact FP32, the cuBLAS dispatcher bug applies, and there’s no public API to work around it without writing your own kernel.
My TMA template hits ~68% FMA pipe utilization on every Blackwell SKU we tested and ~71% on Hopper, which means it is about 10% behind cuBLAS, which chooses an efficient kernel, and 40–60% ahead of underperforming kernels on RTX 5090.
I will introduce my kernel now and the technologies used to make it work. To enjoy the following section of this article, it is good to familiarize yourself with general techniques for optimizing the Matmul kernel on the GPU. The How to Optimize a CUDA Matmul Kernel for cuBLAS-like Performance by Simon Boehm is a good starting point.
If you’re not deep in GPU programming, here’s the key distinction.
High-performance matmul kernels tile the computation: load a block of A and B from global memory (slow, ~1 TB/s) into shared memory (fast, ~20 TB/s), compute the partial products from shared memory, repeat. The bottleneck is the efficient transfer of data from global to shared memory. NVIDIA provides two hardware mechanisms for this — both asynchronous memory copies that bypass registers and transfer data directly.
LDGSTS (cp.async) is the traditional way to load data from global memory into shared memory. Every thread in the block participates: thread 0 loads element 0, thread 1 loads element 1, and so on. It’s cooperative — 256 threads each issue their own load instruction, generating 256 individual memory transactions. The hardware coalesces these into efficient cache-line transfers, but each thread still spends instruction slots on address computation, load issuance, and shared memory stores. CUTLASS and cuBLAS have used this approach since Ampere.
TMA (Tensor Memory Accelerator) is new hardware introduced in Hopper (sm_90) and refined in Blackwell (sm_120). Instead of 256 threads each loading one element, a single thread issues one cp.async.bulk.tensor.2d command that describes the entire 2D tile — “load a 32×224 block of floats starting at row R, column C.” The TMA hardware unit, separate from the CUDA cores, handles the entire transfer via DMA. The other 255 threads contribute zero instructions — they can compute while the load happens in the background. Blackwell’s TMA unit shares the same PTX interface as Hopper’s; the practical difference I observed is that Blackwell favors larger per-thread tiles (TM=28 is optimal on the 5090 vs TM=8 on the H200), suggesting the sm_120 TMA unit has lower per-issue overhead or better pipelining of concurrent descriptors.
In principle, TMA should be faster than LDGSTS because it removes per-thread loading overhead. In practice, on the workloads I measured, TMA and well-tuned LDGSTS land within 5% of each other at the FMA pipe utilization level. What TMA actually buys you is kernel implementation simplicity — you can write a fully-pipelined SGEMM kernel in ~300 lines of generated C, vs the thousands of lines of templated C++ that CUTLASS needs.
On Blackwell, the TMA hardware unit can load a 2D tile from global memory to shared memory with a single PTX instruction. One thread issues cp.async.bulk.tensor.2d, the hardware does the rest.
The kernel uses this in a double-buffer pipeline:
Tile 0: [TMA loads buf0] [wait] [compute buf0 + TMA loads buf1]
Tile 1:                         [wait buf1] [compute buf1 + TMA loads buf0]
Tile 2:                                     [wait buf0] [compute buf0 + TMA loads buf1]
...
While all 256 threads compute FMAs from the current buffer, thread 0 issues a TMA command to fill the other buffer. The TMA hardware runs on a separate path from the CUDA cores — true parallel execution.
Here’s the simplified kernel structure (TM=8 variant, 32 accumulators):
__global__ __launch_bounds__(256)
void fused_matmul(
    const __grid_constant__ CUtensorMap A_tma,
    const __grid_constant__ CUtensorMap B_tma,
    float* C)
{
    extern __shared__ __align__(128) char dsmem[];
    float* smem = (float*)dsmem;
    // Two mbarriers for double-buffer synchronization
    uint64_t* mbar = (uint64_t*)(dsmem + 2 * STAGE * 4);

    // Shared memory addresses for TMA targets
    const int as0 = __cvta_generic_to_shared(&smem[0]);
    const int bs0 = __cvta_generic_to_shared(&smem[A_SIZE]);
    const int as1 = __cvta_generic_to_shared(&smem[STAGE]);
    const int bs1 = __cvta_generic_to_shared(&smem[STAGE + A_SIZE]);

    // Thread identity
    int tid = threadIdx.y * 32 + threadIdx.x;
    int tr = threadIdx.y * TM, tc = threadIdx.x * 4;
    int bm = blockIdx.y * BM, bn = blockIdx.x * BN;

    // Initialize mbarriers (thread 0 only)
    if (tid == 0) {
        mbarrier_init(mbar[0]); mbarrier_init(mbar[1]);
    }
    __syncthreads();

    float c[TM][4] = {};  // Accumulators
    // Pre-load first tile
    if (tid == 0) {
        mbarrier_expect_tx(mbar[0], BYTES);
        tma_load_2d(as0, &A_tma, /*k=*/0, bm, mbar[0]);
        tma_load_2d(bs0, &B_tma, bn, /*k=*/0, mbar[0]);
    }

    for (int t = 0; t < K/BK; t++) {
        int s = t % 2;  // Current buffer

        // Wait for current tile’s TMA to complete
        mbarrier_wait(mbar[s], phase[s]);

        // Start loading NEXT tile (overlaps with compute)
        if (tid == 0 && t + 1 < nt) {
            tma_load_2d(next_buf_a, &A_tma, next_k, bm, next_mbar);
            tma_load_2d(next_buf_b, &B_tma, bn, next_k, next_mbar);
        }

        // Compute: all 256 threads do FMA from shared memory
        float* As = &smem[s * STAGE];
        float* Bs = &smem[s * STAGE + A_SIZE];
        #pragma unroll
        for (int kk = 0; kk < BK; kk++) {
            float b0 = Bs[kk*BN+tc], b1 = Bs[kk*BN+tc+1], ...;
            for (int i = 0; i < TM; i++) {
                float a = As[(tr+i)*BK+kk];
                c[i][0] += a * b0;
                c[i][1] += a * b1;
                // ... 4 FMAs per row
            }
        }
        __syncthreads();
    }

    // Write results to global memory
    for (int i = 0; i < TM; i++)
        store_row(C, bm+tr+i, bn+tc, c[i]);
}
The generated kernel is denser (with inline PTX for mbarrier and TMA operations), but this captures the architecture. You can find the kernel generator in deplodock/compiler/cuda/lower.py (see _lower_matmul_tma_db).
A useful optimization is to make M, N, K #define constants, and not kernel parameters. The runner generates a fresh .cu file for each benchmark invocation with the actual dimensions baked in:
#define M 8192
#define N 8192
#define K 8192

__global__ void fused_matmul(...) {
    // nt = K/32 becomes nt = 256 - a literal constant
    // Bounds checks become dead code for aligned sizes
}
This lets nvcc optimize the tile loop bound, eliminate unreachable branches, and make better register allocation decisions. Moving M/N/K from runtime parameters to compile-time constants improved 1024 from 98% to 101% and 4096 from 100% to 101%.
Similarly, the write-back bounds checks (if (gr < M), if (gc < N)) are eliminated via #if when the matrix dimensions are multiples of the tile size:
#if (M % 224 == 0 && N % 128 == 0)
#define W(r, v0, v1, v2, v3) { /* no bounds checks */ }
#else
#define W(r, v0, v1, v2, v3) { /* with bounds checks */ }
#endif
In practice, this compile-time specialization makes sense for a set of common sizes (powers of 2, standard model dimensions) rather than generating a kernel for every possible M/N/K.
Different matrix sizes have different optimal tile shapes. An adaptive strategy map selects the best configuration per size. These were found empirically by benchmarking various configurations on each GPU. For RTX 5090:
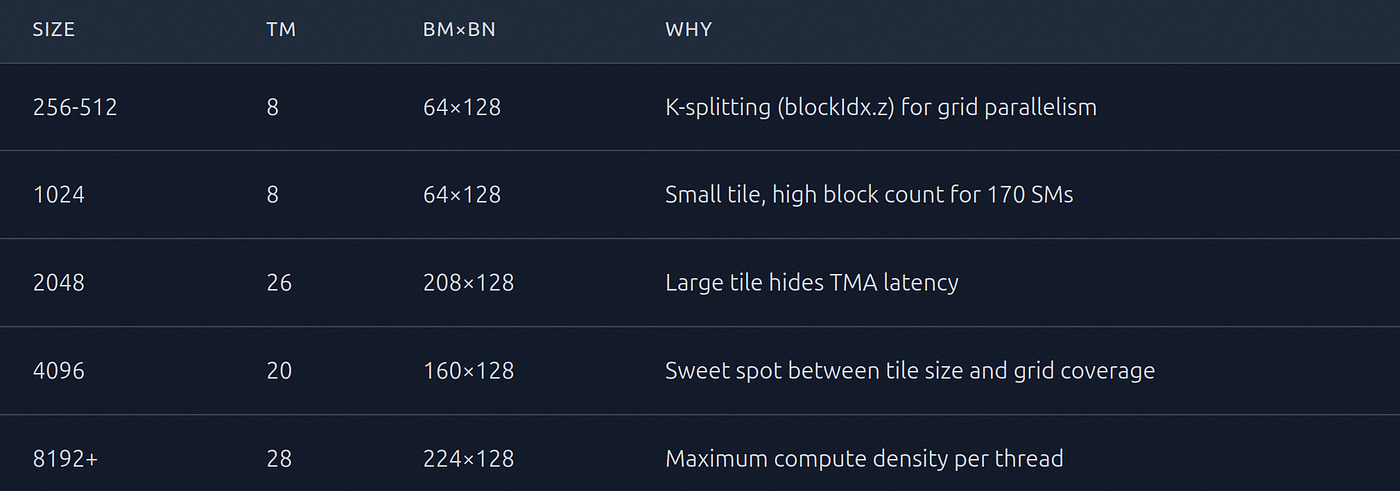
At TM=28, each thread computes 28×4 = 112 output elements, requiring 112 accumulator registers. The inner loop is fully unrolled (BK=32 iterations), and the compiler uses 241 registers total — close to the sm_120 limit of 255.
At 16384×16384, the working set is 3 GB — far beyond the 72 MB L2 cache. Without careful block scheduling, different blocks evict each other’s L2 lines. I linearize the grid and rasterize in groups of 8 row-tiles:
const int SWIZ = 8;
int pid = blockIdx.x;
int grp = pid / (gridDim.x * SWIZ);
int rem = pid % (gridDim.x * SWIZ);
int by = grp * SWIZ + rem % SWIZ;   // Row block
int bx = rem / SWIZ;                // Column block
This ensures 8 adjacent row-blocks run together, maximizing reuse of A-tiles in L2. ncu profiling confirmed this reduced DRAM throughput from 32% to 8.5% — matching cuBLAS’s 8.2%.
Batched mode is a one-line change: blockIdx.z selects the batch element, each batch gets its own TMA descriptor:
int batch = blockIdx.z;
const CUtensorMap& A_tma = A_tma_array[batch];
// ... same kernel, different data
float* C_batch = C + batch * M * N;
All measurements: CUDA 13.2.51, cuBLAS 13.3.0, driver 595.58.03, captured by scripts/diagnostics/ncu_compare.sh.
A quick glossary for the metrics: IPC (instructions per cycle) measures how many instructions the SM issues per clock — higher is better, max ~4.0 on sm_120. FMA pipe is the percentage of cycles the fused multiply-add units are active — this is the actual compute throughput. Issue active is the percentage of cycles where at least one warp scheduler successfully issues an instruction — gaps here mean all warps are stalled.
For single matmul at 8192:
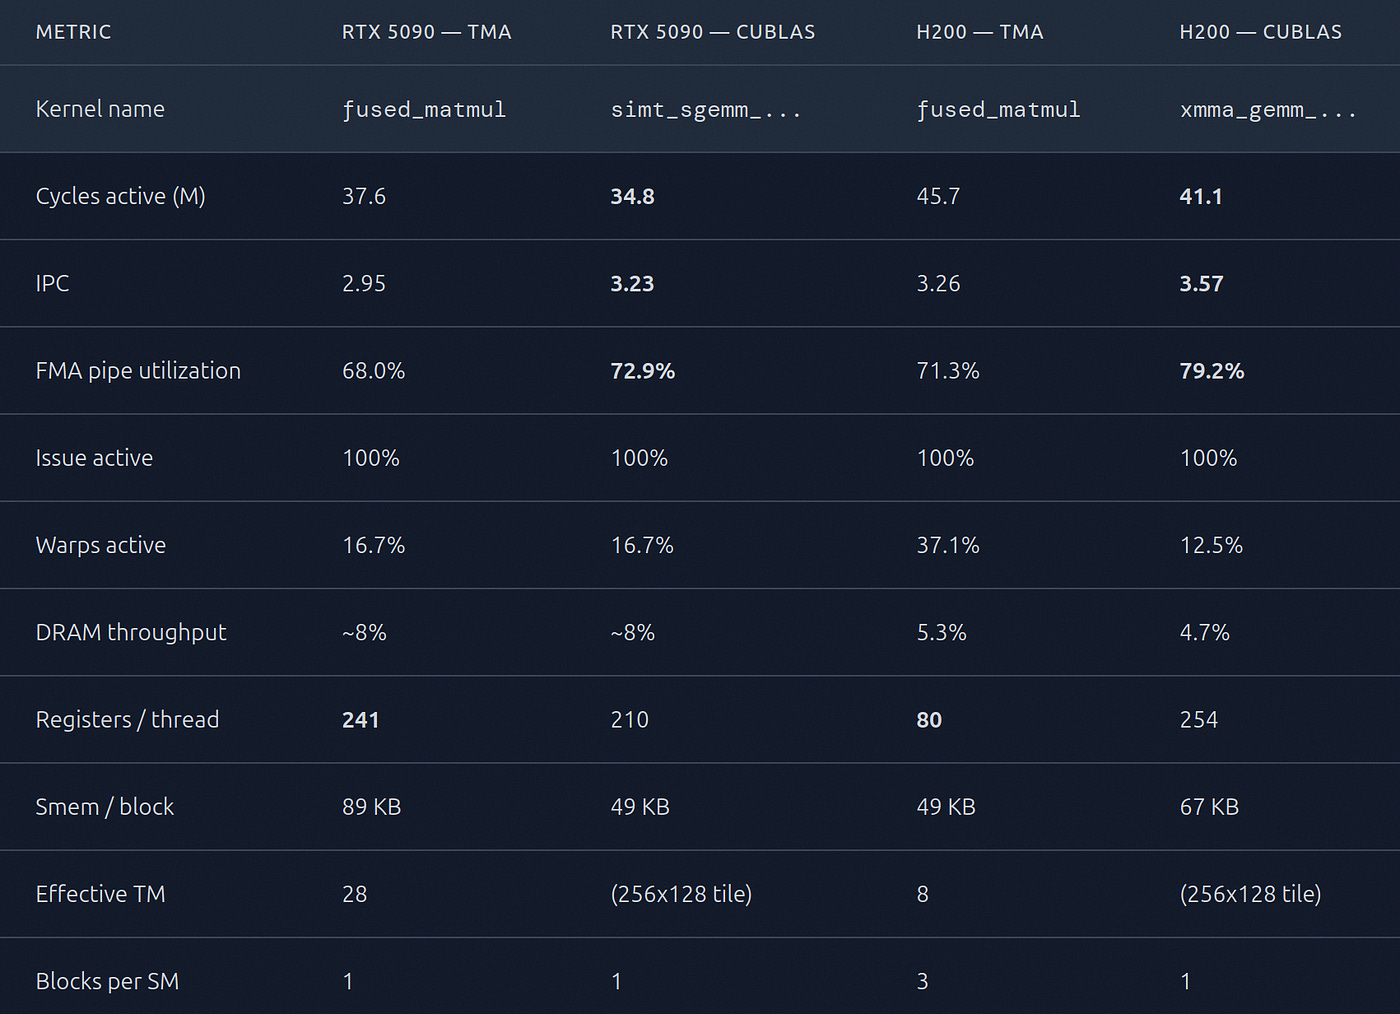
The performance gap maps directly to the FMA pipe gap. On the 5090 single mode, cuBLAS hits 72.9% FMA pipe utilization vs my 68.0% — a ~5% gap, which matches the ~5% efficiency gap in the headline tables (cycles_active: 34.8 M vs 37.6 M = 92.6% ratio). On the H200 single mode, cuBLAS hits 79.2% vs my 71.3% — a ~8% gap, matching the ~10% efficiency gap (cycles_active: 41.1 M vs 45.7 M = 89.9% ratio). It’s not bandwidth (DRAM throughput is 5–8%, nowhere near the limit). It’s not issue-active (both kernels are at 100%). It’s purely how many of the issued instructions actually land in the FMA pipe.
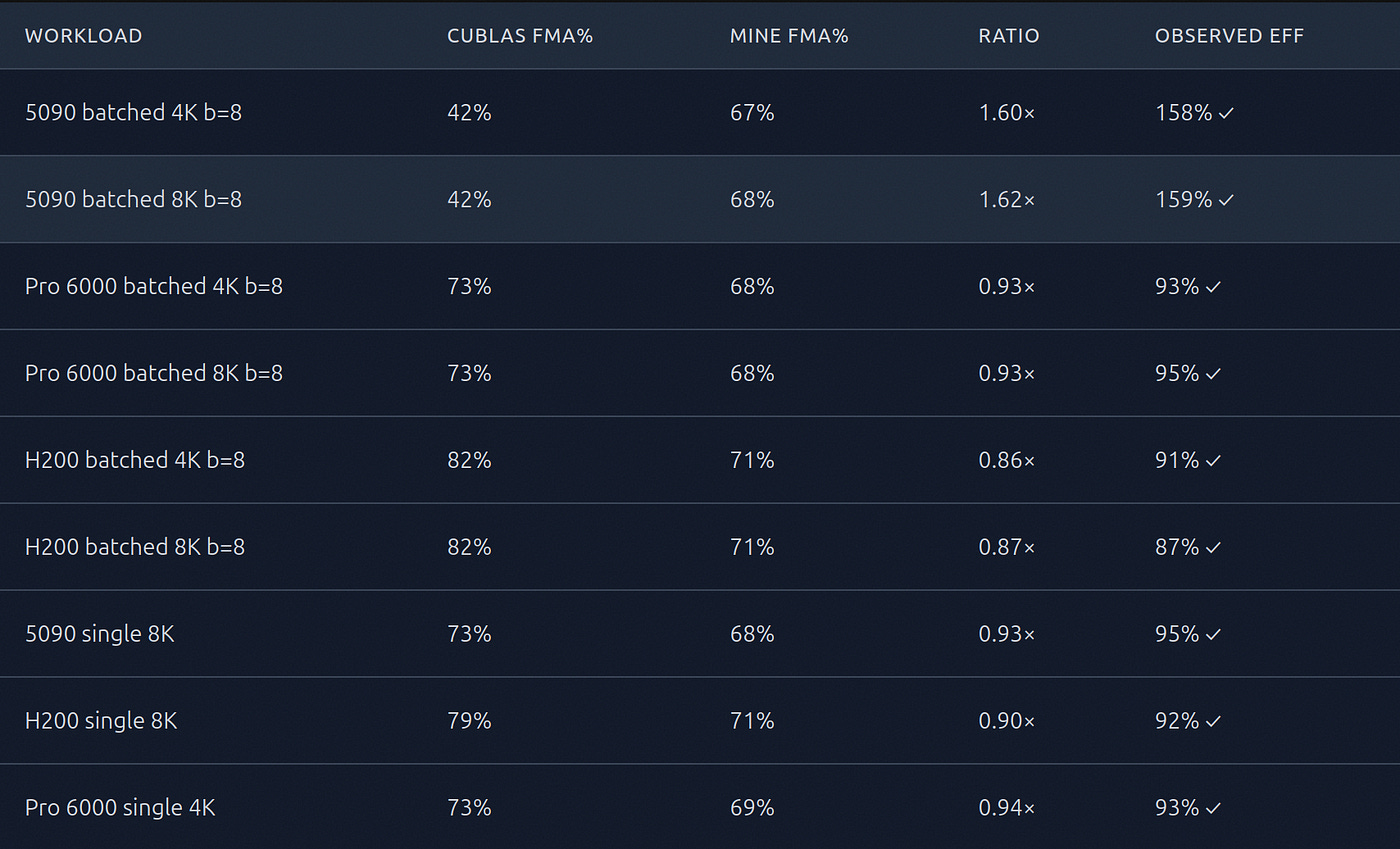
The batched mode comparison is already covered in the headline section. The findings are the same: the performance gap maps directly to the FMA pipe gap. Putting the per-arch FMA pipe numbers next to the observed efficiencies:
The full ncu sweep with raw per-row data is committed in the recipe directory at recipes/sgemm_cublas_vs_tma/ncu/batched_dispatch_finding.md, reproducible with scripts/diagnostics/ncu_compare.sh.
The article so far has the headline numbers and the dispatcher-bug evidence. Both are about which kernel runs and how the GPU dispatches it. Neither answers the more refined question: when cuBLAS does dispatch the right kernel — cutlass_80_simt_sgemm_256x128_8x4_nn_align1 on the 5090 single-mode path — why does it consistently hit ~73% FMA pipe utilization while my generated TMA template gets ~68%? This section is the SASS-level investigation that produced a measured answer, and walks through the reproducible scripts that surface it.
All numbers below are from running on an RTX 5090, CUDA 13.2.51, cuBLAS 13.3.0, single mode, 8192×8192. The full per-instruction ncu source view, the per-kernel stall histograms, and the inner-loop SASS excerpts are committed in recipes/sgemm_cublas_vs_tma/ncu/scheduling/ so you can re-derive them yourself.
scripts/diagnostics/sass_analysis.py compiles a fresh tma_db bench binary, runs cuobjdump --dump-sass, and counts opcodes by family. For my fused_matmul (TM=28, BK=32) at 8192×8192:
3584 FFMA               — fused multiply-add (the actual compute)
  256 LDS.128           — 128-bit shared memory loads (float4)
  112 STG.E             — 32-bit predicated global stores (4 per row × 28 rows,
                          bounds-checked because 8192 % 224 ≠ 0; an aligned size
                          collapses to 28 STG.E.128 via nvcc auto-vectorization)
   48 CS2R / S2R        — clock + special-register reads
    4 UTMALDG.2D        — TMA load commands (the entire loading!)
  143 ISETP.*           — integer set-predicate (bounds + loop control)
   60 BAR/BSYNC/BSSY    — block barriers and reconvergence
   30 LDC.*             — constant loads (kernel params, TMA descriptors)
  169 MOV/IMAD/IADD/LEA — address arithmetic and reg copies
cuBLAS’s cutlass_80_simt_sgemm_256x128_8x4_nn_align1 ships as a PTX template inside libcublasLt.so and JIT-compiles at runtime. To see its actual SASS, capture the cubin via ncu while the kernel is running (ncu --set full --print-units base -o profile.ncu-rep ./cublas_probe, then ncu --import profile.ncu-rep --page source --print-source sass). The result has 1152 FFMAs and 256 LDS in the kernel body — a third of my FFMA count, because cuBLAS uses a smaller per-thread tile (more CTAs, fewer FMAs per thread). The notable structural fact: 0 shared-memory store instructions in mine, 256 in cuBLAS (cuBLAS pipelines through smem with cp.async + st.shared, my TMA hardware writes smem directly via DMA). That’s the one place TMA buys a real instruction-count saving.
The first hypothesis I tested was the obvious one: maybe ptxas places LDS loads too close to their consumer FFMAs, and the warp scheduler stalls waiting for the load to complete. To check, I extended the diagnostic with scripts/diagnostics/scheduling_analysis.py — it parses the disassembly, walks each LDS.* forward through the instruction stream, and finds the first downstream FFMA that uses any of the loaded registers. The distance between the load and its consumer is your latency-hiding budget.
For my fused_matmul at 8192:
FFMAs between LDS and first consumerCount[0, 5)3[5, 10)1[10, 20)13[20, 40)110[40, 80)117[80, 160)11[160, ∞)1
Median: 40 FFMAs; mean: 44.6. Only 4 of 256 LDS have a consumer within 10 FFMAs. Blackwell LDS latency is on the order of 30 cycles, and each FFMA is one cycle on the FMA pipe, so ptxas essentially hides LDS latency perfectly. The “ptxas places LDS too close to consumers” hypothesis was wrong. That’s not where the gap is.
Running the same analysis on the cuBLAS kernel (extracted from the ncu source view) gives a completely different shape:
minecuBLASFFMAs in kernel body35841152LDS instructions256256LDS / FFMA ratio1 per 141 per 4.5Median LDS → first consumer40 FFMAs158 FFMAsMedian LDS → next LDS spacing5 FFMAs0 FFMAs
cuBLAS’s median LDS-to-next-LDS spacing is zero — its LDS instructions are clustered into back-to-back groups. My kernel evenly distributes LDS across the FFMA cluster, with a median of 5 FFMAs between consecutive loads. Both schedules hide LDS latency well (40 vs. 158 FFMAs), but they produce fundamentally different warp behaviors at runtime.
The difference matters because of how it affects warp staggering across the SM’s warp schedulers:
cuBLAS schedule (clustered LDS):
  warp 0: [LDS LDS LDS LDS LDS LDS] [FFMA FFMA FFMA FFMA FFMA FFMA FFMA ...]
  warp 1:        [LDS LDS LDS LDS LDS LDS] [FFMA FFMA FFMA FFMA FFMA ...]
  warp 2:               [LDS LDS LDS LDS LDS LDS] [FFMA FFMA FFMA FFMA ...]
           ← warps naturally stagger: while warp 0 does FFMAs, warp 1 is in
             its LDS cluster, so the FMA pipe sees steady demand from ONE warp
             at a time → low dispatch_stall

My schedule (interleaved LDS):
  warp 0: [FFMA FFMA FFMA FFMA LDS FFMA FFMA FFMA FFMA LDS FFMA FFMA ...]
  warp 1: [FFMA FFMA FFMA FFMA LDS FFMA FFMA FFMA FFMA LDS FFMA FFMA ...]
  warp 2: [FFMA FFMA FFMA FFMA LDS FFMA FFMA FFMA FFMA LDS FFMA FFMA ...]
           ← all warps are in the SAME phase: they all want the FMA pipe on
             the same cycles → high dispatch_stall (44% vs 22%)
You can see the difference in the actual inner-loop SASS excerpts. Here’s a 30-line slice from cuBLAS’s cutlass_80_simt_sgemm_256x128 (recipes/sgemm_cublas_vs_tma/ncu/scheduling/cublas_inner_loop_excerpt.txt):
**LDS.128 R132, [R130]**            ← 6 LDS in a row (clustered)
  LDCU.64 UR16, c[0x0][0x3c0]
  SHF.R.U32.HI R30, RZ, 0x1, R131
  IADD.64 R200, R200, UR4
**LDS.128 R140, [R130+0x40]**
  LDCU.64 UR14, c[0x0][0x3e0]
  LOP3.LUT R185, R185, 0xffc, R30, 0xc8, !PT
  IADD.64 R204, R204, UR10
**LDS.128 R144, [R130+0x80]**
  ISETP.NE.AND P0, PT, R189, RZ, PT
  MOV R186, RZ
**LDS.128 R148, [R130+0xc0]**
  ...                              ← then the FFMA burst
**LDS.128 R156, [R130+0x200]**
  FFMA R127, R132, R136, R127      ← consumer arrives 158 FFMAs later in steady state
  FFMA R128, R133, R136, R128
  FFMA R126, R133, R137, R126
  FFMA R125, R132, R137, R125
  FFMA R123, R134, R136, R123
  ... (long FFMA run with occasional single LDS interleaved)
And here’s mine (recipes/sgemm_cublas_vs_tma/ncu/scheduling/fused_matmul_inner_loop_excerpt.txt):
FFMA R140, R36, R144, R159       ← FFMAs running
  FFMA R158, R37, R144, R158
  FFMA R161, R38, R144, R161
  FFMA R160, R39, R144, R160
  FFMA R144, R36, R148, R163
  FFMA R162, R37, R148, R162
  FFMA R165, R38, R148, R165
  FFMA R164, R39, R148, R164
  FFMA R3,   R41, R152, R166
**LDS.128 R36, [R15+0x8400]**    ← single LDS in the middle of the cluster
  FFMA R168, R41, R153, R168
  FFMA R167, R41, R154, R167
  FFMA R40,  R41, R155, R40
  FFMA R5,   R45, R152, R172
  ... (continues with one LDS every ~5 FFMAs)
These are two valid SGEMM schedules. Both feed the FMA pipe. They differ in how the warps stagger.
I captured the per-warp stall reasons from ncu. The script is scripts/diagnostics/ncu_stall_compare.sh; it builds a small probe binary for both kernels at the same shape and extracts the smsp__average_warps_issue_stalled_*_per_issue_active metrics. Each value is “warps stalled on this reason per issue-active cycle” — sums can exceed 100% when multiple warps stall in parallel.
For 5090 single-mode 8192:
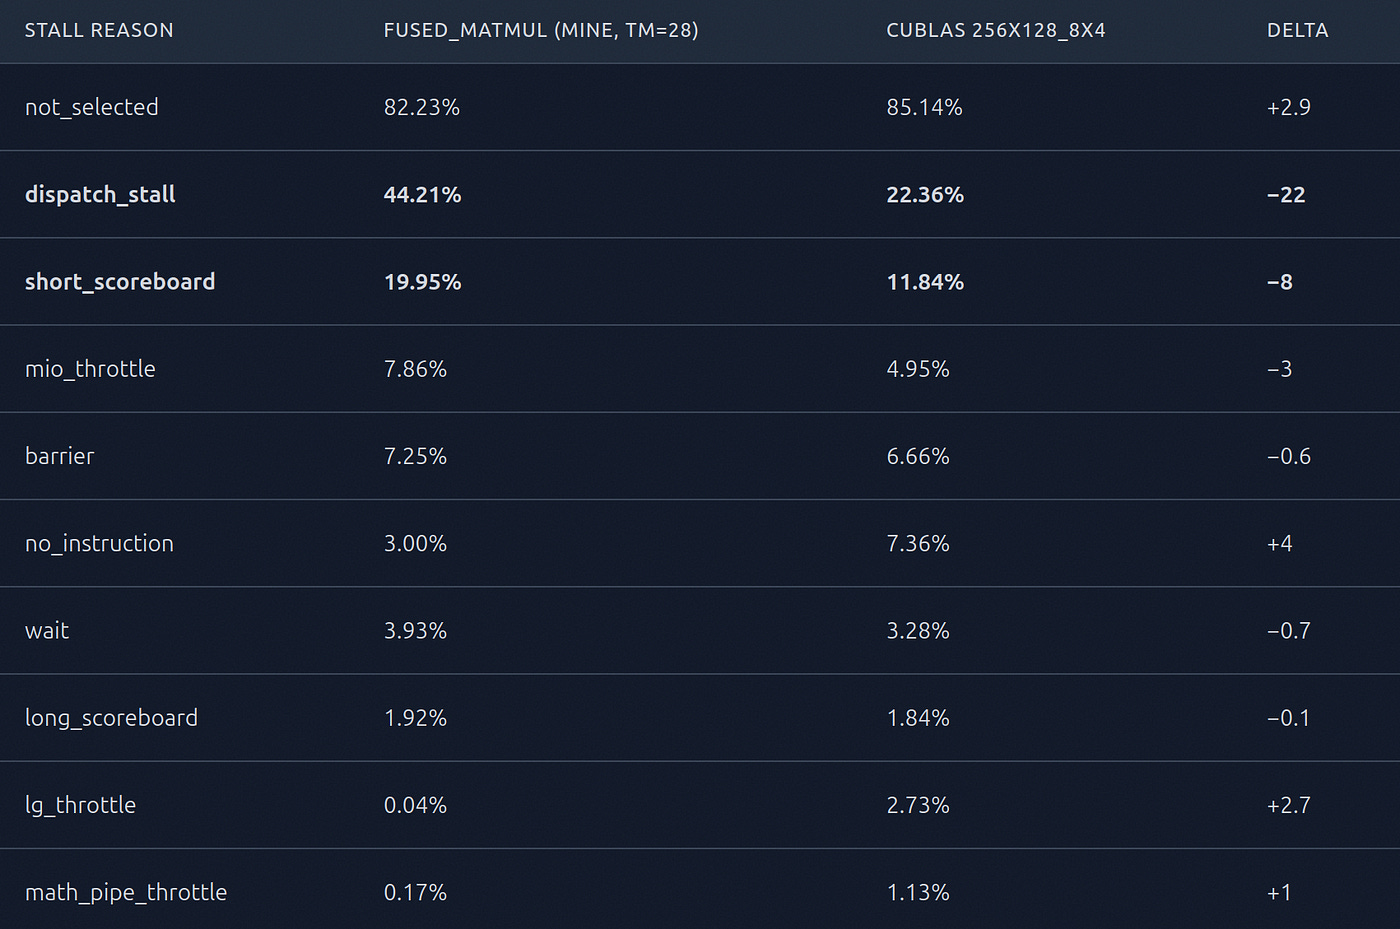
There are two large deltas:
dispatch_stall = 44 % vs 22 %. Dispatch stall happens when the warp scheduler has picked a ready warp, but the dispatch unit can’t accept another instruction this cycle — typically because some other warp’s in-flight FFMA has the FMA pipe back-pressured. My kernel has twice as many dispatch stalls as cuBLAS does, and that’s the dominant cause of the FMA pipe utilization gap.
short_scoreboard = 20 % vs 12 %. Short scoreboard stalls depend on short-latency operations (LDS reads), during which the scheduler waits for the scoreboard bit to clear. Even though my static LDS-to-consumer distance is 40 FFMAs (more than enough to hide the latency in isolation), the consumers are tightly interleaved into a long FFMA run, so the scoreboard’s temporal hiding is shorter than the static count suggests.
Both deltas point to the same root cause: warp-phase alignment. With my spread-LDS pattern, all warps are in roughly the same execution phase at the same time — they all want to execute FFMA instructions on the same cycles. With cuBLAS’s clustered-LDS pattern, warps stagger naturally: while warp A is draining a long FFMA run, warp B is in its LDS cluster, warp C is finishing a previous FFMA cluster. The warp scheduler always has a different warp to switch to, rather than contending for the FMA pipe.
The performance gap between my kernel and cublas is caused by the temporal distribution of LDS instructions across warps, which determines whether warps stagger or align and, in turn, how much dispatch-stall pressure piles up on the FMA pipe.
A common concern with TMA double-buffer schemes: don’t threads waste cycles spinning in mbarrier.try_wait? Empirically, no. The TMA transfer for the 45 KB double-buffer slot (bytes=45056 in the kernel source) completes well within the FFMA compute phase, so the try-wait spin loop almost always exits on its first read. The dispatch_stall and short_scoreboard numbers above don’t include any meaningful contribution from try-wait spinning — both wait = 3.9% and barrier = 7.3% are small compared to the dispatch-side gap.
The constant 5–11% gap below cuBLAS’s best-available kernel (when the dispatcher does its job) shows up on every architecture I tested. I systematically tried to close it. None of these worked:
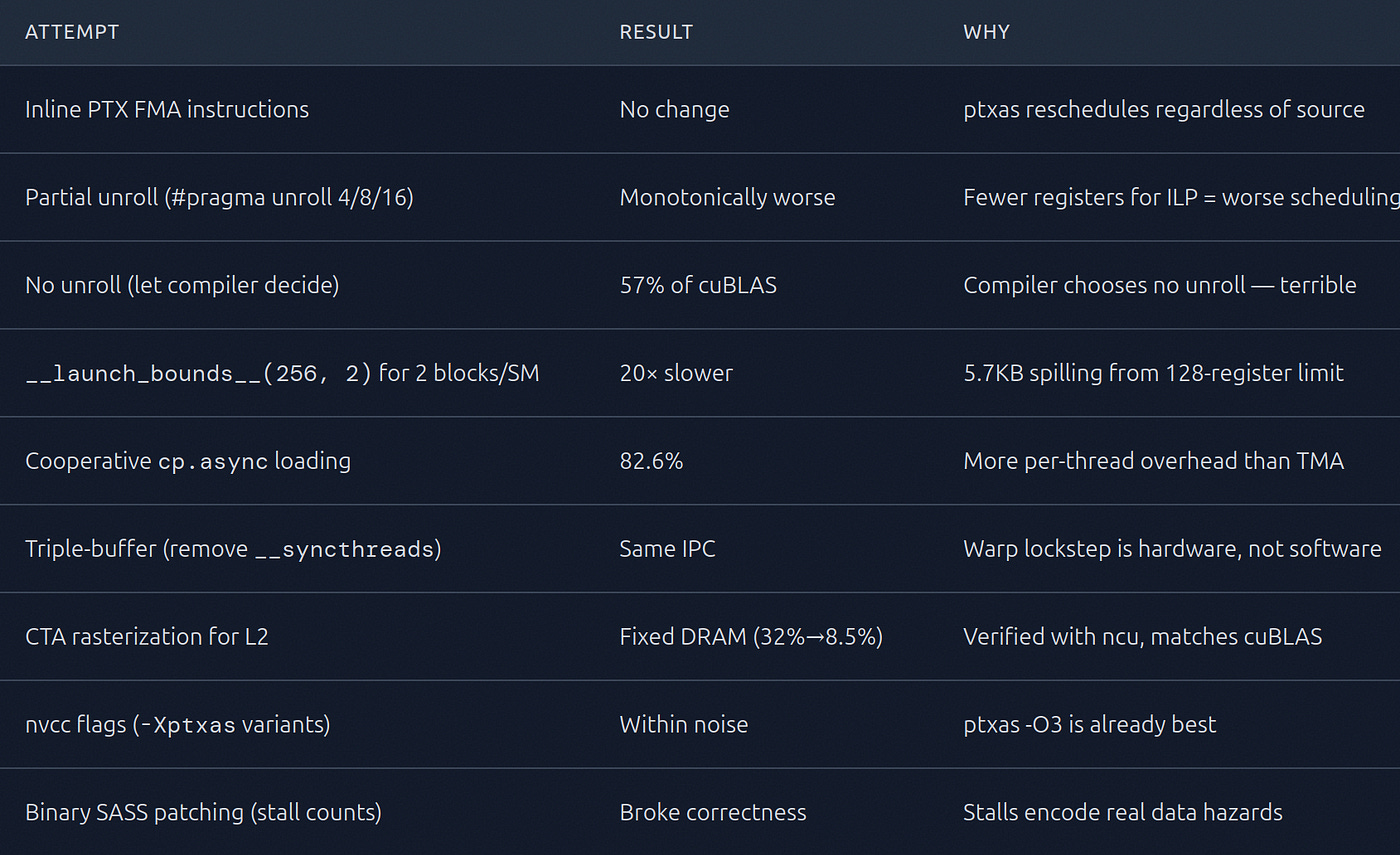
The irreducible gap lies in ptxas’s instruction-scheduling heuristics — specifically, in how it distributes LDS instructions across the FFMA cluster. As measured in the SASS Deep Dive section above, my generated kernel ends up with dispatch_stall = 44% versus cuBLAS’s 22%, because my LDS pattern is spread evenly through the FFMA cluster (median spacing 5 FFMAs) while cuBLAS’s CUTLASS template clusters them into back-to-back groups (median spacing 0).
The mainstream compute path on modern GPUs is FP16/BF16, possibly with FP32 accumulators for training. That’s where NVIDIA puts the optimization effort. Pure FP32 SGEMM is no longer the priority — even though it remains important for scientific computing, numerical simulation, and other use cases that cannot tolerate reduced precision.
I confirmed that the FP16 path on the 5090 is tensor-core accelerated: an ncu profile of cublasHgemm and cublasGemmEx at 4096×4096 dispatches cutlass_80_tensorop_h16816gemm_... and cutlass_80_tensorop_f16_s16816gemm_... respectively — both tensorop (HMMA 16×8×16), with the SIMT FFMA pipe sitting at <0.2% utilization. So the FP16/BF16 effort is real and visible. The catch: those kernels are also cutlass_80_*-prefixed Ampere forward-ports — Blackwell’s incremental tensor-core tuning effort goes into the new low-precision formats (FP8, MXFP4) used by frontier-model training, not into the basic FP16 path. The Ampere kernel reuse on sm_120 isn’t unique to the unloved FP32 SIMT path; it’s the dominant pattern across most of cuBLAS’s compute paths on Blackwell.
All measurements: 30 iterations (single) or 20 iterations (batched), interleaved with cuBLAS for thermal fairness; the first iteration of every loop is discarded as warmup; median reported. Compiled with nvcc -O3 --fmad=true (no --use_fast_math — FFMA fusion is preserved, but FTZ/relaxed-div are off, so the comparison is IEEE-clean FP32. RTX 5090 (170 SMs, 32 GB GDDR7), driver 595.58.03, CUDA 13.2.51, cuBLAS 13.3.0. The reproducible recipe is in recipes/sgemm_cublas_vs_tma/ — deplodock bench recipes/sgemm_cublas_vs_tma --local.
The 256/512 sizes are removed from the single-matmul table. At sub-millisecond per-call durations, the GPU’s boost clock never engages, and the SM clock bounces around for the duration of the run. The bench runner samples nvidia-smi --query-gpu=clocks.sm around each measurement; one full single-batch sweep looks like:
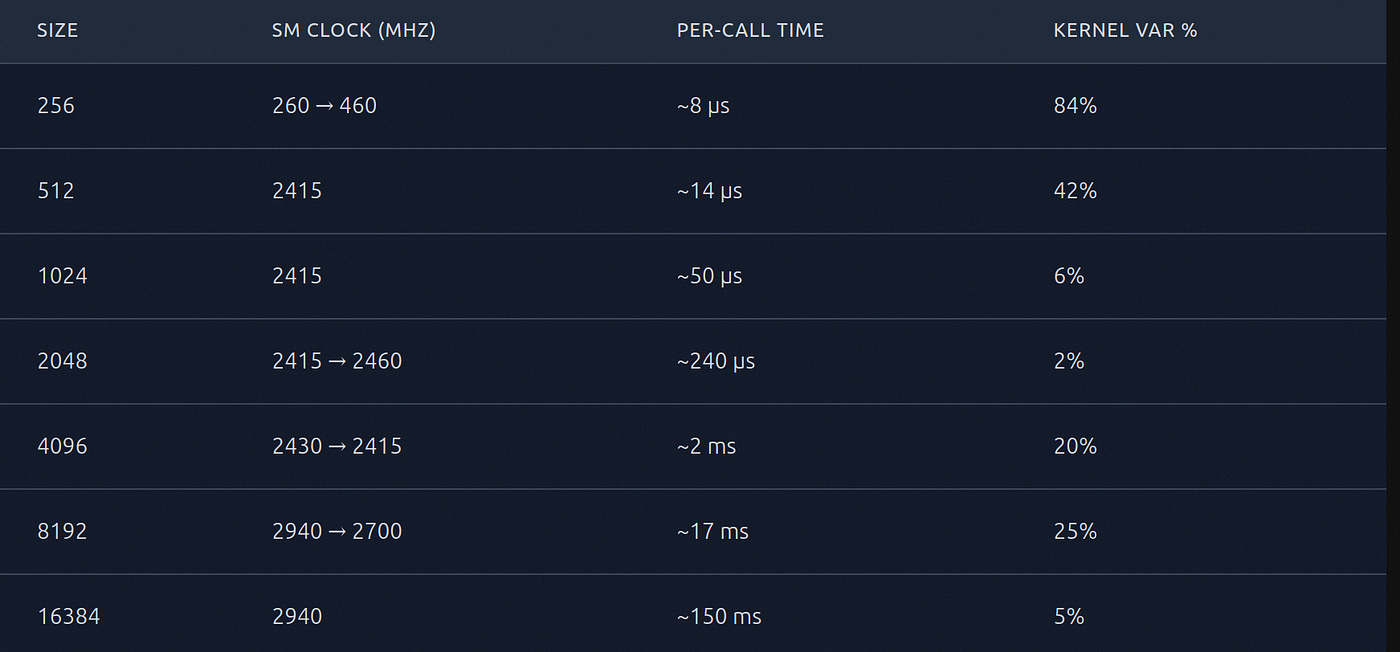
The clock is not locked to emulate real-world performance. Since my kernel and cuBLAS are interleaved iteration-by-iteration, the ratio stays meaningful at whatever clock the governor picks at that instant.
The headline tables at the top of this article show the full RTX 5090 sweep; the rest of this section covers other hardware.
Same architecture as the 5090 (sm_120), but 188 SMs vs 170, and a lower power budget. Provisioned on CloudRift with the same toolchain (driver 595.58.03 / CUDA 13.2.51), so the comparison is apples-to-apples.
Pro 6000 single matmul:
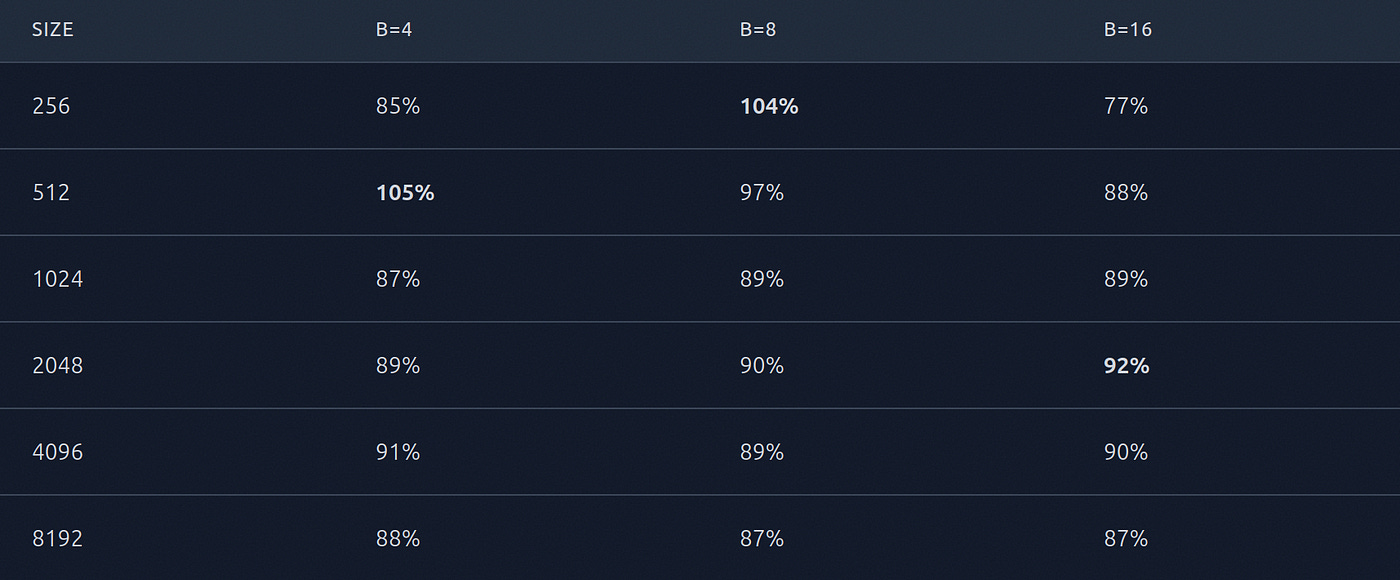
Pro 6000 batched matmul — note that B=4/8/16 land at ~93–95% (not 150–170% like the 5090) because the Pro 6000 dispatcher actually escalates correctly:
The 512/1024/2048 cells, where I still beat cuBLAS, are the Pro 6000’s small-size MAGMA fallback bug from the dispatcher table. The 4K+ cells are the constant 5–7% generator gap.
TM=8 is optimal at every size on Hopper — larger thread tiles regress, likely because the first-gen Hopper TMA has more issue pressure than Blackwell’s refined unit. The H200 is the cleanest control case: when cuBLAS dispatches the right kernel (and on Hopper it always does — see the dispatcher table), my generator loses by the same constant 8–11% as everywhere else.
H200 single matmul:
H200 batched matmul:
cuBLAS on Hopper hits ~50 TFLOPS across the size range (the H200’s HBM3e bandwidth easily feeds the SIMT cores), with FMA pipe utilization climbing from 69% at 512 to 82% at 4K+. My TMA template hits ~47 TFLOPS at 71% FMA pipe util across the range — uniform 8–11% gap to the well-dispatched cuBLAS baseline.
After finding all of this, I went looking for prior reports of cuBLAS picking suboptimal kernels for SGEMM on consumer NVIDIA GPUs. It turns out this isn’t a new bug type. Substantially similar reports have surfaced at least twice before, both times reported on NVIDIA’s developer forums and acknowledged by NVIDIA engineers.
Pascal card is calling Maxwell kernels through cublas. It is unusably slow. (NVIDIA Developer Forums, 2018) — closest match. A user with a GTX 1080 Ti (Pascal sm_61) reported cublasSgemmStridedBatched running maxwell_sgemm_128_64_nn kernels, about 2× slower than a naïve hand-rolled kernel for batched workloads.
cuBLAS sgemm is slow (NVIDIA Developer Forums, 2017). Different shape — extreme aspect ratio, 2×23880 × 23880×32 — but the same root cause: cuBLAS’s dispatcher picked a tiny grid [1,1,1] × block [8,8,1], leaving the GPU idle.
vLLM #35467 (2025). vLLM developers report that on certain matmul shapes, “cuBLAS auto-selects the 7th-best tile (128x136) instead of optimal options, with the heuristic leaving 16% performance on the table.”
Simon Boehm’s CUDA matmul worklog (cited indirectly in many places). Notes the structural fact that “cuBLAS contains not one single implementation of SGEMM, but hundreds of them, and at runtime, based on the dimensions, cuBLAS will pick which kernel to run” — and “cuBLAS may set a too small grid size, which can be identified through profiling tools.” Published acknowledgment that the heuristic has known holes.
The headline TMA win on the 5090 turned out to be a cuBLAS dispatcher bug, not a hardware advantage — and, as the Related bug reports section above shows, it’s the latest instance of a recurring pattern that NVIDIA has acknowledged on its own developer forums since at least 2018. NVIDIA ships a release version of cuBLAS that, on the most popular consumer Blackwell SKU, selects an FP32 SGEMM kernel that runs at ~40% of peak FMA pipe utilization across the entire range of batched workloads. The exact same library binary escalates correctly to a 73% kernel on the RTX PRO 6000 and to an 82% kernel on the H200. It’s not subtle: the 5090 path picks the wrong kernel 100% of the time across the entire 32× workload range I measured, and the same library has better kernels sitting right there.
I only verified this on the RTX 5090. The dispatch logic is clearly arch-specific, so it would not surprise me if other consumer RTX cards (5070, 5080, 4090, …) hit similar bugs in their respective dispatch paths. If you have one of those cards, the diagnostic script that surfaced lives in the repo at scripts/diagnostics/ncu_compare.sh. Three minutes of ncu will tell you whether your batched FP32 workloads are leaving 60% on the floor.
Don’t blindly trust cuBLAS on new architectures and/or RTX cards. Check the kernel name in ncu. If you see something like cutlass_80_simt_sgemm_128x32_8x5 running for a workload that should clearly be on a 256×128 kernel, you’re hitting the bug.
Separately, the TMA + compile-time specialization technique is worth knowing for its own sake. It produces a fully pipelined SGEMM kernel template in ~300 lines of generated C that hits ~93% of CUTLASS’s hand-tuned peak FMA pipe utilization on every Blackwell SKU I tested. TMA might be useful in many other workloads that leverage conventional CUDA cores.
Source code: deplodock/compiler/cuda/ — the compiler that generates the kernels
Benchmark script: scripts/bench_matmul.py — run your own benchmarks
Reproducible recipe: recipes/sgemm_cublas_vs_tma/ —
deplodock bench recipes/sgemm_cublas_vs_tma --localFull per-arch dispatch sweep with raw ncu output: recipes/sgemm_cublas_vs_tma/ncu/batched_dispatch_finding.md
Diagnostic scripts: scripts/diagnostics/ —
dump_cublas_kernels.sh,ncu_compare.sh,cublas_loop_vs_strided.cu,sass_analysis.pyHardware: RTX 5090 (GB202, sm_120, 32 GB GDDR7, 170 SMs); RTX PRO 6000 Blackwell Max-Q (sm_120, 188 SMs); NVIDIA H200 (GH100, sm_90, 141 GB HBM3e)
Software: CUDA 13.2.51, nvcc, cuBLAS 13.3.0, Ubuntu 24.04
NVIDIA CUDA Programming Guide — Tensor Memory Access (TMA)
NVIDIA CUDA Programming Guide — Asynchronous Data Copies
NVIDIA CUTLASS — SIMT SGEMM reference
Simon Boehm — How to Optimize a CUDA Matmul Kernel for cuBLAS-like Performance
Lei Mao — CUDA Shared Memory Swizzling
Colfax Research — Efficient GEMM with Pipelining