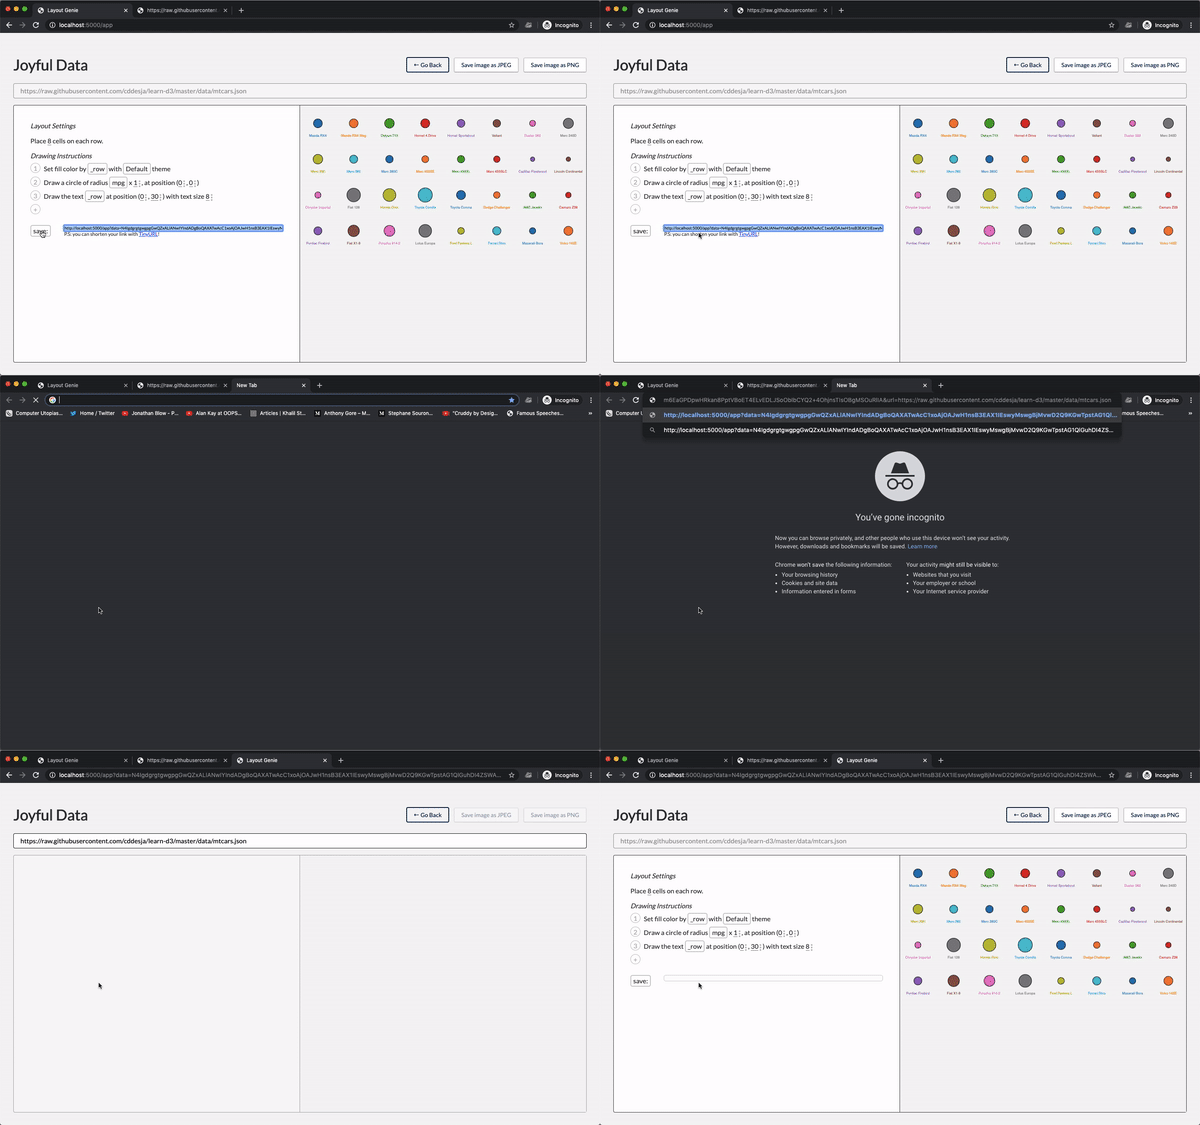
Joyful Data is a tool for making beautiful data-driven graphics. Bring your own datasets, design custom visuals in a live, interactive editor and save & share for fun, profit and universal glory. Joyful Data is built with Joy.js, a wonderful library by Nicky Case.
Bring your own dataset
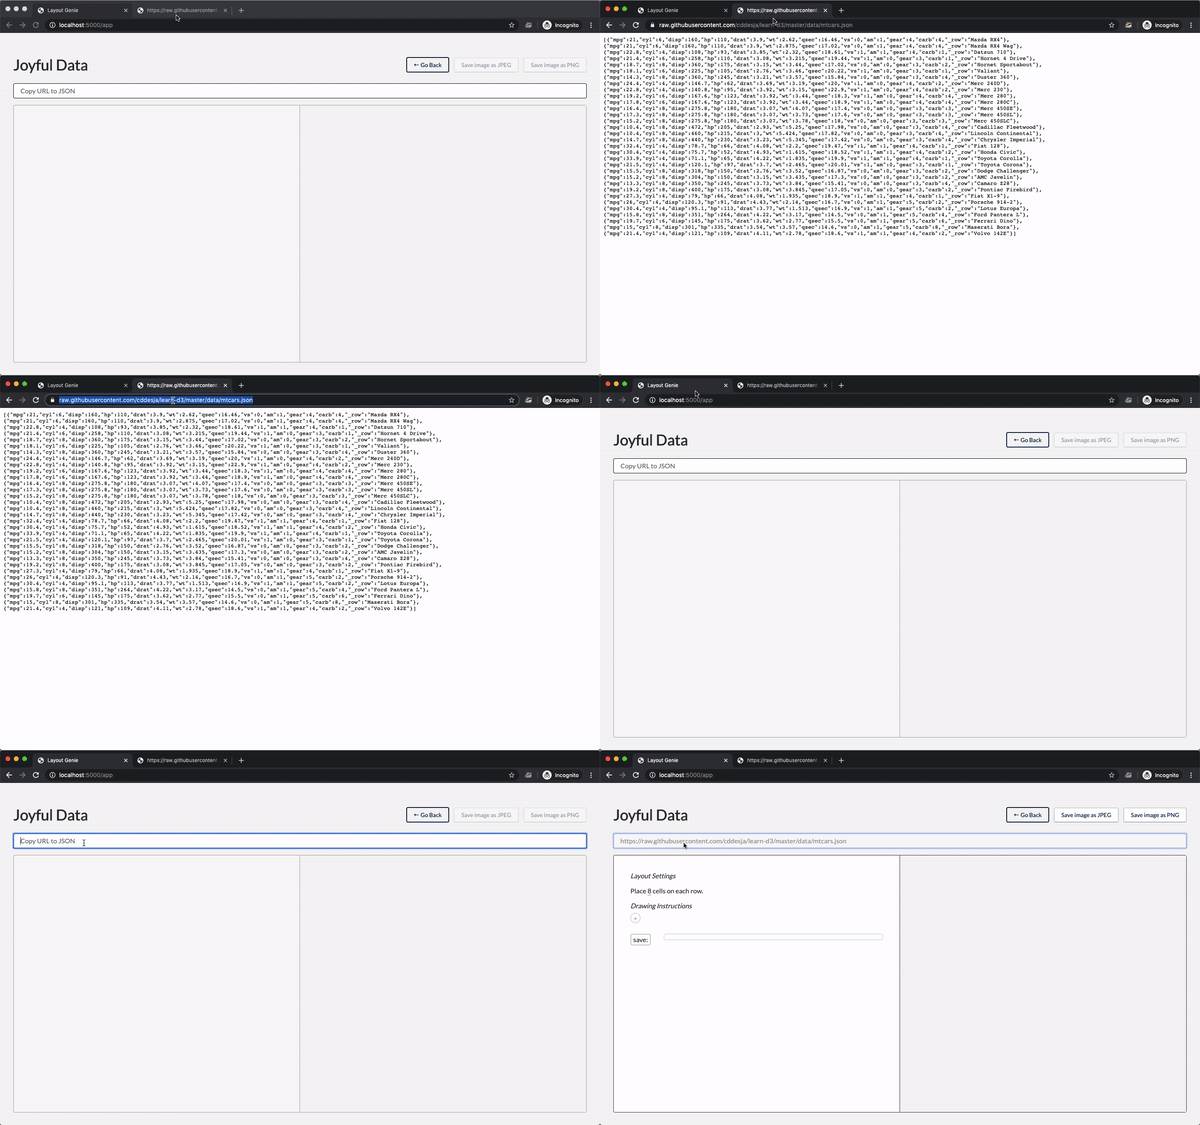
Start with own dataset. Import from anywhere — a GitHub gist, or anywhere there are free roaming JSONs.
Create beautiful data graphics
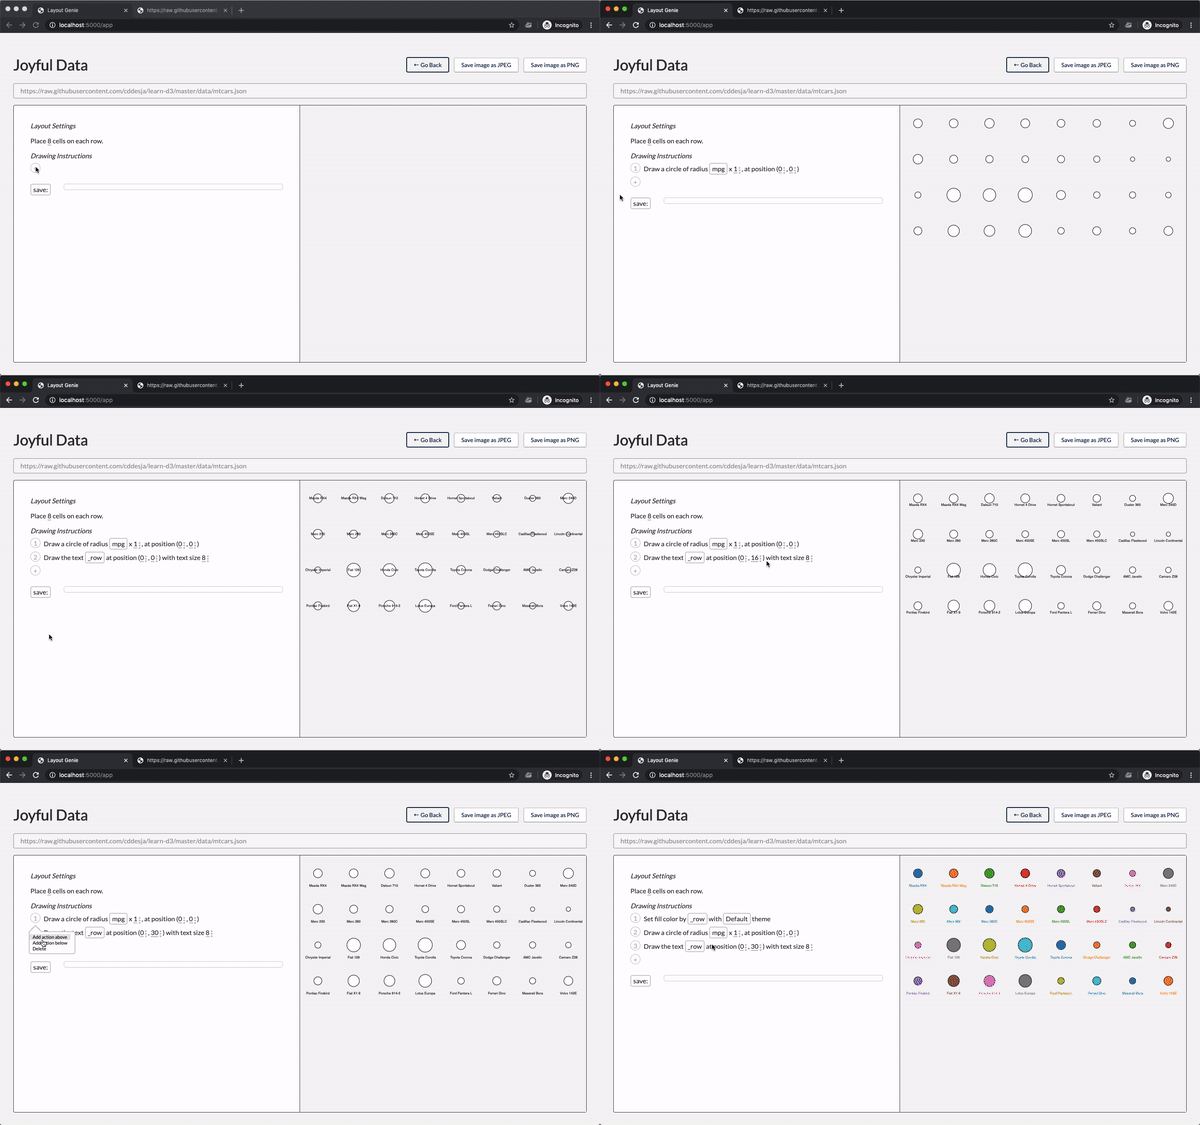
Now for the fun part! Use the live, interactive editor to build custom data graphics. Change anything: shapes, colors, transforms. No coding mojo necessary.
Save & share
Download your work as an image or save a link to share over the interwebs.