I spent eight years at Klaviyo during its hypergrowth phase, working on the data-heavy distributed systems that powered the business from $16M in ARR to a unicorn to IPO. Along the way, I watched the same cycle play out across multiple systems: they outgrow their design, context gets lost, and eventually, rising costs and/or instability force a rethink. What follows is the process we used to get visibility into our analytical systems and replace the core metric reporting system with one costing an order of magnitude less.
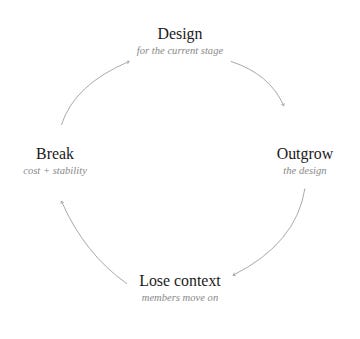
It starts the second the new system is shipped and slowly snowballs over months and years as new use cases come in and traffic ramps up. As the system starts to strain, the team pulls the lever of least resistance: vertically scaling the instance or adding more disk. When you hit the per-instance limits, you start to partition data across instances.
The system stays up, the users don’t notice yet, and the spend feels justified because revenue is growing in line with the bill.
Over time, the person who drove the original design moves on to the next problem. Someone inherits the system as a growth opportunity, but they inherit the operations, not the context.
As new teams form and responsibilities get more defined, each team starts to reason through what’s possible within their new boundaries. This is Conway’s Law (systems tend to mirror the org structure that builds them) playing out in real time, and in doing so, the org solidifies around the needs of existing systems rather than the needs of users. Underneath, each team is solving its own scaling problems within its own boundaries, leading to redundant systems.
At Klaviyo, this is where we were in 2020.
Our core analytics system for reporting and dashboards was running on an expensive Flink and Cassandra cluster. The system alone cost $1.2 million/month during peak scale. It had been doubling year over year as we kept pulling the same levers (vertically scaling, adding disk). It also failed daily, and Flink state had ballooned to the point that restarts took hours, leaving it unable to ingest data for hours every time it went down.
It’s hard to step back from a system that’s actively on fire, but leadership pushed us to do so. This forced the team to focus beyond fixing Cassandra and start asking what the business actually needs from analytics. Those are fundamentally different questions, and they lead to fundamentally different answers.
That reframing produced a repeatable process we used to design new systems and reimagine existing ones.
We didn’t start with the database. We started with every caller in the org who touched analytical data.
1. Map all queries back to where they’re used in the application. The goal is a fundamental understanding not of the technical pieces but of how the business is leveraging the source data today.
2. Assign each caller a “job.” Borrowing from jobs-to-be-done thinking (what is the user actually trying to accomplish, not just what action they are taking), this is not what the query is asking for, but what the data is being used for within the caller. Over time, callers drift and force their experience to fit the old interface, so what looks like one query might actually be a job performed by multiple queries joined in memory or in the UI. For example, one caller was generating a report by making N+1 individual queries to Cassandra, one per metric_id. The actual job was “generate a report for a set of metrics,” but the old schema only supported single-key lookups, so individual query frequency looked much higher than what we needed to support.
3. Collect job metrics for each caller. Latency and frequency. The goal is to understand how often these jobs are executed and how long they take to complete.
4. Collect data characteristics for each caller. Freshness and completeness. The goal is to understand how up-to-date the data needs to be and how much data is required to complete the jobs.
5. Understand the existing data footprint. This shifts focus from the callers to the data at rest. How much data is on disk, what are its growth rates, and how is the data skewed?
6. Collect forward-looking jobs from team roadmaps. The new system shouldn’t just do what today’s system does more efficiently; it should also take into account the org’s direction (it is important to draw a line, though, so you don’t get stuck designing for all possible futures).
Here’s what the output of this process looked like for a subset of our analytical callers. The focus is on orders of magnitude, not precise numbers. The difference between 10s of times/s and 100s of times/s matters; the difference between 10 times/s and 12 times/s doesn’t.
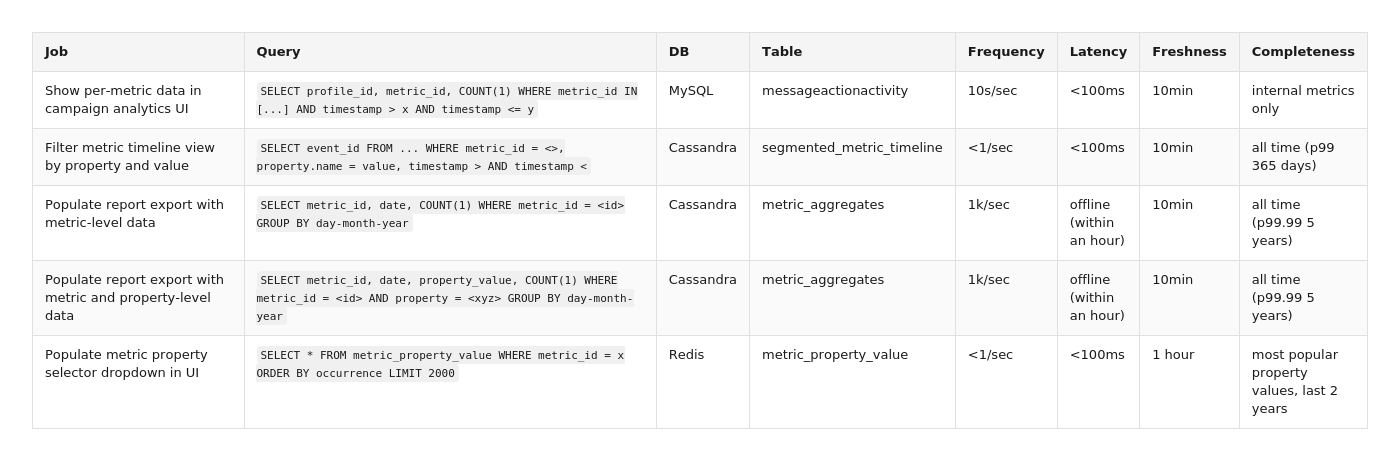
Five jobs covering four datastores with four tables, all operating on metric data scoped by time. The overlap becomes a lot clearer once you see the queries laid out side by side.
Once we mapped every caller and every job across the entire analytical surface, we could see that four distinct datastores, each added for bespoke reasons over time, were all operating on views of the same underlying data and serving overlapping jobs.
The fix wasn’t about scaling those existing datastores (yet again); it was about reimagining the underlying data model to better serve the jobs to be done. The jobs we were focused on all required time-scoped aggregations over metric data with property-level granularity, which pointed towards a columnar storage engine optimized for property access. Ultimately, after going through the design process, we were able to collapse four core systems into a single system.
The cloud spend across the four core systems was on pace for ~$18M/year. The replacement system cost ~$1.2M/year.
Overall, the process isn’t complicated. The hard part is that growth narrows ownership, and by the time the cost shows up, the people who drew those boundaries have moved on to other problems. The remaining team optimizes within the constraints they inherited, builds operational proficiency around the existing system, and becomes attached to its nuances because they are known. This is why someone has to step outside the boundaries and look across the broader surface.
If you’re staring at a system like this, or you’ve just vertically scaled your Postgres database for the third time in 2 years, I’d love to compare notes, especially if you’re managing the team that inherited the system. Send me a message on LinkedIn.
The migration itself is a story for another post. If you want to learn more about the design patterns and JSON partitioning approach behind the ClickHouse architecture, Anton Rodionov covers it in his sharded and materialized views note. His Substack covers his general design process in further detail.