TL;DR: I made a Skill that reliably gets Claude to generate PDFs using LaTeX. Professional bar charts, vector graphics, proper typography. Works on mobile too: LLMs are really good at LaTeX.
Now when I ask Claude to "create a PDF of my solar production data", it produces professional bar charts comparing monthly production vs consumption, a net grid exchange chart, summary tables, seasonal analysis boxes.
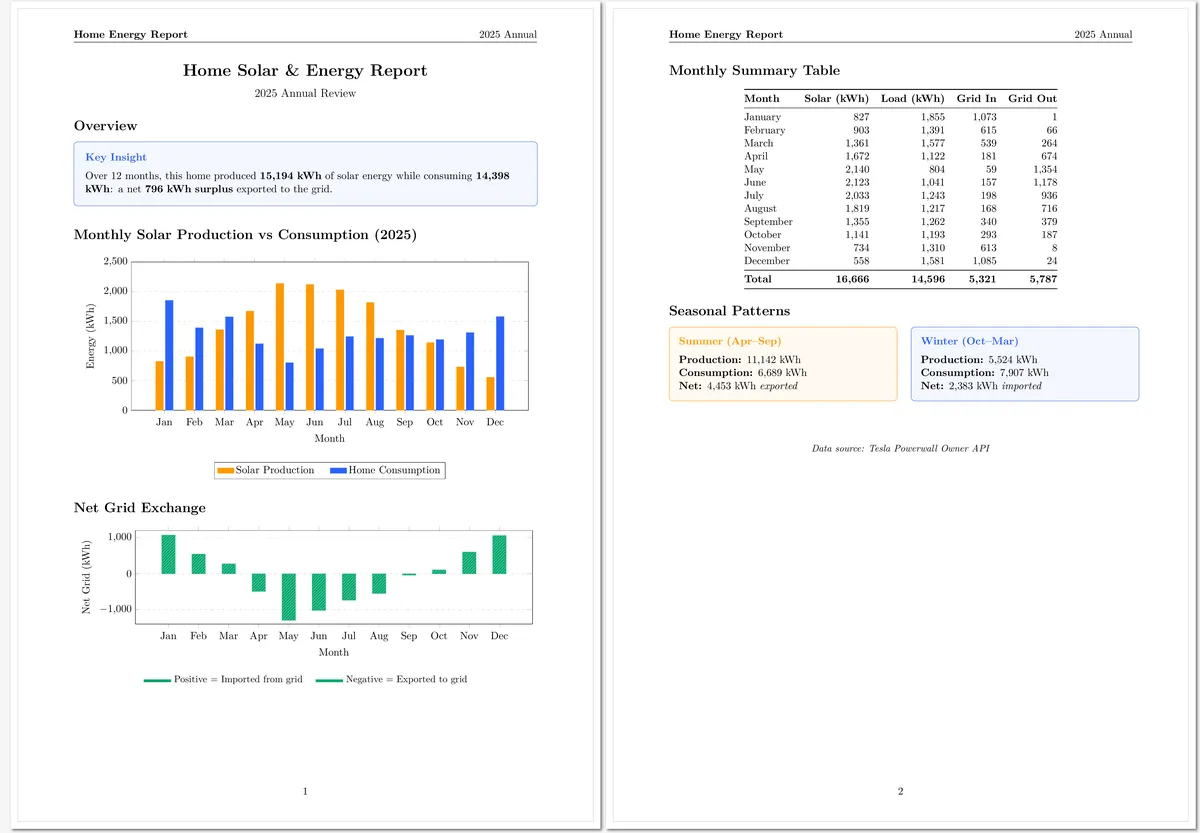
The data comes from my Tesla Powerwall, synced via the API. This all comes from one prompt. And the skill even works on Claude Code mobile: I've generated reports while waiting in line.
What I tried first
HTML-to-PDF tools exist, but the typography and layout never felt right to me. Image generation works for simple things but doesn't scale.
LaTeX turned out to be the answer. The typography just looks right (there's a reason academic papers use it), TikZ diagrams scale perfectly as vectors, and the .tex file is plain text so I can version control it and regenerate with new data. The surprise was that Claude writes clean LaTeX without much guidance: add some patterns and examples, and the output is professional.
The skill file
I created a markdown file that teaches Claude the patterns. When I ask for a PDF, Claude reads it, pulls data, writes the .tex file, and compiles with tectonic. About 30 seconds.
Here's a condensed version:
Skill Markdown:
# LaTeX PDF Generation

Generate professional PDFs with diagrams, tables, and clean typography using LaTeX compiled with tectonic.

## Workflow

1. Create `.tex` file in appropriate location
2. Ensure tectonic is installed:
   ```bash
   which tectonic || (curl -fsSL https://github.com/tectonic-typesetting/tectonic/releases/download/tectonic%400.15.0/tectonic-0.15.0-x86_64-unknown-linux-gnu.tar.gz | sudo tar -xzf - -C /usr/local/bin/)
   ```
3. Compile: `tectonic filename.tex`

Tectonic auto-downloads packages and handles multiple passes. No cleanup needed.

## Document Template

```latex
\documentclass[11pt, a4paper]{article}

\usepackage[utf8]{inputenc}
\usepackage[T1]{fontenc}
\usepackage{geometry}
\usepackage{tikz}
\usepackage{pgfplots}
\usepackage{booktabs}
\usepackage{xcolor}

\usetikzlibrary{shapes.geometric, arrows.meta, positioning}
\pgfplotsset{compat=1.18}
\geometry{margin=1in}

% Colors
\definecolor{primaryblue}{RGB}{41, 98, 255}
\definecolor{secondarygreen}{RGB}{0, 168, 107}
\definecolor{accentorange}{RGB}{255, 152, 0}

\begin{document}
% Content here
\end{document}
```

## TikZ Patterns

### Architecture Diagram
```latex
\begin{tikzpicture}[
    box/.style={rectangle, rounded corners, minimum width=3cm,
                minimum height=1cm, draw=black!70, fill=#1!20},
    arrow/.style={-{Stealth[length=2mm]}, thick}
]
\node[box=primaryblue] (a) {Component A};
\node[box=secondarygreen, below=of a] (b) {Component B};
\draw[arrow] (a) -- (b);
\end{tikzpicture}
```

### Data Charts
```latex
\begin{axis}[
    ybar, bar width=8pt,
    xlabel={Month}, ylabel={kWh},
    legend style={at={(0.5,-0.2)}, anchor=north}
]
\addplot[fill=accentorange] coordinates {(1,827) (2,903) (3,1361)};
\addplot[fill=primaryblue] coordinates {(1,1855) (2,1391) (3,1577)};
\legend{Solar, Consumption}
\end{axis}
```

### Flowchart
```latex
\begin{tikzpicture}[
    process/.style={rectangle, minimum width=2.5cm, minimum height=0.8cm,
                    draw=black!70, fill=primaryblue!20},
    decision/.style={diamond, minimum width=2cm, draw=black!70,
                     fill=accentorange!30, aspect=2},
    arrow/.style={-{Stealth[length=2mm]}, thick}
]
\node[process] (start) {Start};
\node[decision, below=of start] (decide) {Valid?};
\node[process, below=of decide] (end) {End};
\draw[arrow] (start) -- (decide);
\draw[arrow] (decide) -- node[left] {Yes} (end);
\end{tikzpicture}
```

## Tables

```latex
\begin{tabular}{@{}lrrr@{}}
\toprule
\textbf{Month} & \textbf{Solar} & \textbf{Load} & \textbf{Net} \\
\midrule
January & 827 & 1,855 & 1,028 \\
February & 903 & 1,391 & 488 \\
\bottomrule
\end{tabular}
```

## Info Boxes

CRITICAL: Use `text width` not minipage for TikZ content boxes.

```latex
\begin{tikzpicture}
\node[draw=primaryblue, fill=primaryblue!5, rounded corners,
      text width=0.9\textwidth, inner sep=12pt] {
\textbf{\textcolor{primaryblue}{Key Insight}}\\[0.3cm]
Content goes here directly.
};
\end{tikzpicture}
```

## Fallback

If tectonic fails (network issues on first run):
```bash
pdflatex filename.tex && pdflatex filename.tex
rm -f *.aux *.log *.out *.toc
```

## Post-Compilation Check

```bash
# Check for overfull boxes (content too wide)
tectonic file.tex 2>&1 | grep -i "overfull"
```
Things to watch out for
I've told Claude a few things to watch out for to make the process more efficient. Most of these it learned through trial and error, but encoding it in the skill avoids having the LLM repeat the same mistakes.
Width calculations leak. Never use \textwidth-1cm directly inside a TikZ node: the subtraction syntax can literally print "-1cm" in your output. Use text width=0.9\textwidth on the node style instead.
Use tectonic, not pdflatex. Tectonic auto-downloads packages and handles multiple compilation passes, which is perfect for automation. Install with brew install tectonic on macOS or grab the binary from tectonic-typesetting.org.
Overfull hbox warnings. These mean content is too wide. Usually fixed by reducing font size (\small) or adjusting table column widths.
What else
Once it's set up, Claude can generate professional PDFs from any data: home energy reports, health summaries with charts, project timelines, architecture diagrams, meeting notes formatted for sharing.
If you're interested in using this, just ask Claude Code to read this post and implement the skill for you!