Nile P. Stephenson1,2,3, Gabriel B. Stephenson4, Shujie Chang1,2, Britta K. Fiedler5, Yarong Liu1,2,6, Ayaka U. Paul1,2,5, Euan N. Furness4
1Department of Zoology, University of Cambridge, Cambridge, UK.
2University Museum of Zoology, University of Cambridge, Cambridge, UK.
3King’s College, University of Cambridge, Cambridge, UK.
4Independent researchers. UK.
5Graduate School of Engineering and Science, University of the Ryukyus, Nishihara, Japan.
6Nanjing Institute of Geology and Palaeontology, Chinese Academy of Sciences, Nanjing, China.
Emails: nps36 (at) cam (dot) ac (dot) uk; gabriel.b.stephenson (at) gmail (dot) com; sc2535 (at) cam (dot) ac (dot) uk; brittakfiedler (at) gmail (dot) com; yl2141 (at) cam (dot) ac (dot) uk; aup24 (at) cam (dot) ac (dot) uk; enf21 (at) cam (dot) ac (dot) uk
In recent centuries, a combination of push and pull factors has caused increasing urbanisation across the globe (Godfrey & Julien, 2005). More people now live in cities than in rural areas, and a reduced connectivity with nature is thought to contribute to poorer mental health (Mantler & Logan, 2015; Ulrich et al., 1991), an increased complacence in response to climate change (Pitman et al., 2018), and has received attention within science, literature, and culture more broadly as an existential concern (Maune et al., 2026; Rangel et al., 2024). Contemporaneous with human populations’ disconnect from the natural world is the rise of novel habits and hobbies that influence our behaviour, particularly increased interactions with social media and video games (Bavelier et al., 2011; Hruska & Maresova, 2020). Social media has become a tool for assimilating knowledge and is a useful instrument for scientists and non-scientists alike to understand nature (Chowdhury et al., 2024; Stephenson et al., 2025). Similarly, media, such as television and games, has been shown to influence our understanding of the real world in a variety of ways, from contributions towards moral frameworks (Weaver & Lewis, 2012) to expanding our understanding of science and the natural world (Balmford et al., 2002; Barbas et al., 2009).
For the last 30 years, people across the globe have engaged with the fictional world of Pokémon, where players capture and train a diverse array of mysterious creatures inhabiting different environments. One major source of interaction has been via video games, where the player explores a map populated with different Pokémon of a variety of categorical types. The player is encouraged to collect all the Pokémon in a given game, and to do so must survey a variety of environments. Through this game mechanic, Pokémon shares inherent links to the study of zoology and palaeontology; scientists may survey a variety of environments to identify different animals, specimens may be catalogued or added to museum collections, and specimens may be characterised and arranged into phylogenies to understand their relatedness and/or evolutionary histories. In this sense, the role played by the player in Pokémon video games is similar to that of a pioneer naturalist.
Since Pokémon games generate a natural world which the player explores, the player may learn about our natural world through the observation of patterns shared between the virtual and the real. Patterns such as the distribution and abundance of species (McCarthy et al., 2018; Murray et al., 1999), the value of habitat heterogeneity (Tews et al., 2004), and patterns of diversity between urban and rural environments (Knapp et al., 2008) could be intuited via Pokémon, particularly where encounters with natural environments are becoming increasingly limited, provided that these patterns are present in the games. These patterns are relatively consistent in the scientific literature and are prevalent in undergraduate textbooks (Begon et al., 1996), so emulation of these patterns could help enhance the intuitive understanding of fundamental ecological principles.
To investigate whether ecological patterns in Pokémon games emulated those in the natural world, we used data from a popular Pokémon game, HeartGold/SoulSilver, to reconstruct its virtual ecology, and compare it with patterns reported in undergraduate textbooks and scientific literature. Specifically, we: (i) tested if rank-abundance distributions were similar to those in the natural world; (ii) investigated diversity patterns in relation to habitat heterogeneity and size; (iii) investigated if community composition was underpinned by habitat type; and (iv) investigated if diversity was higher in rural than urban areas.
METHODS
Pokémon games each use a variety of mechanics to enable players to encounter Pokémon. Pokémon HeartGold/SoulSilver (Generation IV; HG/SS) enables players to explore Kanto and Johto regions, with the possibility of encountering up to 493 different Pokémon through four main methods: walking in long grass or caves, surfing over water, fishing in water, and headbutting trees.
For location type, we distinguished between forests, named routes (i.e., a route that was not simply “Route X”, but was specifically named), unnamed routes, artificial encounter locations (e.g., a building), settlements, caves, and surfing routes (routes that contained no long grass and were largely water tiles). Headbutting trees is unique to HG/SS (alongside Generation II games, Gold, Silver, and Crystal) and represents the capability to “sample” a unique habitat type.
HG/SS are ideal games to sample because of this variety of Pokémon and habitat types. We did not extend our analysis beyond HG/SS to retain consistent sampling. Each location (e.g., a route or town) was considered an independent ecological setting. Since different Pokémon can be found in different “floors” of a cave (e.g., Cerulean Cave 1F vs Cerulean Cave B1F), each floor was also treated as an independent location. We did not account for pseudoreplication or spatial autocorrelation in any of our analyses. Locations considered completely artificial, such as the Safari Zone, were removed.
Abundance calculations
Ecological analyses often concentrate on abundance distributions within and between communities (Connell, 1978; Khan et al., 2024; Stephenson et al., 2024, 2026). In Pokémon games, abundance, A, can be estimated as the probability of encountering each species (here, Pokémon) multiplied by the number of tiles in the area in which they can be found,
A = p(si) * ti
where p(s) is the probability of finding a Pokémon of a given species in location i, and t is the number of tiles.
The number of tiles for each in-game location was collected from each location using code written for this purpose (https://github.com/Broll26/HGSS_Starter). Tile counts were allocated to a habitat type according to encoded differences in tile identity, which were taken to represent alternative habitats (e.g., long grass vs trees). In Pokémon games, a wide variety of tile types are encoded including doors, ice, lava, bridges, and blocked tiles. Only grass, tree, water, and free movement in caves/artificial encounter locations were included in the analyses, since these represent the majority of tiles and the viable locations to encounter Pokémon.
The probability of each Pokémon species encounter, p(s), was extracted from the “rate” column in the “Pokémon” section for each habitat type in each location on the website Bulbapedia (https://bulbapedia.bulbagarden.net/). Note the distinction between habitat type and location type: habitat type refers to the type of habitat that might be found in a given tile (grass, water), whereas location type describes the ecosystem represented by a location (i.e., a distinct collection of tiles), such as a route or a cave.
If p(s) differed across time of day, the probability was multiplied by the proportion of in-game hours for each time of day (6/24 for morning, 8/24 for afternoon, 10/24 for night). If p(s) was split across different sub-sampling methods (e.g., old rod, good rod, super rod), the probability was multiplied by 1/m where m is the total number of different methods. p(s) of version exclusive Pokémon (i.e., Pokémon only encounterable in HG or SS) was halved to enable inclusion of both. Rare encounter methods (legendary Pokémon, “swarms”) were ignored. Fishing and surfing were treated separately, assuming that these methods can encounter different Pokémon as they sample different aspects of aquatic habitat.
Rank abundance
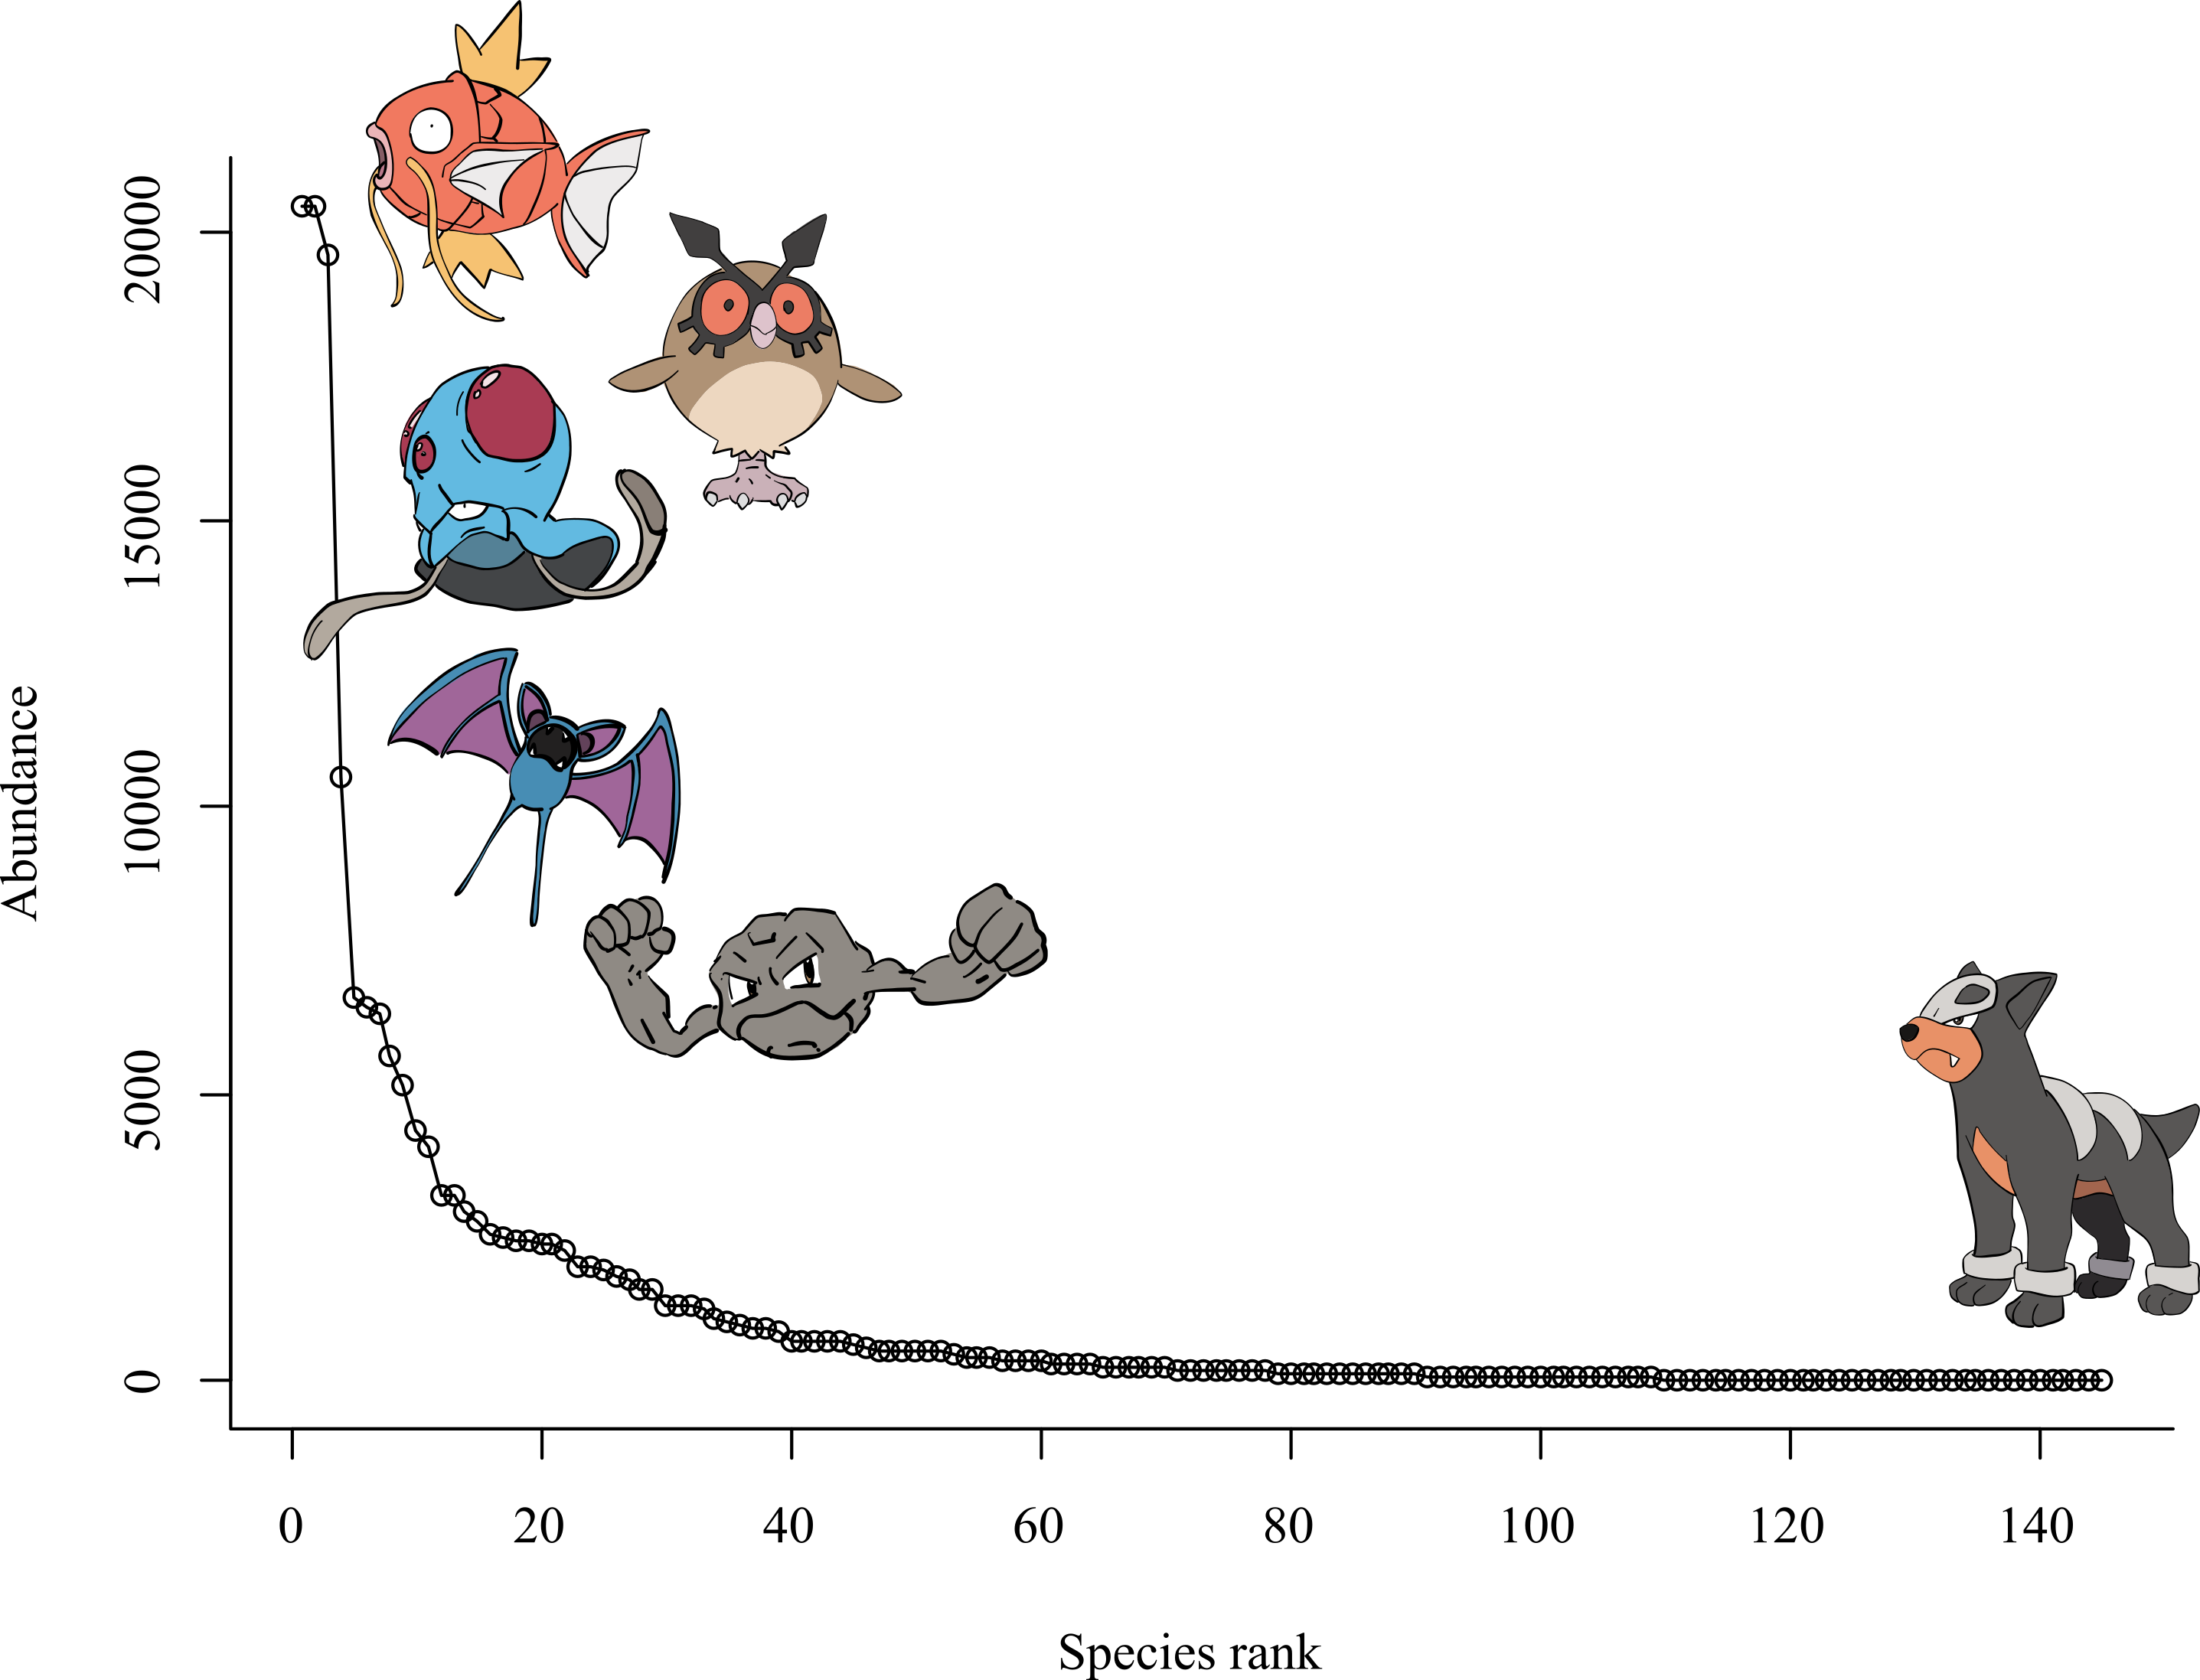
In real ecosystems, it is widely accepted that species tend to produce rank-abundance curves where a few species are common and most species are rare (Murray et al., 1999). To identify if this pattern was present in HG/SS, we plotted species rank-abundance curves across all locations.
Community composition
We used non-metric multidimensional scaling (NMDS) with a Bray-Curtis dissimilarity matrix on species abundances within sites to visualise differences in community composition (Bray & Curtis, 1957).
Habitat heterogeneity
The role of habitat heterogeneity is associated with variability in biodiversity in a variety of ecosystems (Tews et al., 2004). Simpson’s diversity index and Shannon diversity were calculated as estimates of biodiversity for each location. The role of habitat heterogeneity was assessed in two ways: (i) the presence or absence of different habitat types (e.g., water, trees) within a location, and (ii) the number of different habitat types within a location. Using linear models, we investigated whether either of these measures of heterogeneity as well as habitat size (tile count), were associated with diversity metrics across the most common location types using linear models.
Urbanisation
Urbanisation generally reduces species biodiversity (Knapp et al., 2008). We tested whether settlements (towns and cities) in HG/SS had lower diversity (Simpson’s index and Shannon diversity) than other location types using linear models.
All statistical analyses were done in R (v.4.2.1; R Core Team, 2022).
RESULTS
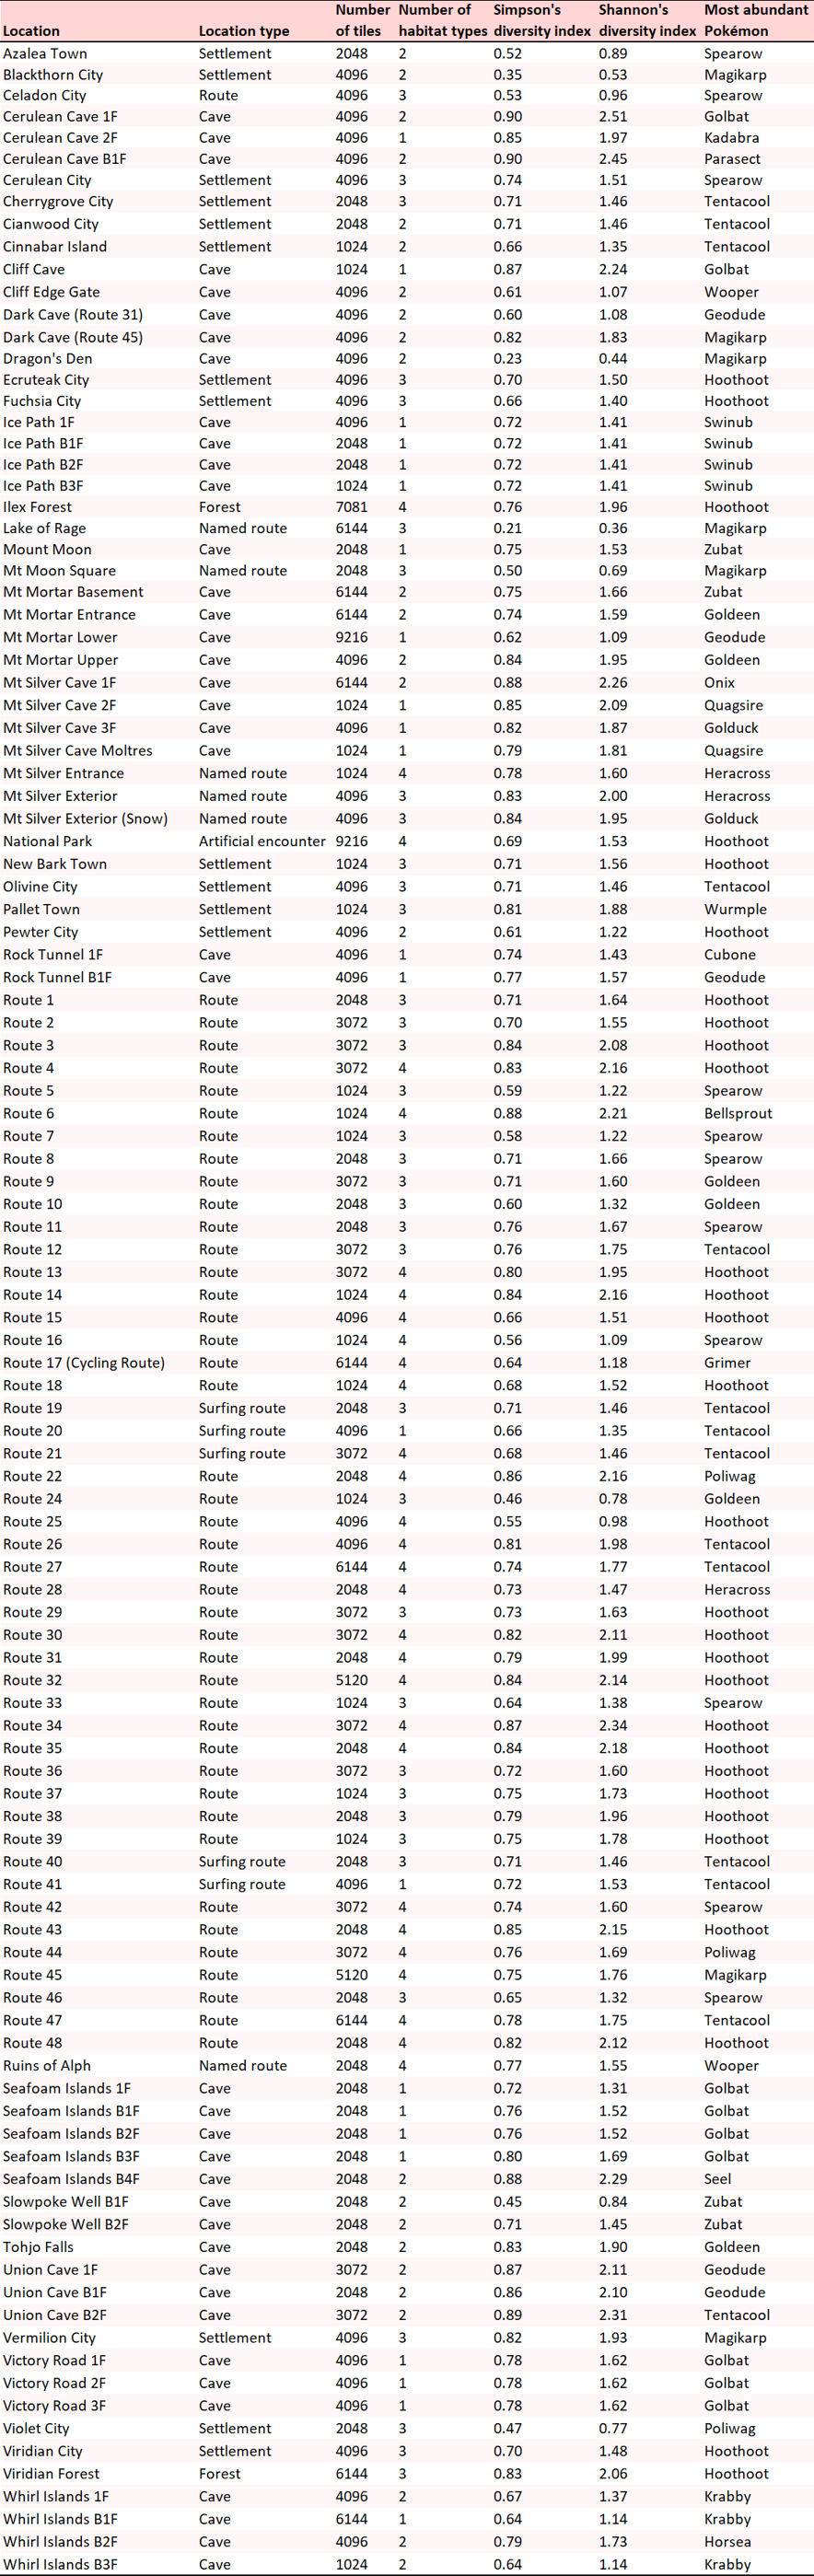
357,289 tiles across 113 locations representing seven habitat types were sampled (see Appendix). The mean number of habitat types per location was 2.63. From our estimation of abundance, Magikarp was the most abundant Pokémon in HG/SS (20,469.3), and Houndour (which was very rare and only found in in Route 7) was the rarest (1.1). Hoothoot was the most common Pokémon in the highest number of locations (29), likely owing to its occupancy of both tree and long grass habitat types across multiple locations. Routes were the most common habitat type sampled (n = 43).
Rank abundance
Based on the estimated abundance in HG/SS, the rank-abundance distribution of species was consistent with patterns observed in the ecological literature (Fig. 1).
Community composition
Community composition varied between different habitat types, with caves distinct from routes (Fig. 2; stress = 0.162 indicating fair fit to the data at k = 2). Routes and settlements overlapped, and caves and named routes overlapped. Forests did not produce a hull because there were too few points (n = 2). Diglett’s Cave was removed as an outlier from the NMDS to enable visualisation of variance between locations because it only contained Diglett or Dugtrio.

Habitat heterogeneity
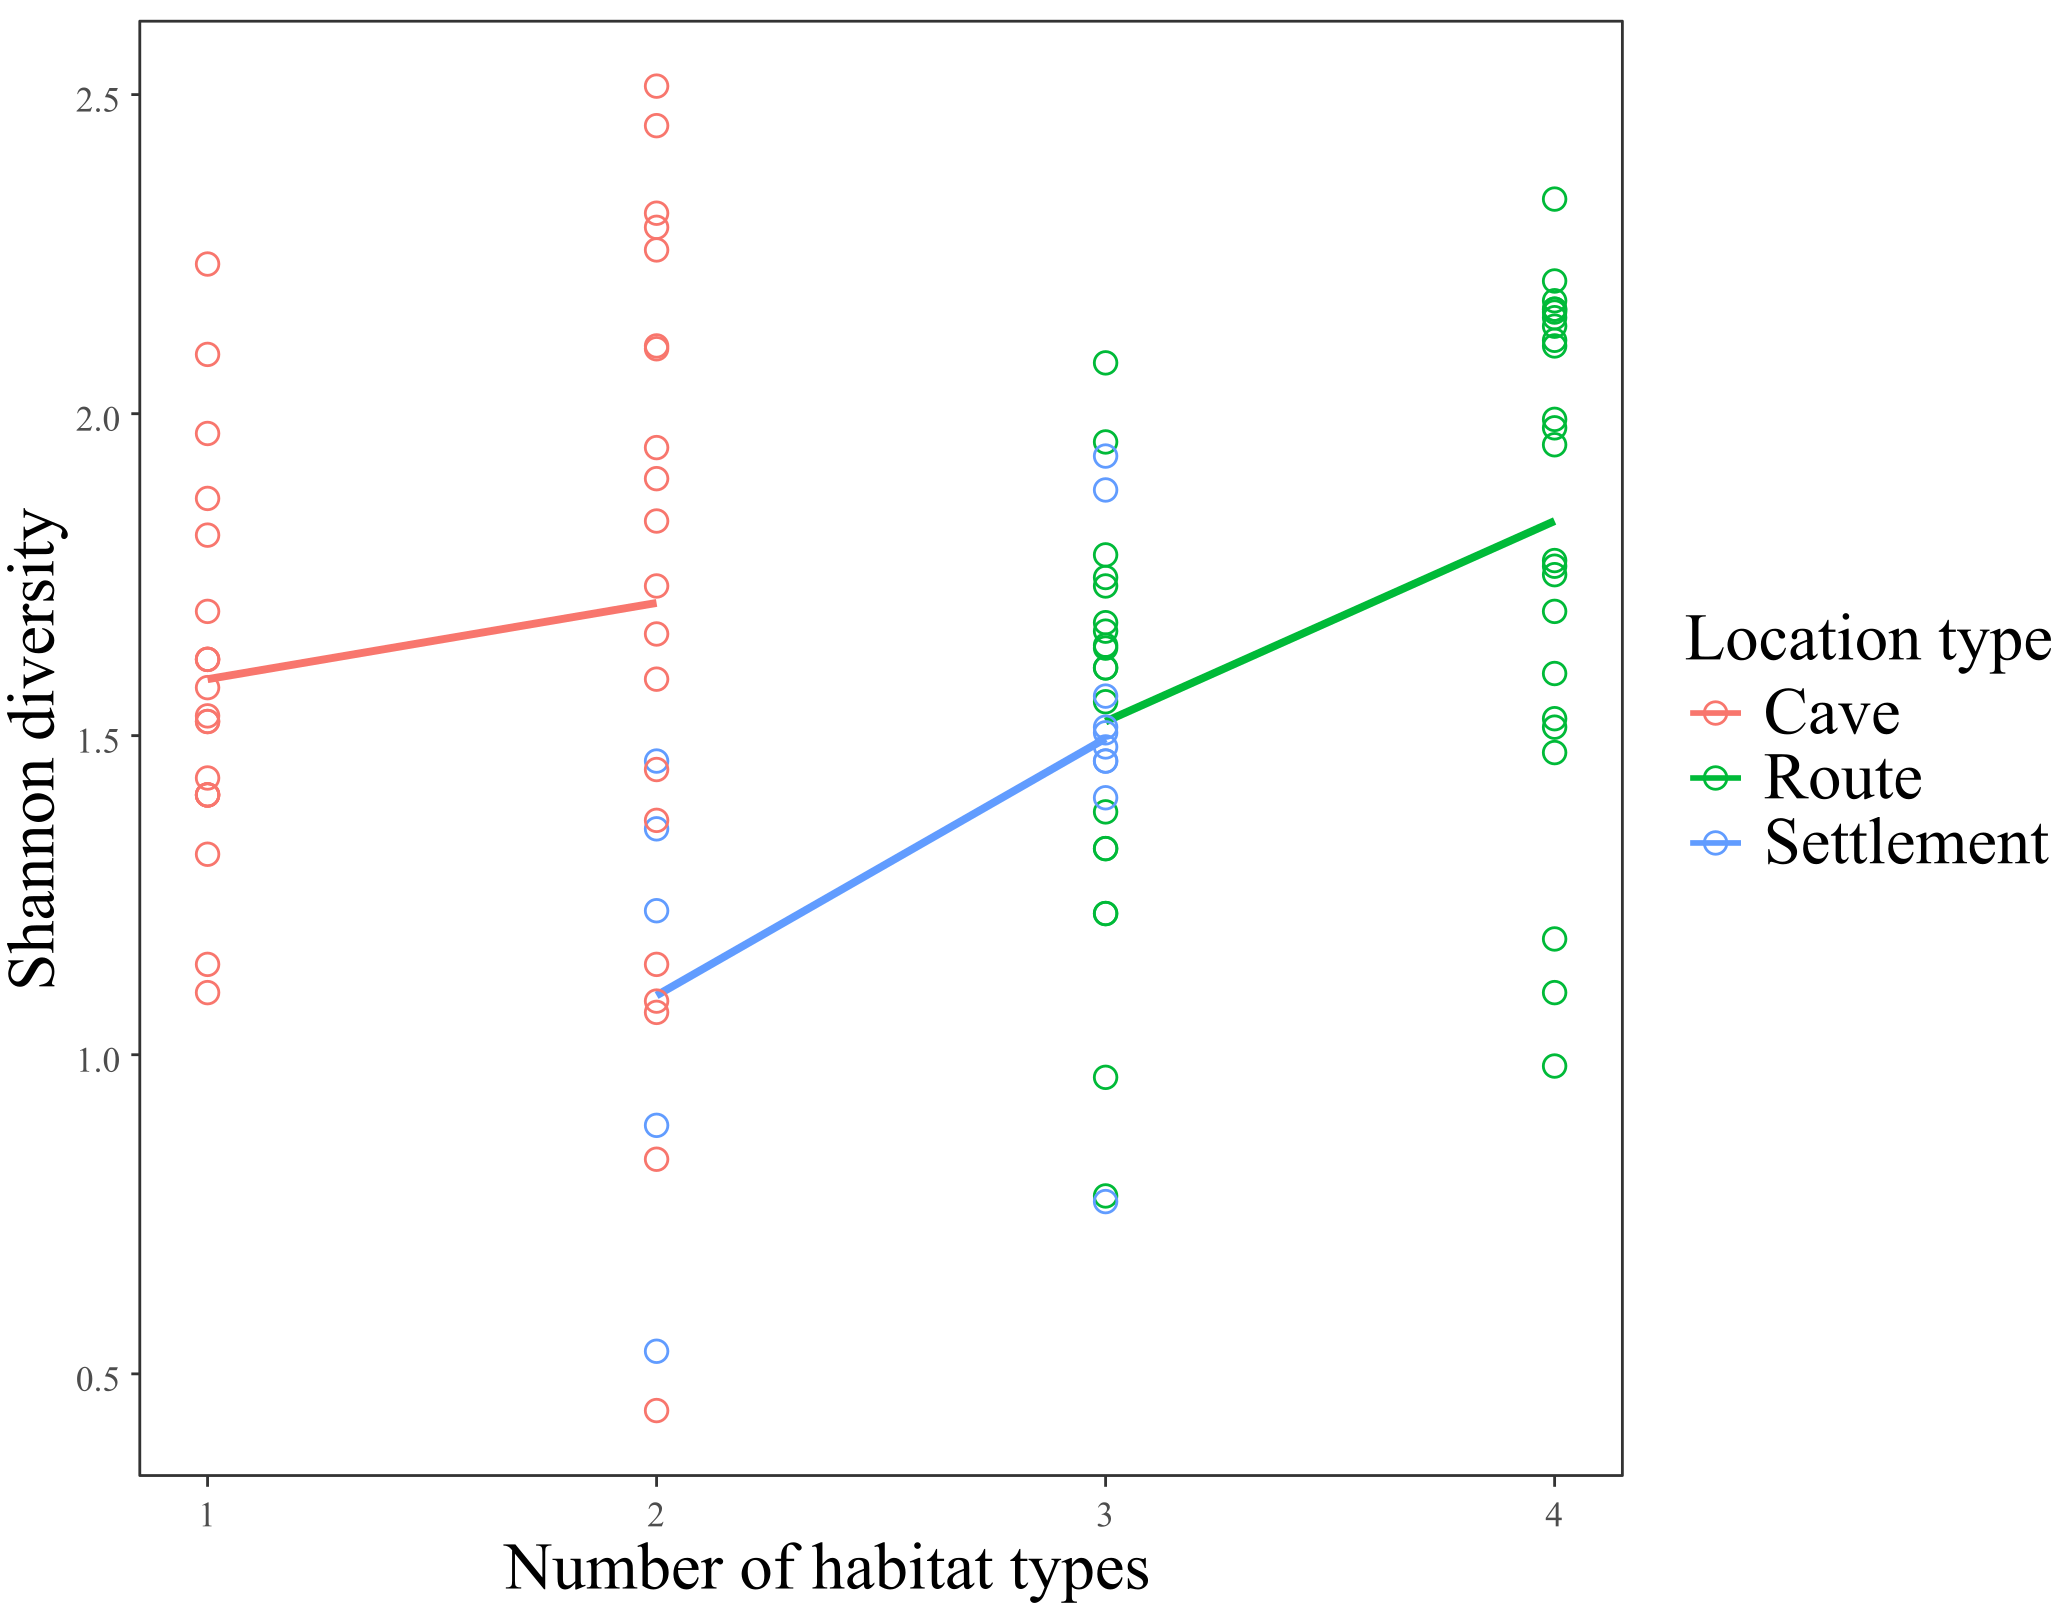
Across the most commonly sampled location types, biodiversity (Simpson and Shannon indices) increased with the number of habitat types, although the relationship was not significant (Fig. 3).
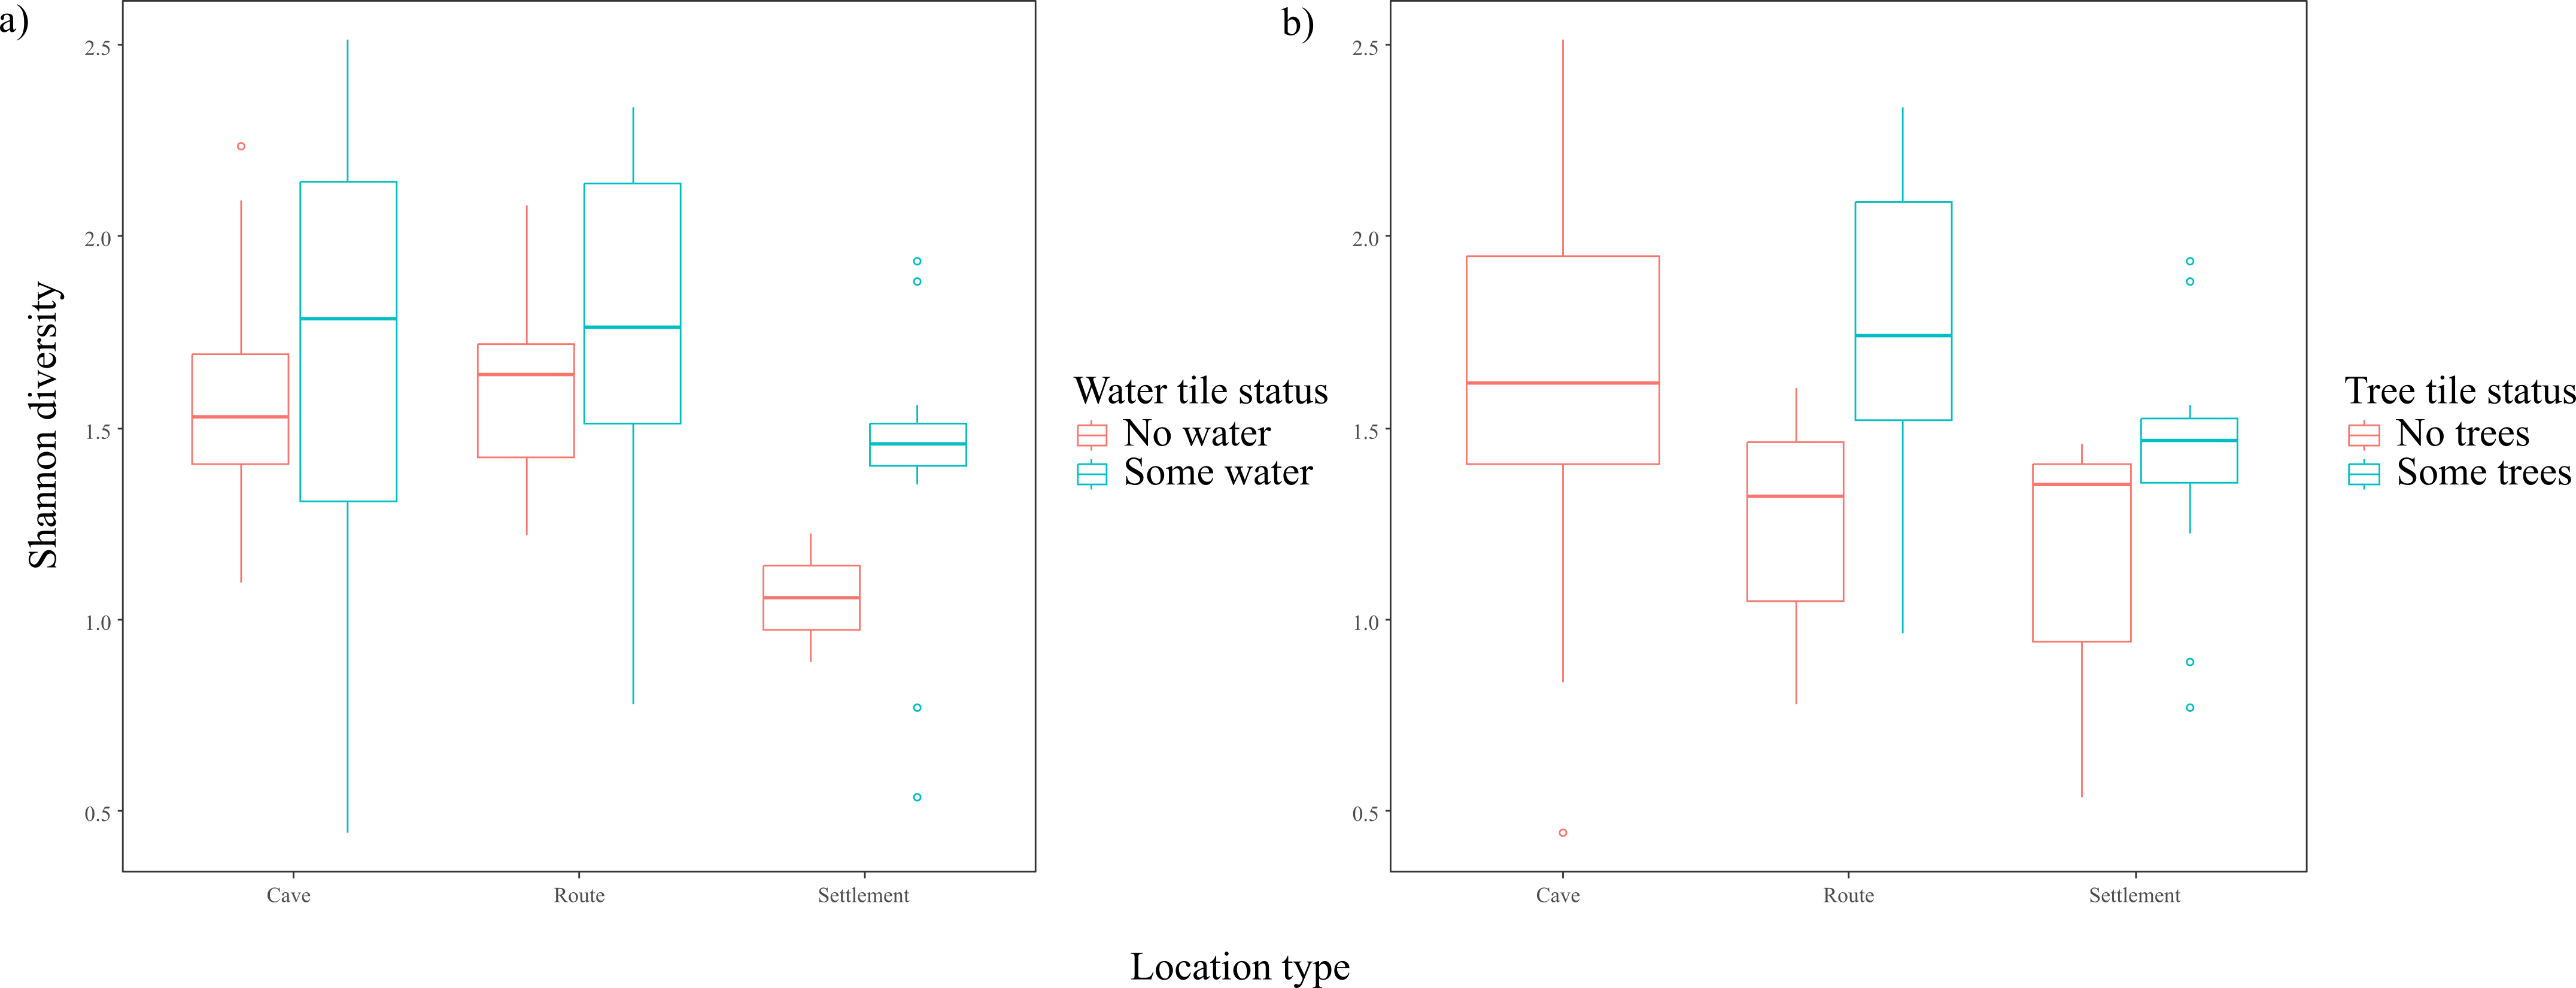
Settlements with water habitats had significantly higher Simpson and Shannon diversity than settlements lacking these habitats (Simpson: adj-R2 = 0.04, F3,95 = 2.44, p = 0.0083; Shannon: adj-R2 = 0.10, F3,95 = 3.40, p = 0.010, Fig. 4a). Likewise, settlements with trees had significantly higher diversity (Simpson: adj-R2 = 0.10, F3,95 = 4.79, p = 0.00029; Shannon: adj-R2 = 0.09, F3,95 = 4.35, p = 0.0016, Fig. 4b). In caves and routes, water habitats were also associated with high diversity, although these relationships were not statistically significant. Similarly, routes containing trees tended to have higher diversity, but the association was not significant.
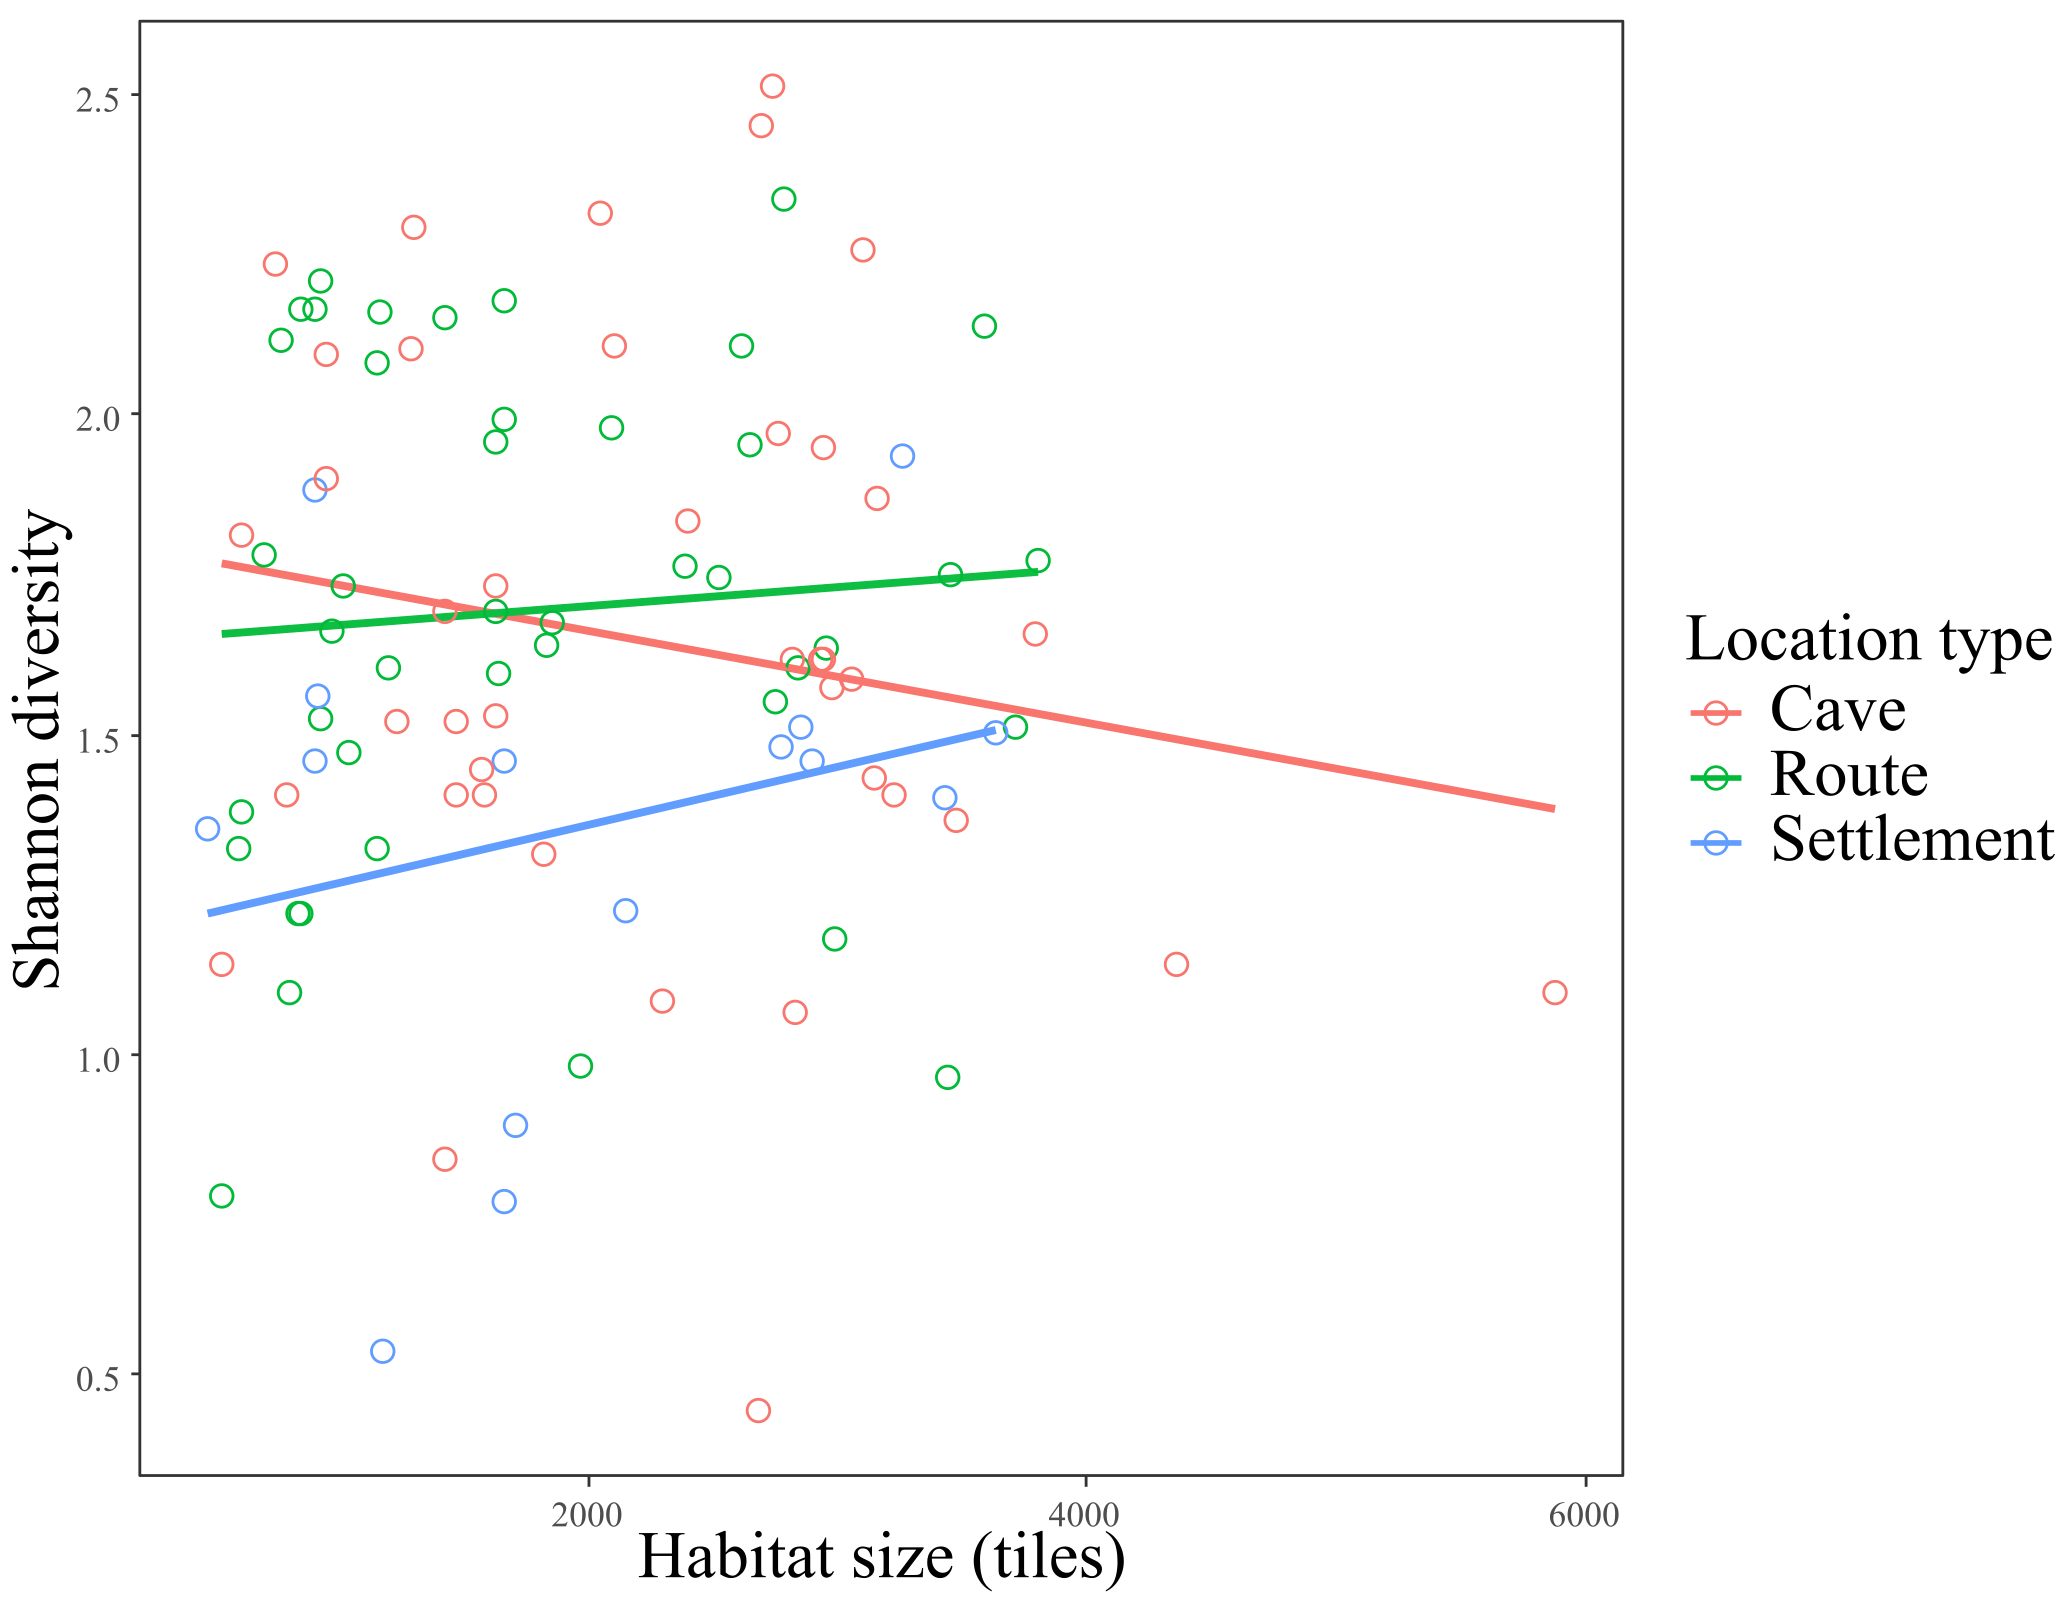
Habitat size was significantly positively correlated with diversity metrics in settlements (Simpson: adj-R2 = 0.039, F3,95 = 2.315, p = 0.010; Shannon: adj-R2 = 0.043, F3,95 = 2.47, p = 0.026), non-significantly negatively correlated in caves, and non-significantly positively correlated in routes (Fig. 5).
Urbanisation
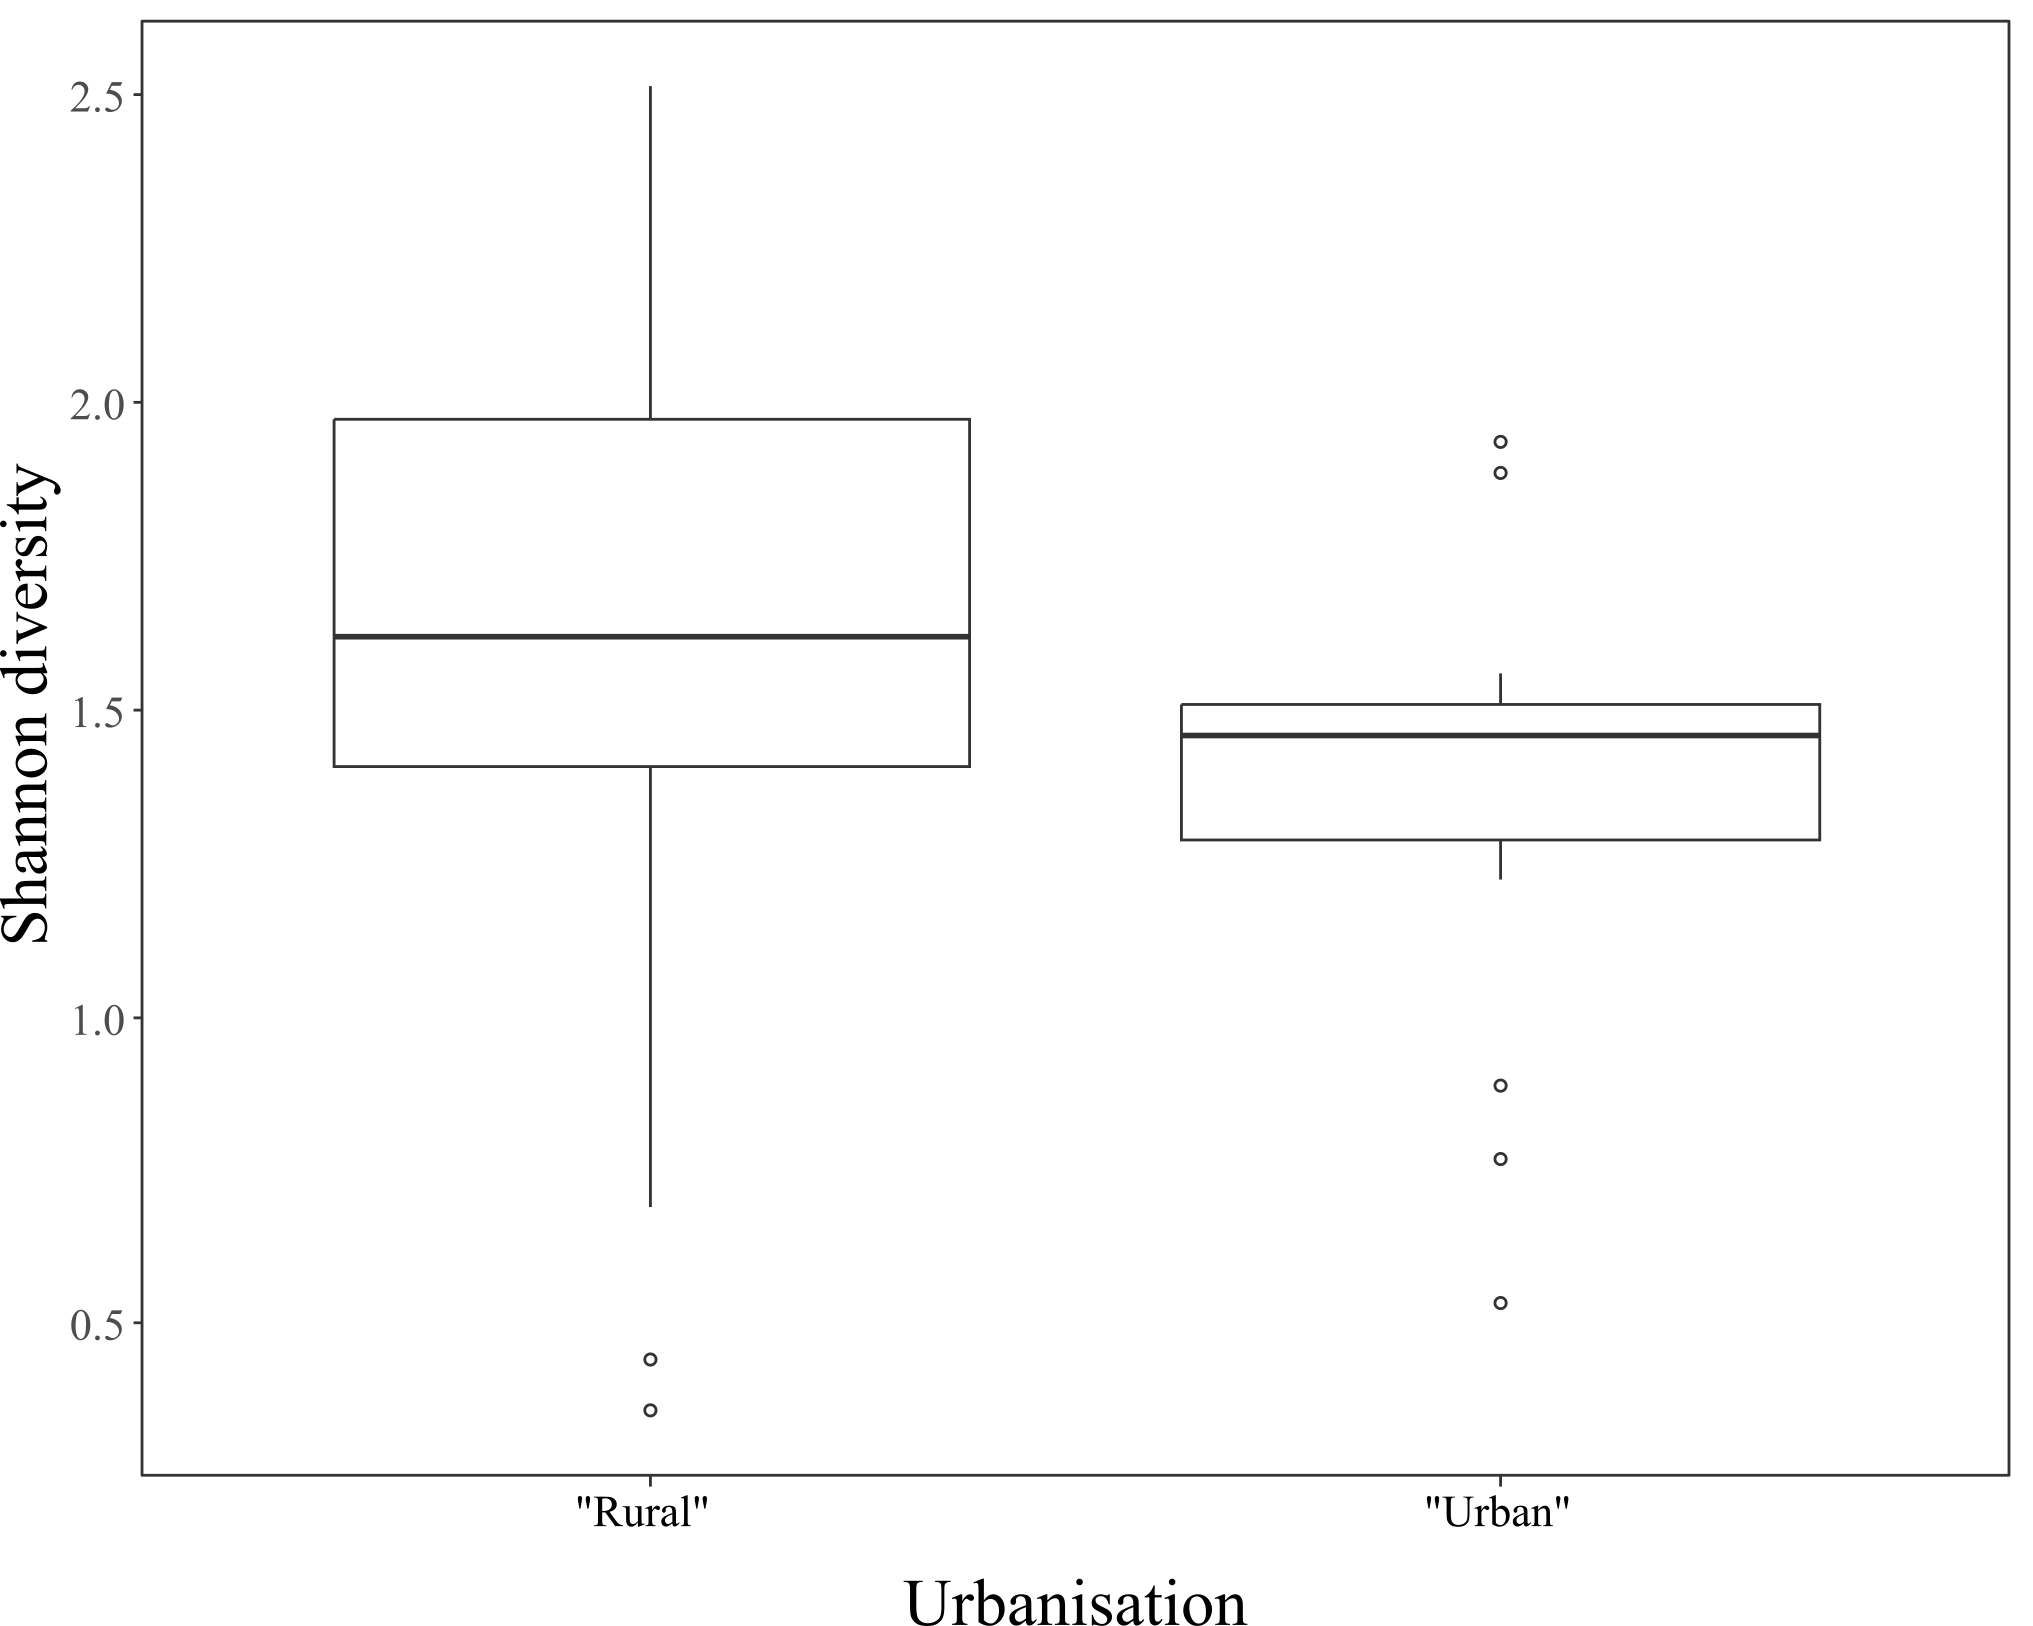
Urban environments were significantly less diverse than non-urban environments for both diversity metrics (Fig. 6), (Simpson: adj-R2 = 0.034, F1,111 = 4.926, p = 0.029; Shannon: adj-R2 = 0.042, F1,111 = 5.89, p = 0.017), but note the low R2 value in both models, indicating that urbanisation alone is a poor explainer of the variance in diversity.
DISCUSSION
Broadly, we found that abundance and diversity distributions in Pokémon HeartGold/SoulSilver emulate those observed in real world ecosystems. A few “species” (Magikarp, Hoothoot, Tentacool, Zubat, and Geodude) were common, but the majority of Pokémon were rare (Fig. 1). These common species were widespread and could be compared to generalists found across a variety of urban and rural habitat types in real ecosystems (rodents, doves/pigeons, jellyfishes) (Sorace & Gustin, 2009).
Even so, community composition varies across location types (Fig. 2). This game mechanic which motivates players to travel to different locations to find different Pokémon, reflects patterns observed in real systems due to abiotic forcings driving compositional differences in biomes. In HG/SS, diversity metrics were significantly associated with the number of habitat types (water and tree habitats), and with habitat size, particularly in settlements (Figs 3–5), where habitat management and green space have similarly been shown to increase biodiversity in real-world cities and towns (Knapp et al., 2008). Diversity was also significantly lower in settlements, which is likely explained by the presence of fewer habitat types, but nonetheless mirrors a trend seen in real ecosystems.
Previous work has established parallels between Pokémon and real taxonomic groups (e.g., Drage, 2024). While identifying mammals (e.g., Rattata), birds (e.g., Hoothoot), or arthropods (e.g., Spinarak) reflects a clear conscious design effort, identifying ecological roles is more challenging. Food chains are unlikely to be considered in Pokémon world design; for instance, some in-game locations contain no/few Pokémon that could be considered grazers, contradicting fundamental community assembly rules. It is therefore difficult to establish predator-prey interactions. Parasite-host interactions are equally hard to identify, but Pokémon like Slowbro may constitute an example. Mutualism (positive-positive net fitness interactions) and competition (negative-negative net fitness interactions) are challenging to disentangle from habitat-preferences or allopatry without either finer-scale spatial data or an understanding of a Pokémon’s ecological niche. As such, disentangling fine-scale ecological processes from abundance distributions, which are unlikely to be encoded into the original game, presents an impossible and probably fruitless (if fun) challenge. However, design choices and ecological strategies detailed in-text in Pokémon games has been shown as an effective tool for teaching about ecological interactions (Rangel et al., 2024).
The nature-like design of Pokémon is likely a key contributing factor in making Pokémon such a successful and enduring game world, with effects that seem to extend well beyond the games themselves and even into how people engage with science. This emulation is an encouraging sign that Pokémon might prime people to develop better intuitions about how real ecosystems work, which is especially pertinent at a time when humans are frequently disengaging with nature (Balmford et al., 2002; Naddaf, 2026). This reflection of nature is likely a conscious effort, given that Pokémon HQ hired PhD holders in animal and plant ecology to help with the world building of games like Pokopia and main line games. Pokémon has even been used to highlight specific ecological threats, e.g., the Galarian ghost-type Corsola as a representative of bleached coral form (introduced in Pokémon Sword and Shield (Generation VIII), compared to the usual colourful morph found in previous games, which has been driven to extinction (at least locally). Media can be a powerful tool to highlight ecological disaster, but often initial interest in nature is needed for engagement. The power of video games like Pokémon is that, whether or not they explicitly aim to increase ecological literacy, they have the capacity to do so, and so it can influence people who are not the traditional audience of natural science media.
REFERENCES
Balmford, A.; Clegg, L.; Coulson, T.; Taylor, J. (2002) Why conservationists should heed Pokémon. Science 295: 2367–2367.
Barbas, T.A.; Paraskevopoulos, S.; Stamou, A.G. (2009) The effect of nature documentaries on students’ environmental sensitivity: a case study. Learning, Media and Technology 34: 61–69.
Bavelier, D.; Green, C.S.; Han, D.H.; et al. (2011) Brains on video games. Nature Reviews Neuroscience 12: 763–768.
Begon, M.; Harper, J.L.; Townsend, C.R. (1996) Ecology: Individuals, populations and communities. Wiley-Blackwell, Hoboken.
Bray, J.R. & Curtis, J.T. (1957) An ordination of the upload forest communities of southern Wisconsin. Ecological Monographs 27: 326–349.
Chowdhury, S.; Ahmed, S.; Alam, S.; et al. (2024) A protocol for harvesting biodiversity data from Facebook. Conservation Biology 38: e14257.
Connell, J.H. (1978) Diversity in tropical rain forests and coral reefs: high diversity of trees and corals is maintained only in a nonequilibrium state. Science 199: 1302–1310.
Drage, H.B. (2024) Euarthropod diversity in Pokémon: searching for the ancestral type. Journal of Geek Studies 11(2): 97–102.
Godfrey, R. & Julien, M. (2005) Urbanisation and health. Clinical Medicine 5: 137–141.
Hruska, J. & Maresova, P. (2020) Use of social media platforms among adults in the United States—behavior on social media. Societies 10: 27.
Khan, T.M.; Griffiths, H.J.; Whittle, R.J.; et al. (2024) Network analyses on photographic surveys reveal that invertebrate predators do not structure epibenthos in the deep (~2000m) rocky Powell Basin, Weddell Sea, Antarctica. Frontiers in Marine Science 11: 1408828.
Knapp, S.; Kühn, I.; Mosbrugger, V.; Klotz, S. (2008) Do protected areas in urban and rural landscapes differ in species diversity? Biodiversity and Conservation 17: 1595–1612.
Mantler, A. & Logan, A.C. (2015) Natural environments and mental health. Advances in Integrative Medicine 2: 5–12.
Maune, A.L.; Caspers, B.A.; Damas‐Moreira, I. (2026) The impact of urbanisation on social behaviour: A comprehensive review. Biological Reviews 101: 1003–1035.
McCarthy, J.K.; Mokany, K.; Ferrier, S.; Dwyer, J.M. (2018) Predicting community rank‐abundance distributions under current and future climates. Ecography 41: 1572–1582.
Murray, B.R.; Rice, B.L.; Keith, D.A.; et al. (1999) Species in the tail of rank-abundance curves. Ecology 80: 1806–1816.
Naddaf, M. (2026) Pokémon turns 30—How the fictional pocket monsters shaped science. Nature 651: 285–286.
Pitman, S.D.; Daniels, C.B.; Sutton, P.C. (2018) Ecological literacy and socio-demographics: who are the most eco-literate in our community, and why? International Journal of Sustainable Development & World Ecology 25: 9–22.
R Core Team. (2022) R: A language and environment for statistical computing (Version 4.2.1). Available from: https://www.R-project.org/
Rangel, J.M.L.; Nascimento, A.L.B.; Ramos, M.A. (2024) The influence of urbanization on local ecological knowledge: a systematic review. Journal of Ethnobiology and Ethnomedicine 20: 106.
Sorace, A. & Gustin, M. (2009) Distribution of generalist and specialist predators along urban gradients. Landscape and Urban Planning 90: 111–118.
Stephenson, N.P.; Delahooke, K.M.; Barnes, N.; et al. (2024) Morphology shapes community dynamics in early animal ecosystems. Nature Ecology & Evolution 8, 1238–1247.
Stephenson, N.P.; Delahooke, K.M.; Kenchington, C.G.; et al. (2026) Depth affects the population dynamics on a soft coral-dominated reef on the Great White Wall, Fiji. Coral Reefs 45: 231–244.
Stephenson, N.P.; Pettorelli, N.; Early, R. (2025) Occupancy of urban habitats by the jersey tiger moth is revealed by social media data but not traditional monitoring. Ecology and Evolution 15: e71086.
Tews, J.; Brose, U.; Grimm, V.; et al. (2004) Animal species diversity driven by habitat heterogeneity/diversity: the importance of keystone structures. Journal of Biogeography 31: 79–92.
Ulrich, R.S.; Simons, R.F.; Losito, B.D.; et al. (1991) Stress recovery during exposure to natural and urban environments. Journal of Environmental Psychology 11: 201–230.
Weaver, A.J. & Lewis, N. (2012) Mirrored morality: an exploration of moral choice in video games. Cyberpsychology, Behavior, and Social Networking 15: 610–614.
About the authors
Nile Stephenson, PhD, is a research fellow in ecology based in Cambridge. His academic interests are in coral reefs and early animal evolution. In his spare time, he enjoys cooking, running, and music. Nile’s favourite Pokémon is Gengar.
Gabriel Stephenson, MPhil, MBioChem, is a software engineer based in Cambridge. He works on integrated information systems. In his spare time, he enjoys hiking, baking, and programming games. Gabriel’s favourite Pokémon is Nidoqueen.
Shujie Chang, MPhil, is a student in Zoology at the University of Cambridge. His research interests include trees, birds, and early animal fossils. He also enjoys cooking, travelling, and playing basketball. His favourite Pokémon is Treecko.
Britta Fiedler, MSc, is a PhD student in Okinawa, Japan, investigating the impacts of climate change on coral reefs. When she’s not in the water, you’ll find her at CrossFit or trying out a new recipe in her air fryer. Britta’s favourite Pokémon is Gengar.
Yarong Liu, PhD, is a researcher at Chinese Academy of Sciences and the University of Cambridge, studying early animal evolution and ancient ecosystems. She enjoys birdwatching because it feels like playing Pokémon in real life—meeting, discovering, and growing to love more and more of nature’s companions. Her favourite Pokémon is Leafeon.
Ayaka Paul, MSc, is a PhD student at the University of Cambridge interested in understanding multi-scale ecological dynamics of soft and hard coral reefs in southern Japan. Beyond her research, she enjoys underwater macrophotography, bouldering, ultimate frisbee, travelling, and reading. Her favourite Pokémon is Charmander.
Euan Furness, PhD, is a consultant ornithologist based in London. His academic interests are in seabird ecology, early animal evolution and eco-evolutionary simulation tools. Outside of work, he enjoys birdwatching and painting. His favourite Pokémon is Quagsire.
APPENDIX
Table S1. A summary of location size, diversity metrics, and most abundant Pokémon across locations in HG/SS.