I was teaching the birthday problem to a group of middle schoolers (around 15) and we did the usual thing where we tried to see if anyone had matching birthdays. For the unitiated, the birthday problem is a famous problem in probability theory posed around the 1930s that asks, “How many people do I need in a room to have a 50% chance that any 2 share a birthday?” The answer is surprisingly a lot lower than what most people estimate. It’s 23! (not a factorial 😁 )
The class actually had a shared birthday which only had a 25% chance. But that got me thinking as to what other groups of people that we interact with/ observe on a daily basis I could use to empirically show the students that the magic 23 holds. This article is the result of me discovering the number doesn’t actually hold and my deep dive into why.
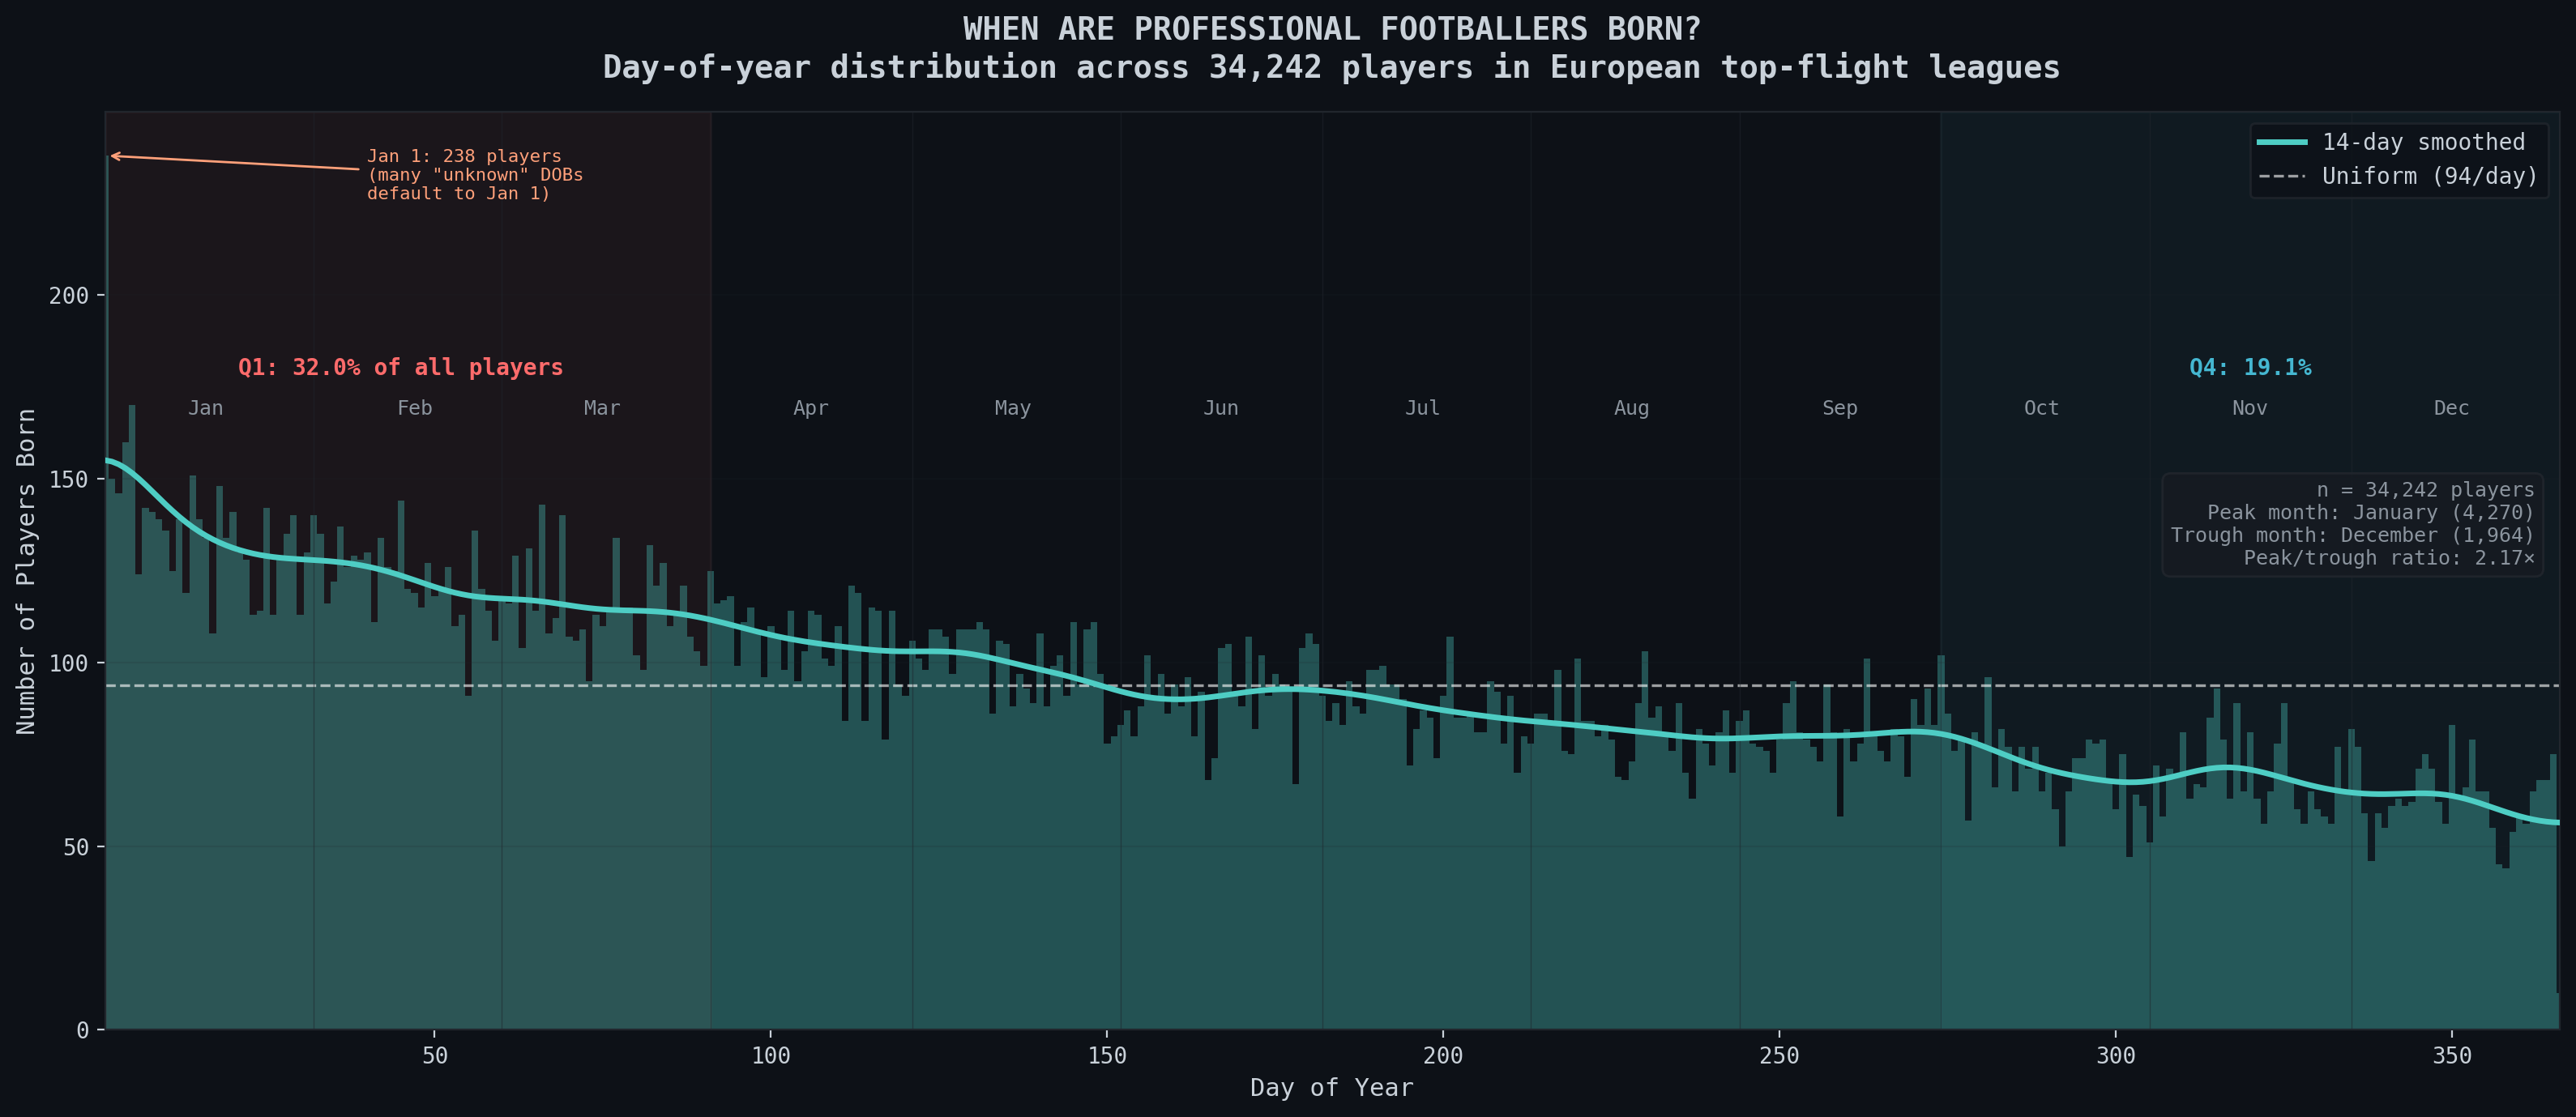
Do you notice something weird about this plot of the birthdays of every footballer’s birthday in the European top-flight leagues over the last decade? It’s not uniformly distributed which is what you’d expect from a dataset of this size. Instead its heavily skewed towards January, showing a consistent decrease later into the year. Globally, it’s a widely observed phenomenon that most births are in fact in August and September and not in January. So clearly, this isn’t a case of more footballers being born in Jan because more people are born then. This is the result of most academies in Europe having cutoff dates on the 1st of Jan. When we look at countries where the cutoff dates are actually different from the Jan 1 cutoff most places use, we see completely different distributions.
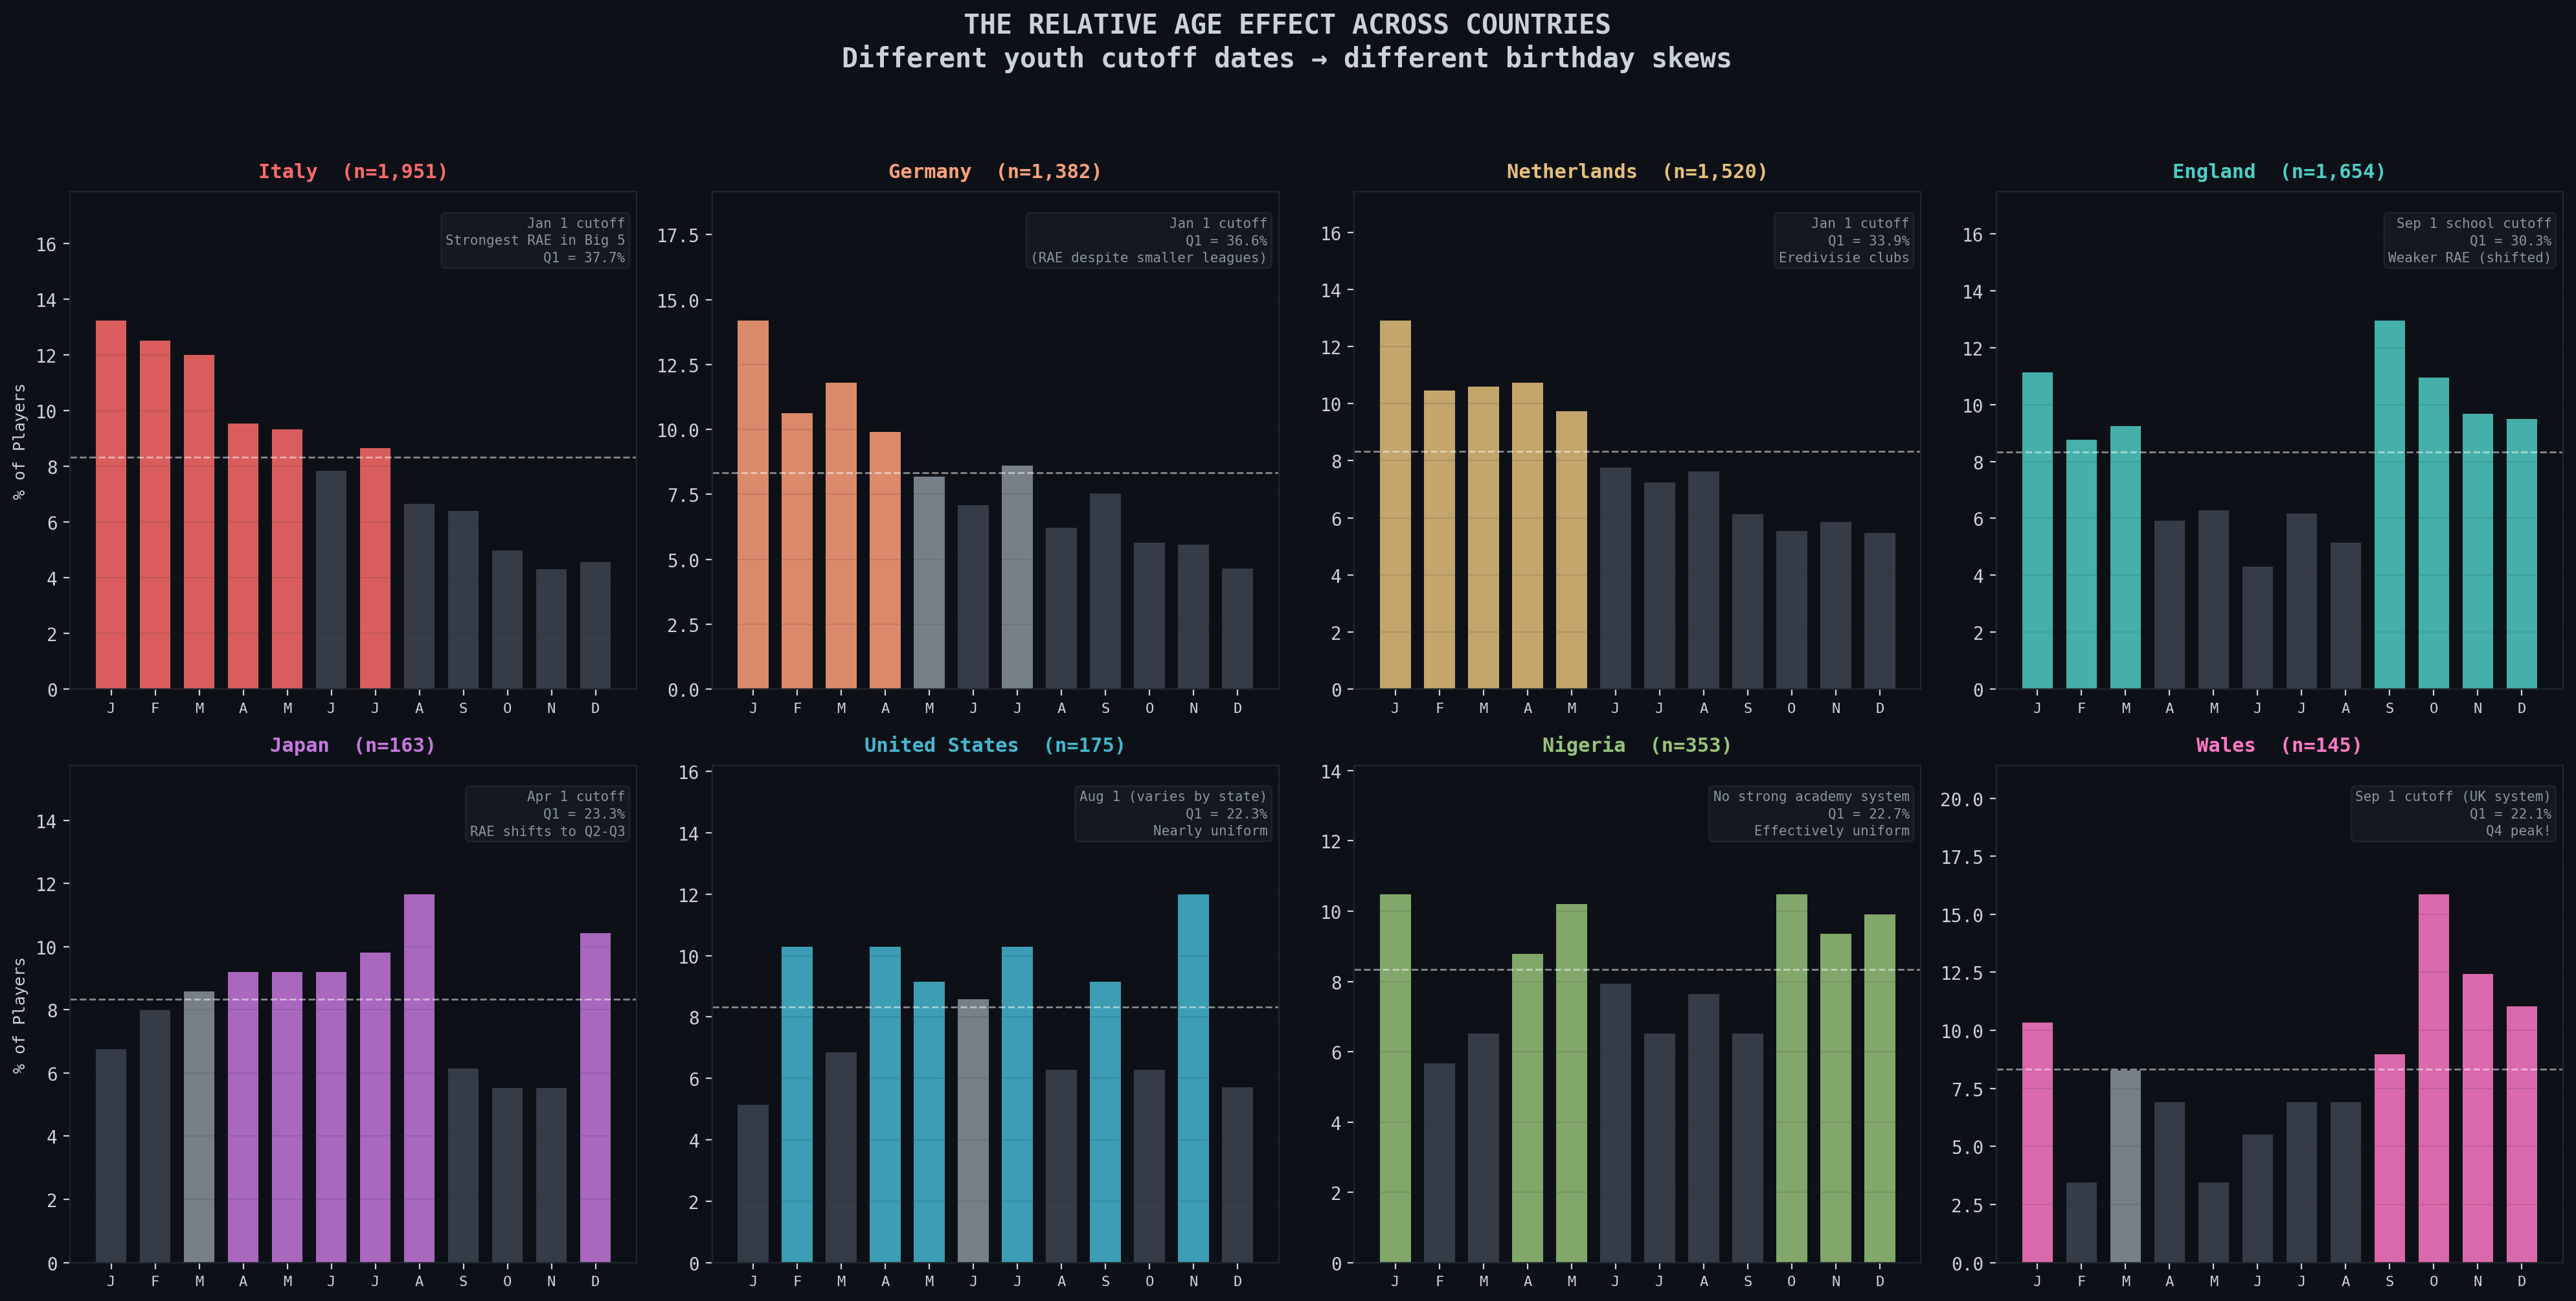
The top row is all countries who have cutoffs on Jan 1 and the bottom row is for countries where the cutoff is either a different day or not as well-defined. For example, Japan uses Apr 1 and Wales uses Sep 1, the start of their school year. Nigeria and the USA don’t have a uniformly enforced date and thus the distribution is actually somewhat uniform and not just skewed to right after their respective start dates.
Going back to our original question, what happens to the birthday problem with respect to footballers now that we know the data isn’t uniform? The plot looks something like this:
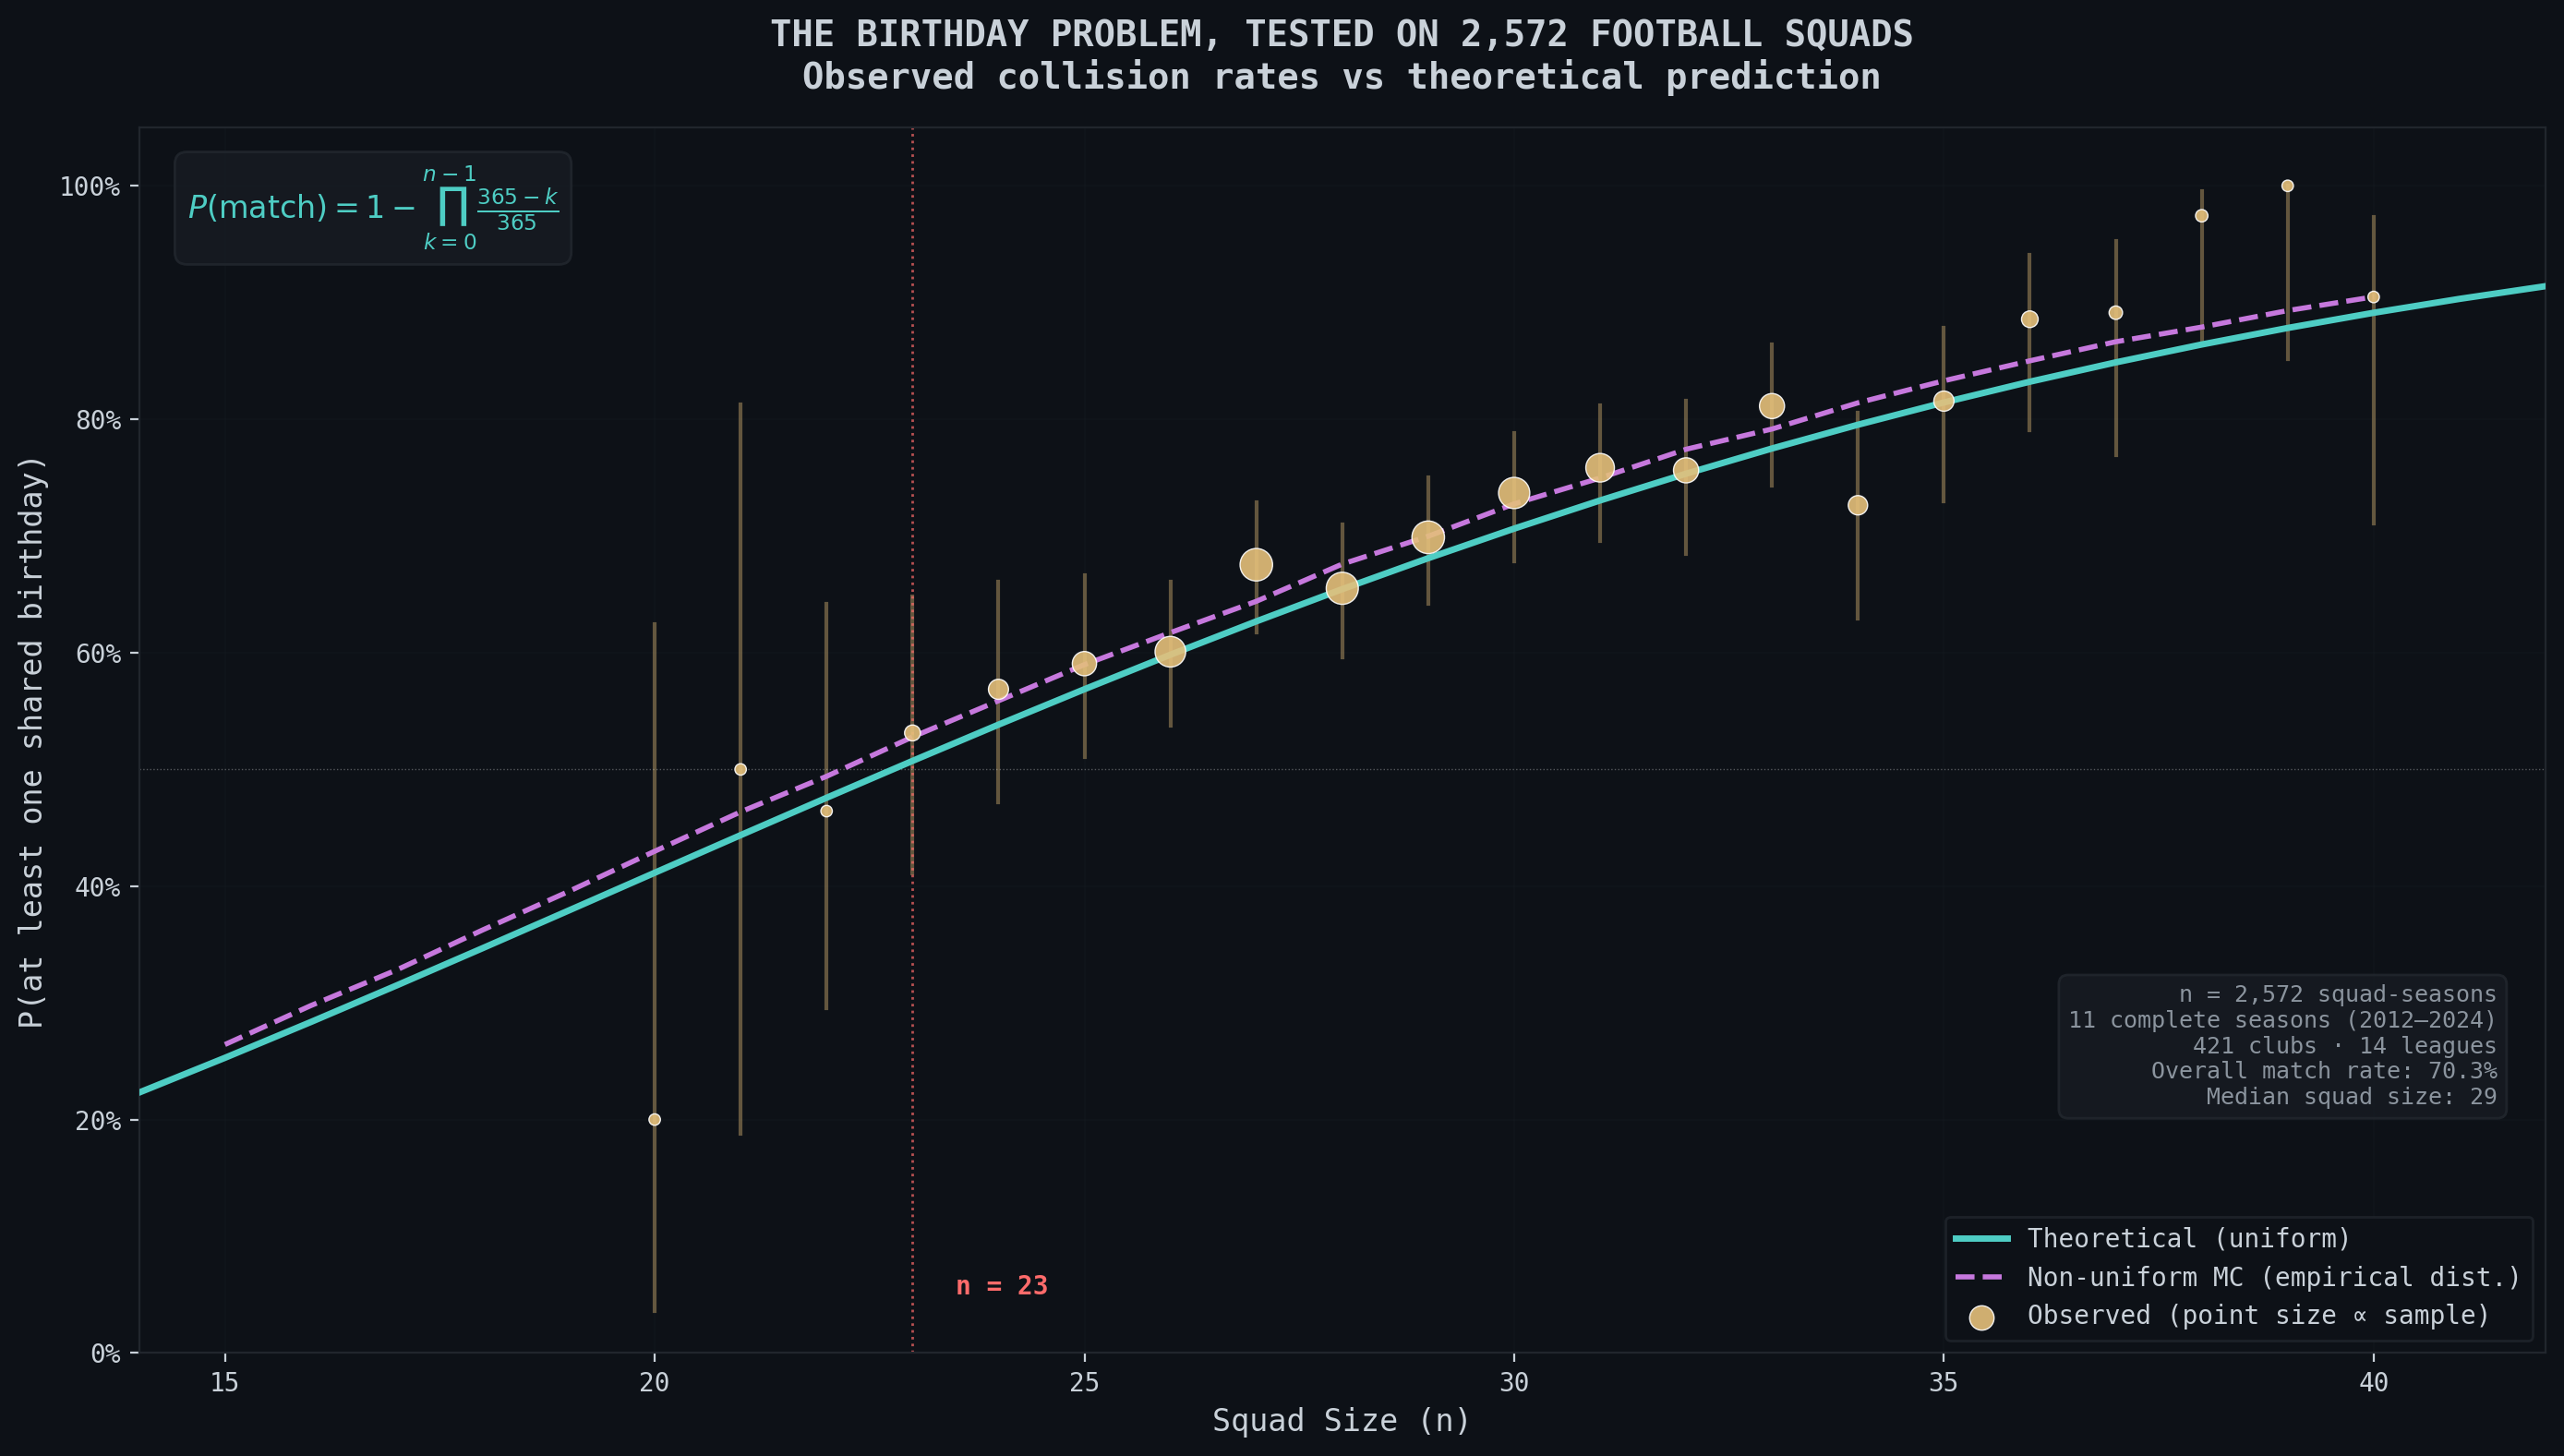
The cyan line is the probability of a match in birthdays if the distribution of footballer birthdays was uniform. The dotted line is the expected probabilities for the specific distribution that the footballer birthdays create. The outliers at 20 and beyond 35 are due to less than 20 squads at those sizes and just not enough data. The following figure also helps demonstrate how a majority of teams are around that 25 to 28 player mark:
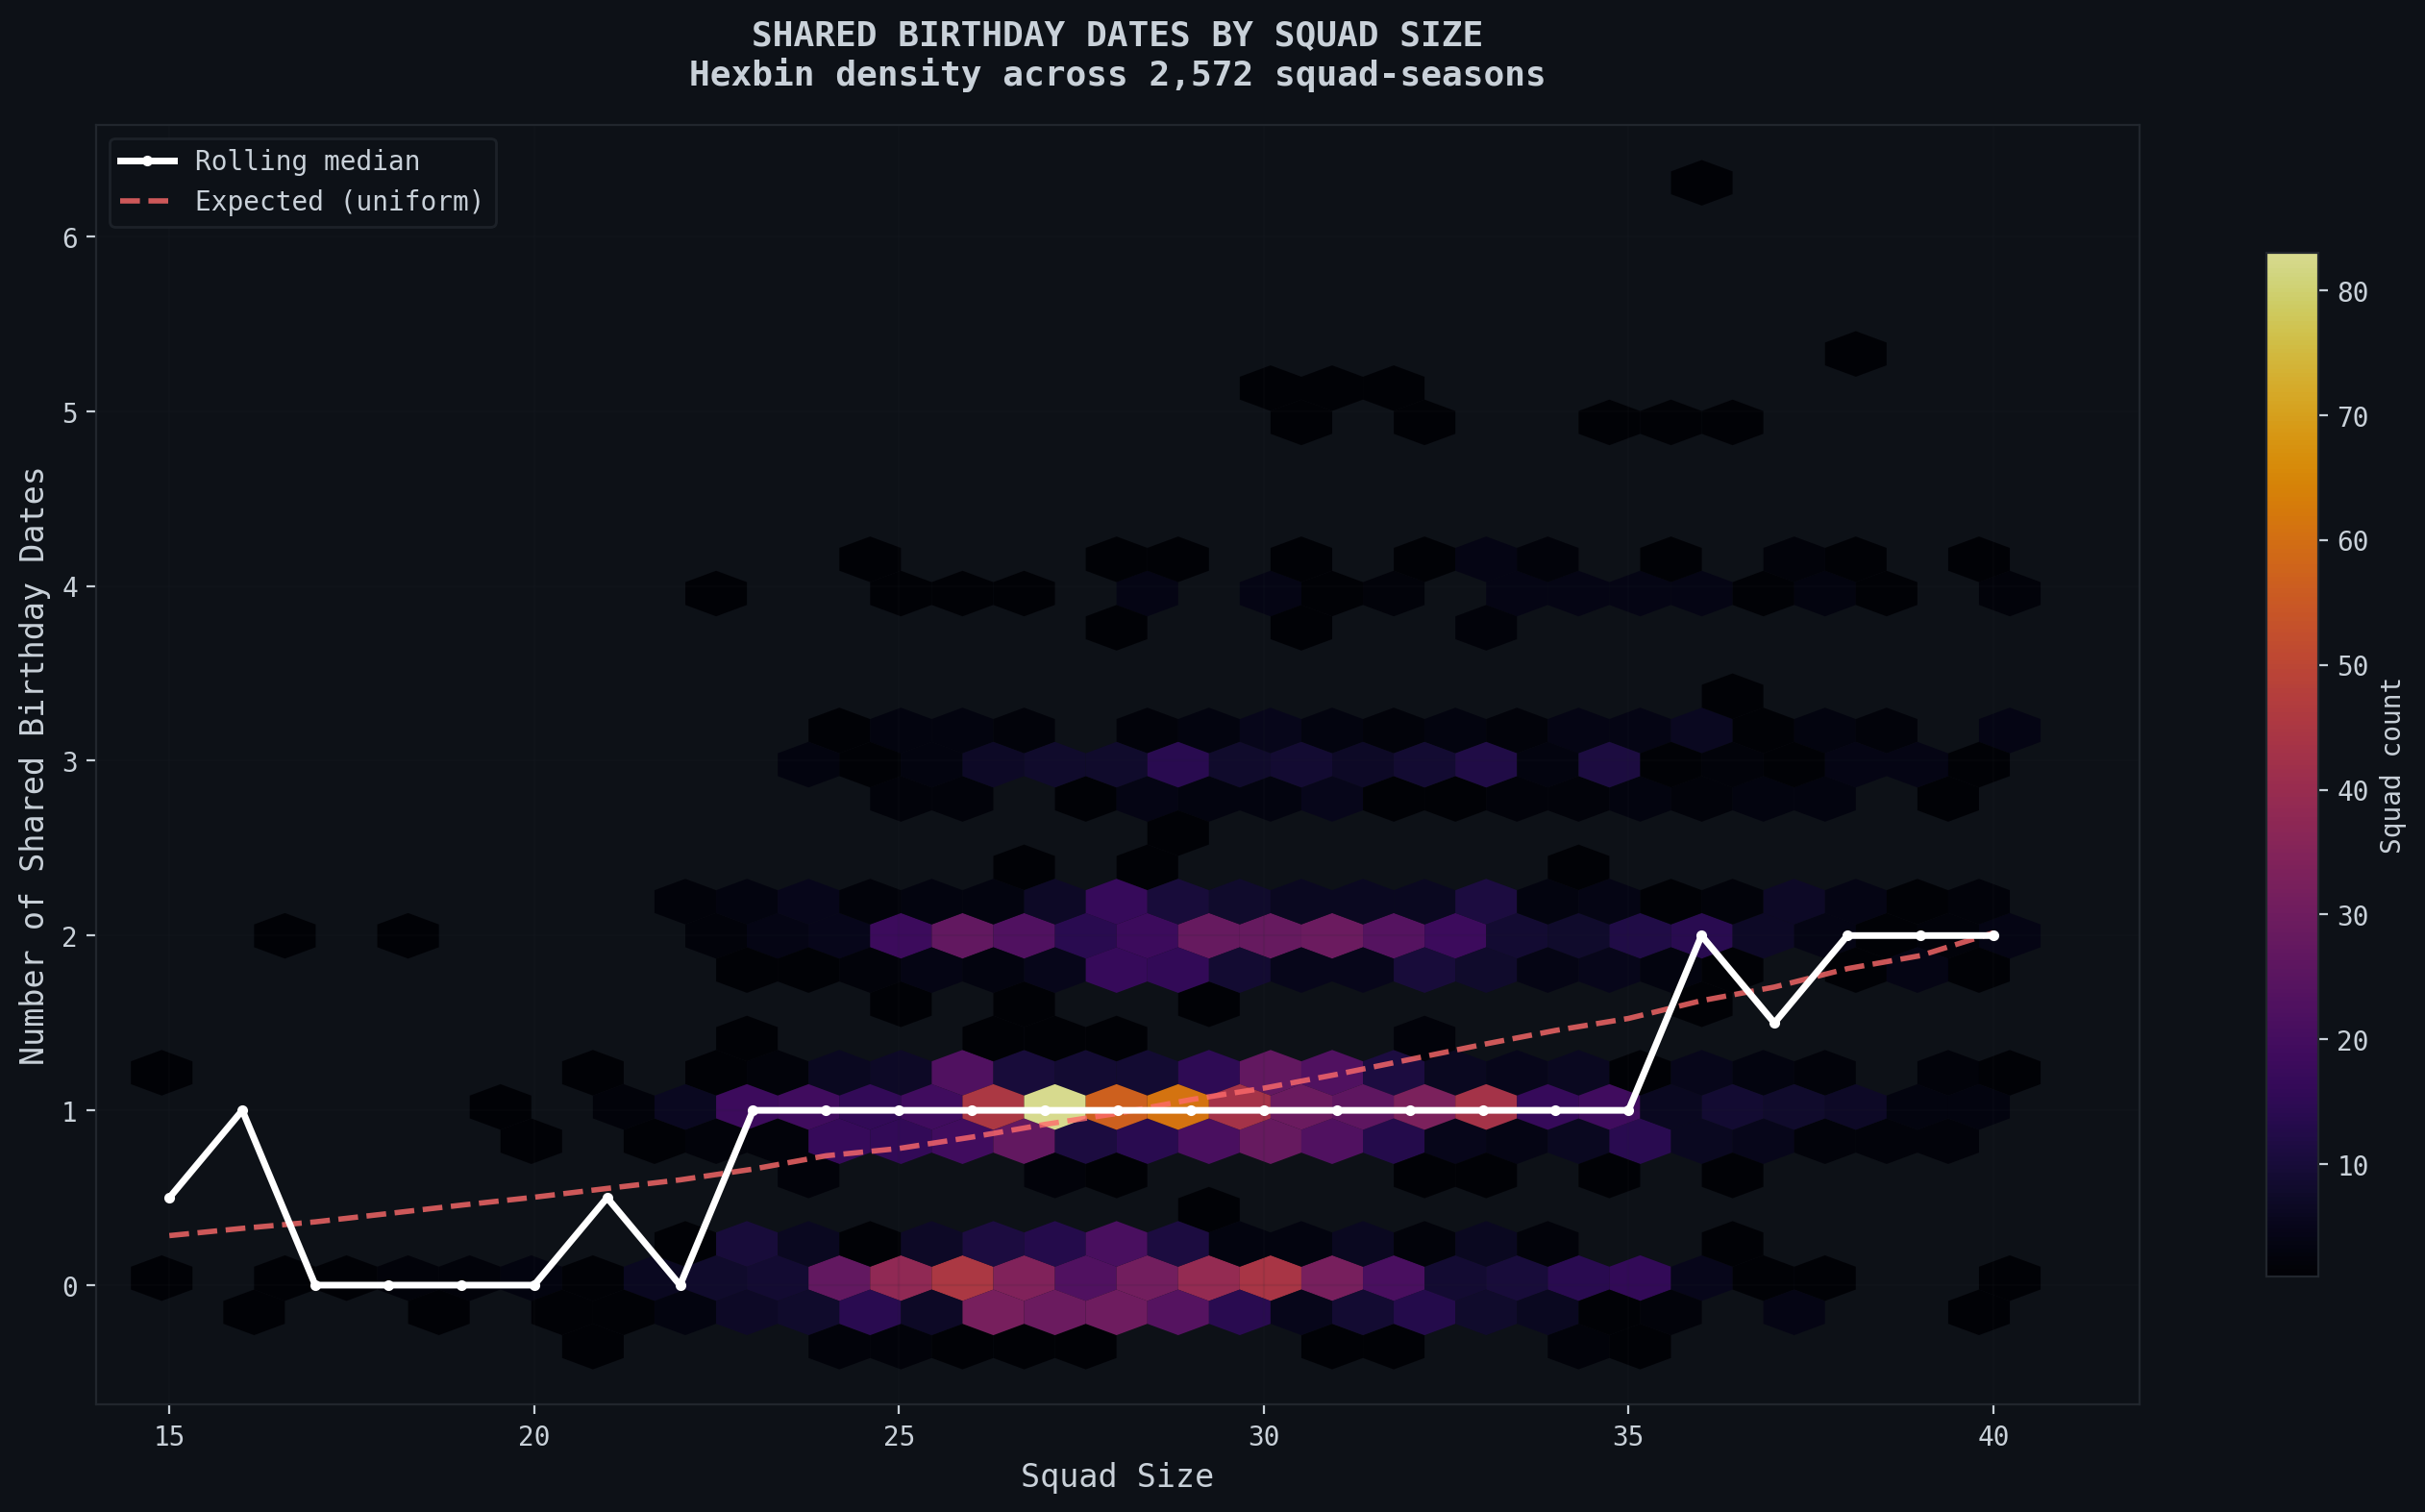
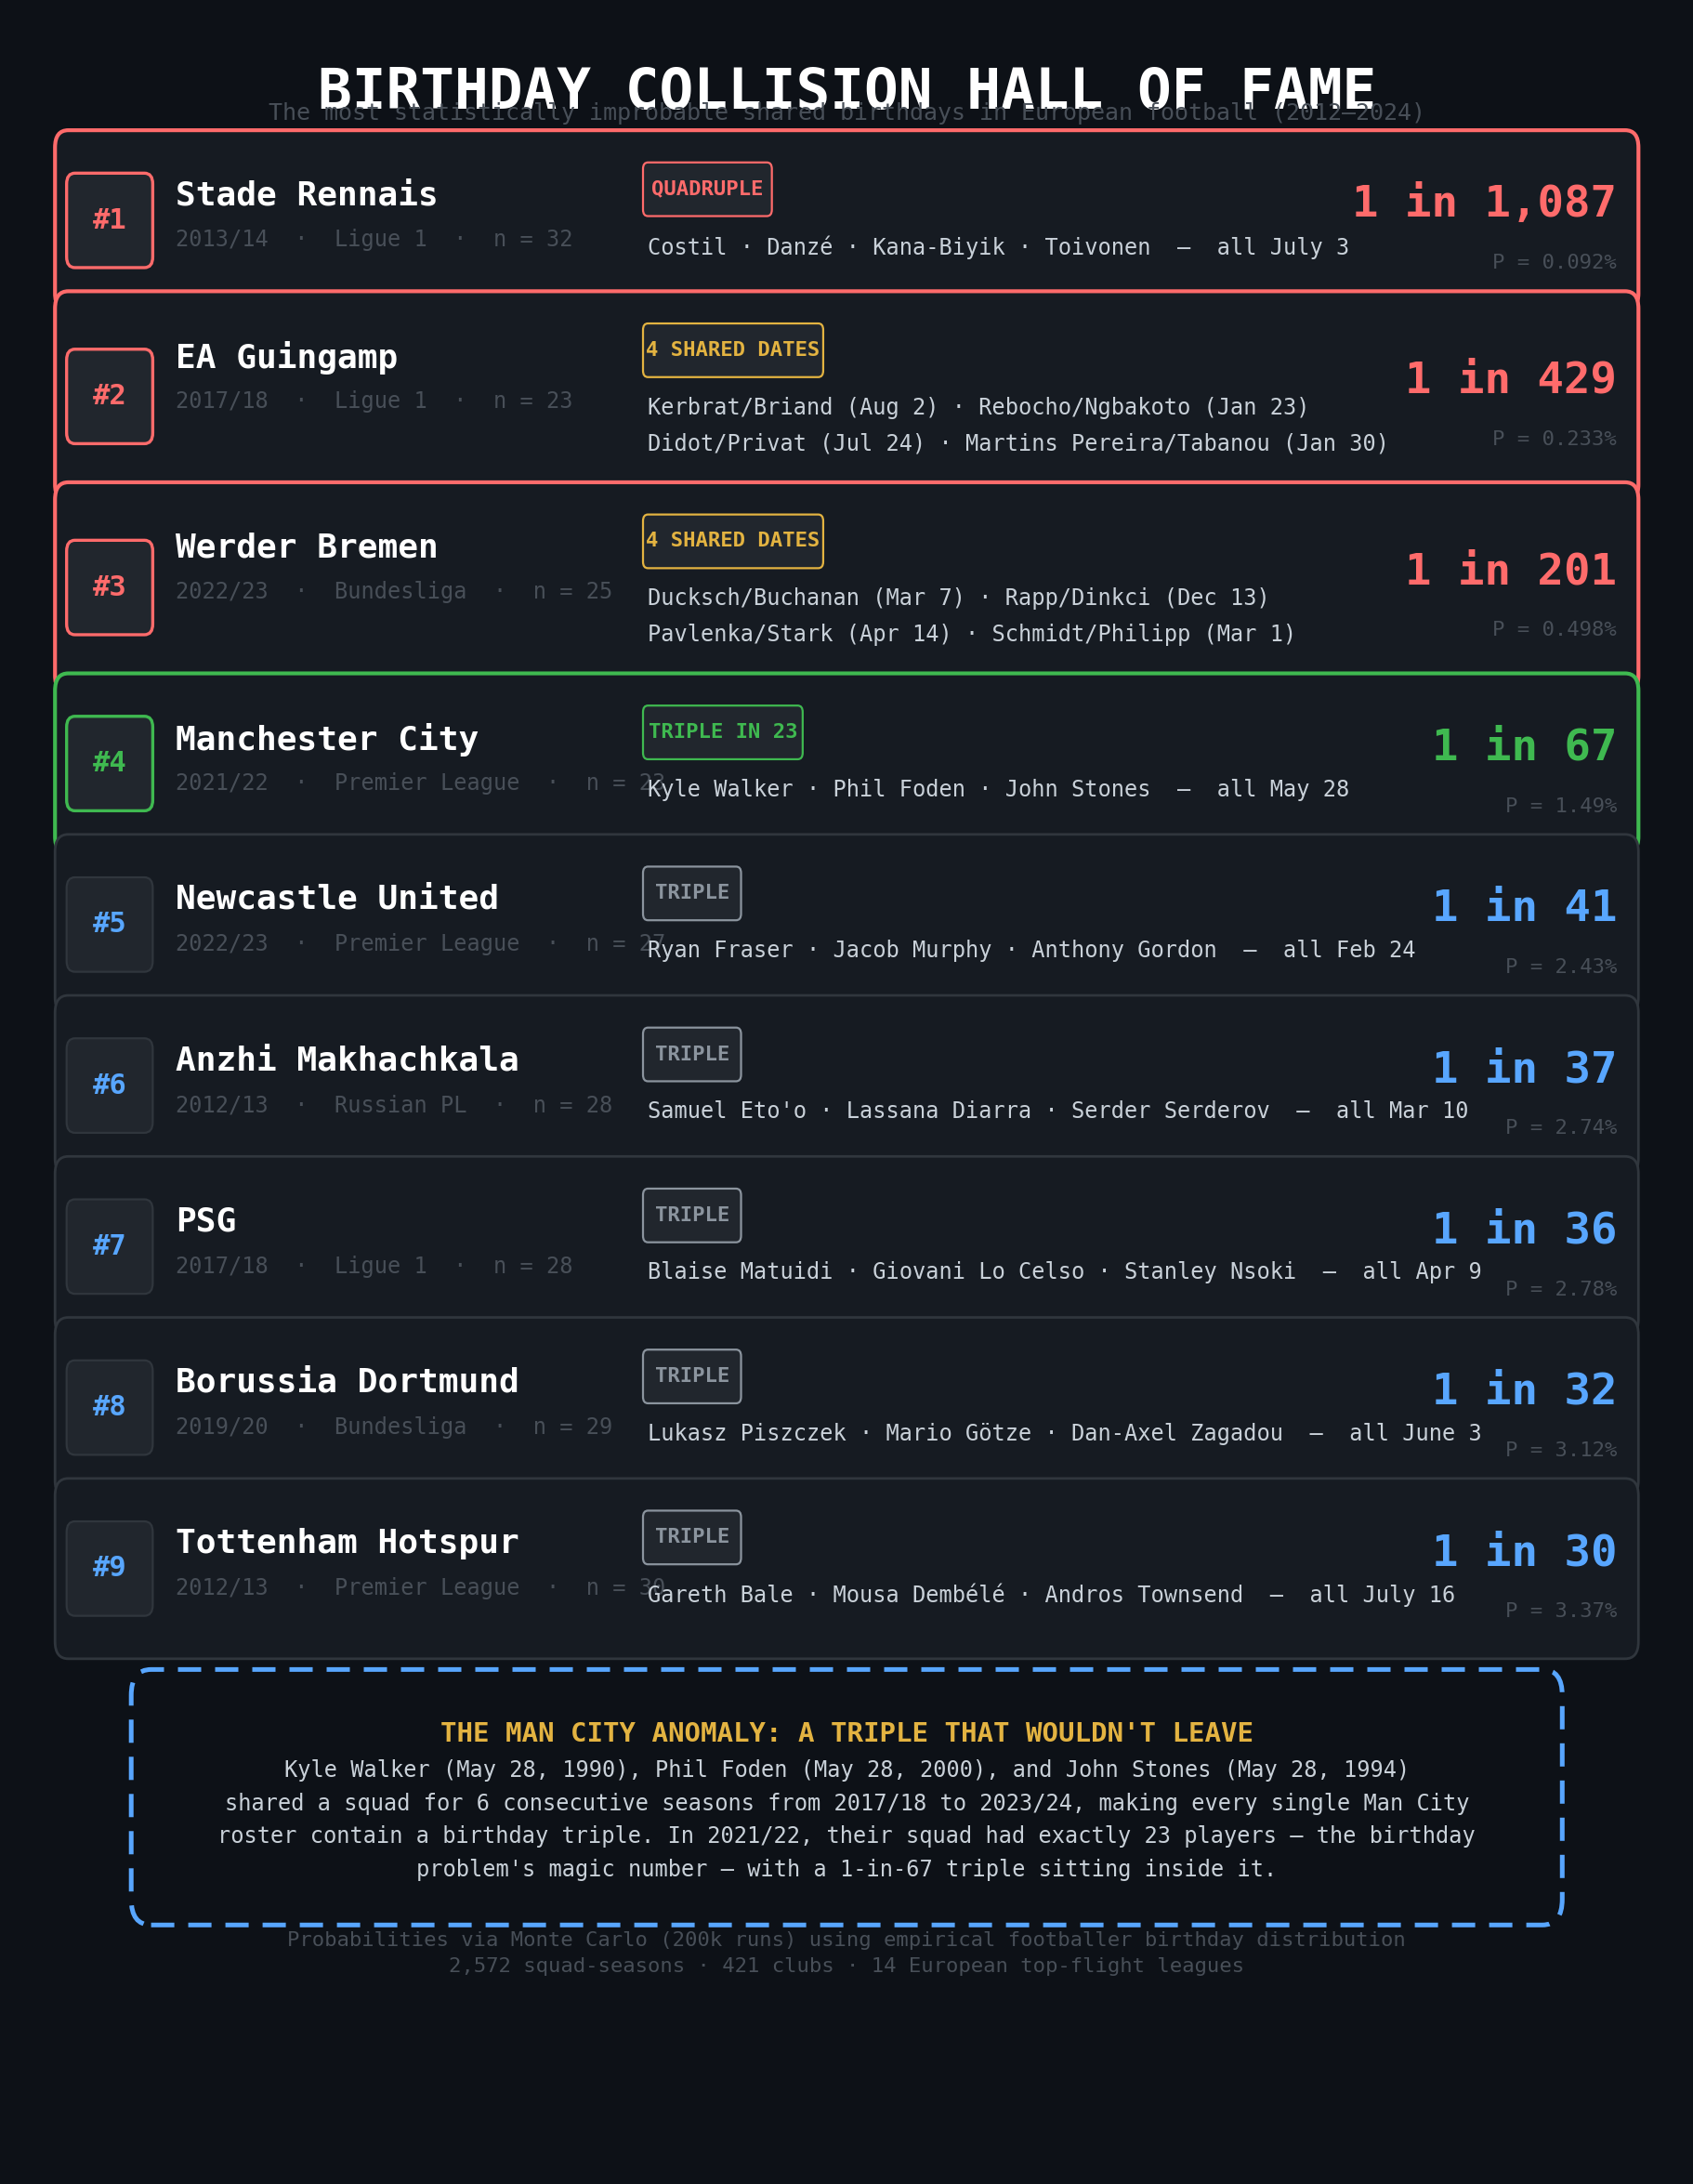
A final note as to what the most improbable events I found were, including four players with the same birthday, and four shared birthdays.