Currently, the primary route to a ∼1% local determination of the Hubble constant (H0) comes from distance ladders composed of three “rungs”: (1) geometric distance measurements to multiple independent “anchors”; (2) primary distance indicators (i.e., standard or standardizable luminous stars) observed in these anchors and in the hosts of several dozen nearby Type Ia supernovae (SNe Ia); and (3) supernovae (SNe) observed in these local hosts and in the Hubble flow. Given state-of-the-art measurements, the precision of this route has been most limited by the sample size, N, of the SN Ia hosts within the range of primary distance indicators such as Cepheid variable stars, tip of the red giant branch (TRGB), Mira variable stars, or C-rich asymptotic giant branch (AGB) stars, scaling as ∼(5%–8%)/ where the numerator depends on the (empirically demonstrated) quality of the SN distances. As of 2022, the largest collection of homogeneously measured SNe Ia (D. Brout et al. 2022; D. Scolnic et al. 2022) is complete to D ≤ 40 Mpc or redshift z ≤ 0.01. It consists of 42 SNe Ia in 37 host galaxies calibrated with observations of Cepheids with the Hubble Space Telescope (HST), the heritage of more than 1000 orbits (a comparable number of hours) invested over the last ∼20 yr (A. G. Riess et al. 2022, hereafter R22; see Figure 1). The size of this sample reduces fluctuations in H0 due to the intrinsic dispersion of SN magnitudes to ≤1%. The sample of four anchors—NGC 4258, the Milky Way (MW), and the Large and Small Magellanic Clouds (LMC and SMC)—all observed with HST, also reduces geometric calibration errors to ≤1% (L. Breuval et al. 2024).

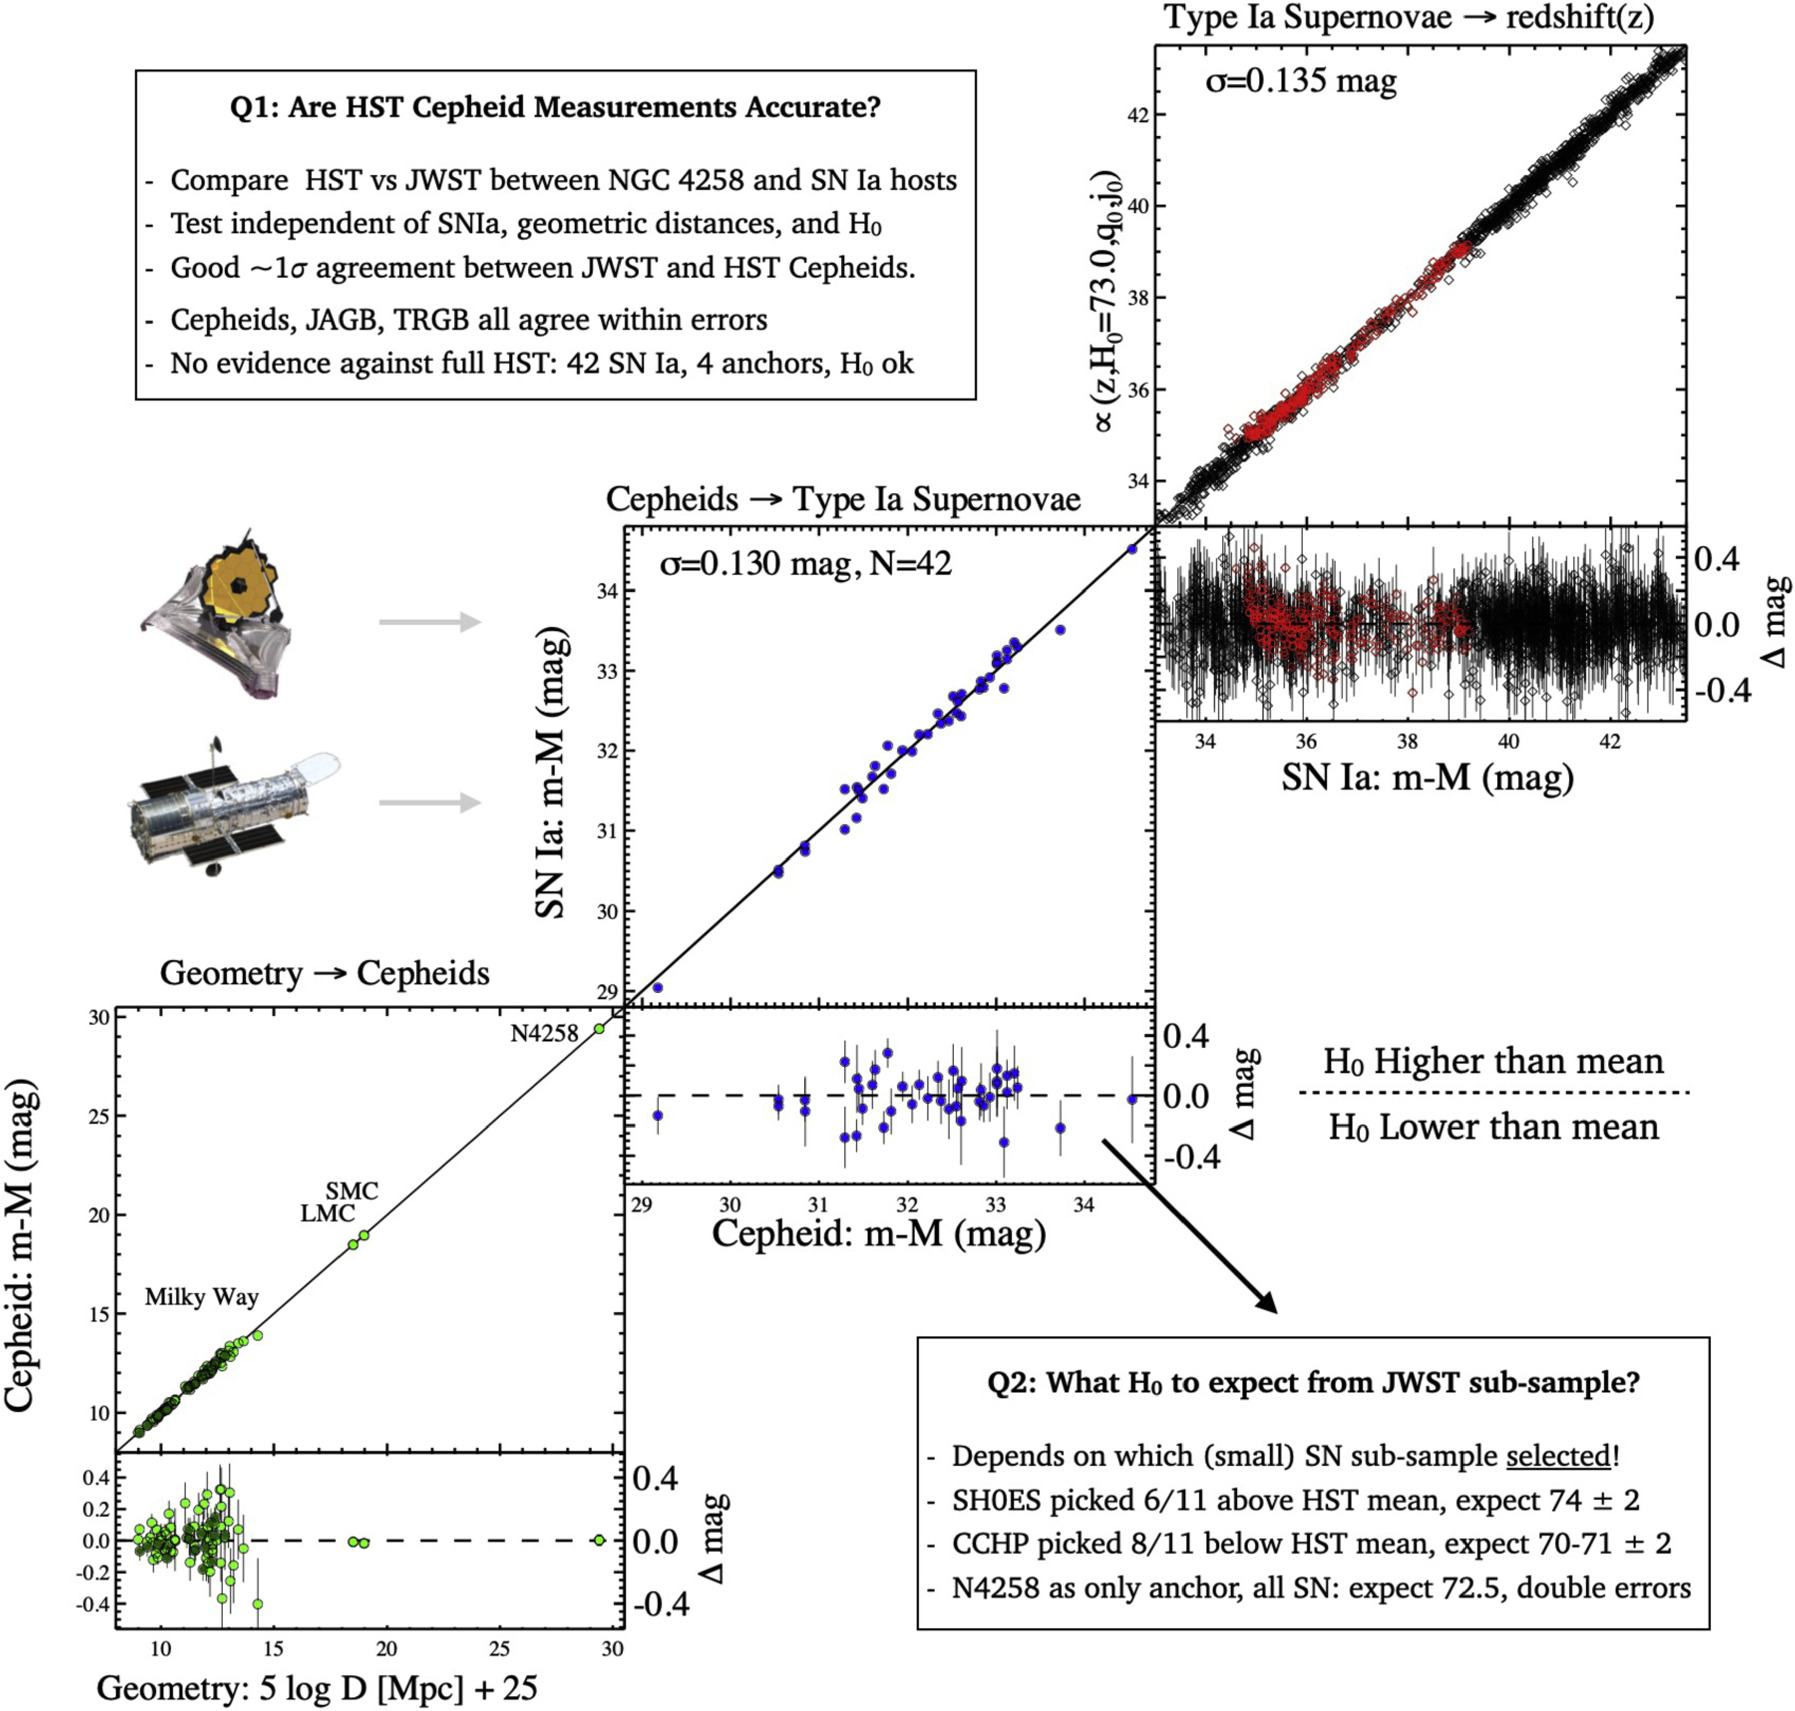
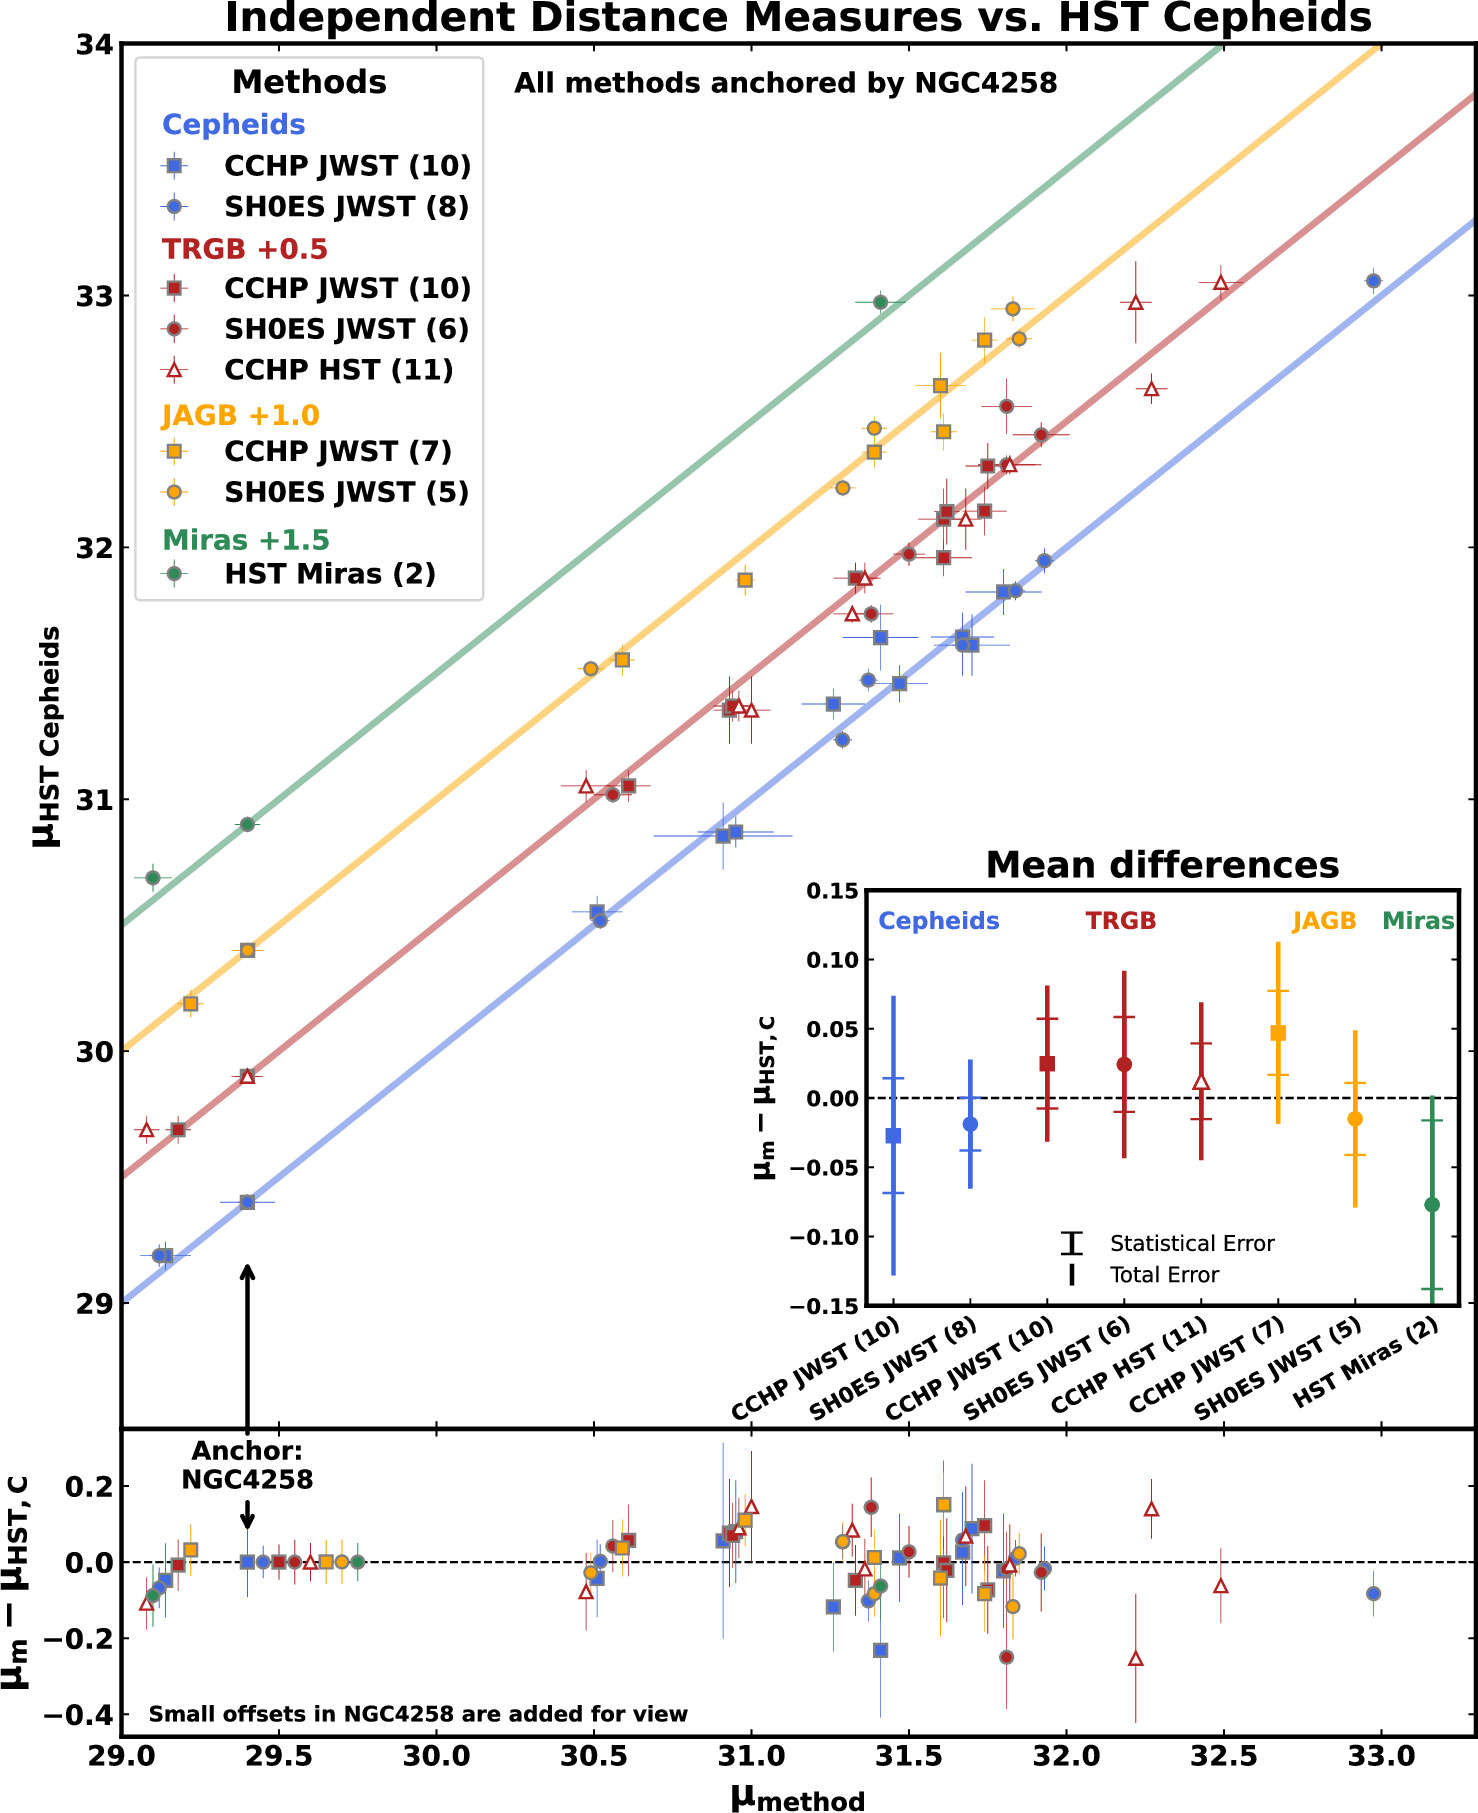
Figure 1. A graphic explaining two issues that may be addressed using new JWST observations, overlaid on top of the three-rung distance ladder presented by R22. The first (see Section 2) compares relative distances measured between NGC 4258 and SN Ia hosts by HST Cepheids with other indicators. This can be done at the 0.03–0.06 mag level depending on the quality of the measurements. This test is independent of SN magnitudes, anchor distances, and the Hubble flow. The second (see Section 3) refers to the measurement of H0 that can be expected from the selected SN subsamples and chosen anchor. This is strongly affected by the subsample selection owing to sampling noise and is most meaningfully compared to the same selections made from the full HST sample as indicated.
Download figure:
Standard image High-resolution imageHowever, the “Hubble tension,” a decade-long discrepancy now reaching a >5σ difference between the local determination of H0 and the prediction from ΛCDM calibrated by the cosmic microwave background (CMB) and which may augur new physics, has motivated additional tests and cross-checks (for an extensive and recent review of tests, checks and independent measures, see E. Di Valentino et al. 2021, R. B. Tully 2023, and L. Verde et al. 2023). The new capabilities of the James Webb Space Telescope (JWST) offer the means for additional cross-checks by comparing distances measured to SN host galaxies with those measured with HST. Two JWST programs received time in Cycle 1 to (re)measure distances between one anchor, NGC 4258, and a subsample of 5–10 hosts of 8–11 SNe Ia using a variety of established and new primary distance indicators: Cepheids, TRGB, and C-rich AGB stars. In this analysis, we review the consistency between all of the JWST- and HST-measured host distances. From this comparison, we derived the strongest constraints on the linearity of measured HST Cepheid distances. We also analyze an independent and important issue: the fluctuations in H0 due to the small size of the SN samples calibrated with JWST if exclusively used to determine the parameter.
JWST has certain distinct advantages (and some disadvantages) compared to HST for measuring distances to nearby galaxies. For Cepheids, JWST offers a ∼2.5× higher near-infrared (NIR) resolution than HST to mitigate crowding, though an optical facility like HST is still needed to find Cepheids. The observed reduction in the scatter of the Cepheid period–luminosity relation (P–L) for ideal observations with JWST is remarkable (A. G. Riess et al. 2024). For the TRGB distance indicator, JWST offers greater depth in the NIR where red giants are relatively brighter than other stars, but at the cost of a large and uncertain color dependency for the method. An I-like band is usually the choice for TRGB measurements because this feature appears flat in a color–magnitude diagram (CMD) of stars, where theory indicates differences in metallicity and age move stars primarily in color rather than brightness (at least with low-to-intermediate metallicities; W. L. Freedman et al. 2020). In the NIR, theory shows that the TRGB is tilted and nonlinear, and its shape is more sensitive to age and metallicity, making such measurements more challenging (P.-F. Wu et al. 2014; K. B. W. McQuinn et al. 2019; B. F. Madore et al. 2023; T. J. Hoyt et al. 2024; M. J. B. Newman et al. 2024). Another promising, newly employed “standard population,” C-rich AGB stars (JAGBs), produce a clump of stars in the NIR CMD with a luminosity function (LF) that may be measured and is presumed to be standard. The techniques for the newer methods are still evolving (J. J. Dalcanton et al. 2012; R. L. Beaton et al. 2018; M. J. Durbin et al. 2020; B. F. Madore & W. L. Freedman 2020; P. Ripoche et al. 2020; J. Parada et al. 2021; A. J. Lee 2023; T. J. Hoyt et al. 2024; S. Li et al. 2024b, and more).
Even by observing only small subsamples of SN Ia hosts and NGC 4258, JWST is able to provide a strong cross-check of distances in the first two rungs because this comparison is independent of SNe Ia and their own intrinsic scatter, empirically ∼0.12–0.19 mag. This test is also independent of the knowledge of the geometric distance to the anchor. It is, however, still subject to the uncertainties in the measurements of both distance indicators or both telescopes in NGC 4258, an error floor to the comparison of two indicators or telescopes and which is not reduced by adding more SN hosts. We explain this cross-check in Figure 1.
Several comparisons of the measured difference in distance between NGC 4258 and a subsample of SN Ia hosts between HST Cepheids and indicators measured by JWST have already been presented. A. G. Riess et al. (2024) found agreement between >1000 Cepheids measured with JWST and HST for five SN Ia hosts from the SH0ES team, when both sets were analyzed at the same wavelength and with the same slope for the P–L and using multiple JWST epochs to measure light-curve phases, with a difference of −0.011 ± 0.032 mag. S. Li et al. (2024b) compared the I-band (F090W) TRGB between NGC 4258 measured by G. S. Anand et al. (2024) and eight hosts of 10 SNe Ia in the SH0ES JWST sample, finding agreement with HST Cepheids at the level of 0.01 ± 0.04 (stat) ±0.04 (sys) mag. A direct comparison of the 11 I-band TRGB distances to SN Ia hosts from HST by W. L. Freedman (2021) and by R22, relative to NGC 4258 (where they define MI = −4.05 mag; I. S. Jang et al. 2021), produces a difference of 0.01 ±0.04 mag. 12 S. Li et al. (2024b) compared JAGB measurements with JWST between four SN Ia hosts and NGC 4258, finding agreement with Cepheids, though the precision was limited by systematic differences in characterizing the JAGB LF. A study by W. L. Freedman et al. (2024, hereafter F24) and A. J. Lee et al. (2024, hereafter L24) compares three distance indicators measured with JWST but to each other rather than to the HST R22 Cepheid sample, the results of which we will address in Section 2. We review the comparisons of each method, telescope, and group, using the HST Cepheid R22 sample as a reference since it contains all of the other measured subsamples. While fluctuations may occur for any selected subsample, it is important and the convention to make use of a large, distance-limited sample to reduce bias and fluctuations. It is important to note that neither the JWST SH0ES nor the CCHP targets constitute a distance-limited sample to the distance of their farthest target. Remarkably (given the lack of program coordination), a distance-limited sample is formed by the combined JWST observations of the two programs for D ≤ 25 Mpc, which includes 16 SNe Ia in that range.
It seems reasonable to use JWST observations to compare relative distance methods and sources (HST Cepheids, JWST Cepheids, I-TRGB, NIR-TRGB, and JAGB) to identify which are in mean accord (<2σ–2.5σ is conventional) and which are not (>2.5σ–3.0σ is problematic). If HST Cepheid measurements are in accord with others, there would be no evidence to reject their use or the large sample of SNe Ia calibrated with HST to determine H0 and which offers the only route to a local measurement approaching 1% precision.
It is less clear that there is value (beyond the host distance cross-checks) in measuring H0 exclusively from these JWST-selected subsamples because their small size quadruples the variance in H0 owing to the intrinsic dispersion of SNe Ia while introducing no new objects. This SN sampling noise is already reduced within the HST full sample of 42 SNe Ia and would otherwise revert to past levels (at the level of A. G. Riess et al. 2011) with JWST if it is the only source used to determine H0. Furthermore, the selected subsamples cannot be considered without the potential for observer bias (e.g., the SN absolute magnitudes having been previously measured, most by A. G. Riess et al. 2016, 2022), nor are they complete in distance.
One further consideration is the availability of geometric anchors used to determine H0. There are four geometric anchors (R22; L. Breuval et al. 2024) for Cepheids directly observed by HST. For population-based methods (e.g., TRGB or JAGB), parallax is less useful, and three of the four anchors are too bright for JWST. It is not yet clear if JWST will be able to usefully observe indicators in the MW, LMC, or SMC, a feat HST achieved only through rapid spatial scanning and gyro-guided fast slews (A. G. Riess et al. 2018, 2019), not currently available for JWST. From HST Cepheids (R22), there are predictable fluctuations in H0 based solely on anchor choice. NGC 4258, the sole anchor available for JWST, produces the lowest value of H0 of the four anchors, decreasing H0 from the four-anchor mean of L. Breuval et al. (2024) by ΔH0 ≈ 0.7 km s−1 Mpc−1. Reducing anchors also increases the uncertainty. With NGC 4258 as the sole anchor, R22 found H0 = 72.5 ± 1.5 km s−1 Mpc−1 (a reduction to a 3σ tension with CMB+ΛCDM even before any reduction in SN sample size). For a sample of only ∼10 SNe with JWST, combining the error in measuring primary distance indicators in NGC 4258 (σ ≈ 1.3 km s−1 Mpc−1) with the SN subsample (σ ≈ 1.5 km s−1 Mpc−1) yields σ ≈ 2.0 km s−1 Mpc−1before including the geometric calibration (σ ≈ 1.1 km s−1 Mpc−1), thus a total error of 2.3 km s−1 Mpc−1, which would be insufficient to detect the present tension of ΔH0 ≈ 5–6 km s−1 Mpc−1. A small D ≤ 25 Mpc distance-limited sample from R22 with only NGC 4258 as anchor selected from the HST R22 samples gives H0 = 72.3 ± 1.8 km s−1 Mpc−1, a reduction to a marginal 2.5σ tension (i.e., assuming perfect measurement agreement with JWST). Simply put, slashing the size of the distance-ladder sample trivially reduces the significance of the tension by inflating uncertainties rather than explaining it. A valid assessment of the tension would require taking into account all relevant data while correcting subsample bias.
Here we analyze early JWST observing programs and the distance measurements from each. The consistency of the various distance probes are in Section 2 and of H0 in Section 3, and we discuss notable differences with the analysis of some of this data in F24 in Appendix B.
2.1. Data
2.1.1. Previous HST Samples
The full HST Cepheid sample from SH0ES (R22) is a distance-limited (z ≤ 0.01) set of 42 SNe Ia in 37 late-type hosts (since 2021) calibrated by four different anchors. This sample provides an ideal reference for all other samples because it contains all of the subsamples described here. In Table A1, we present a compilation of relevant information for the full HST sample of SN Ia hosts and selected JWST subsamples, similar to Table 6 of R22 but with NGC 4258 as the sole anchor, 13 allowing for a direct comparison with other methods or telescopes that rely only on this galaxy. We also make use of HST I-band TRGB measurements in SN Ia hosts given by W. L. Freedman (2021) calibrated to NGC 4258 and Miras measured in SN Ia hosts calibrated to NGC 4258 (C. D. Huang et al. 2024).
2.1.2. JWST Observations
Several early JWST programs reobserved a number of hosts from the the full HST sample. JWST Cycle 1 GO-1685 (Guest Observer; A. Riess et al. 2021; SH0ES) observed five hosts of eight SNe Ia in two epochs with NIRCAM filters F090W, F150W, and F277W to measure Cepheids and the I-TRGB (later adding the C-rich AGB star candle). Their choice of hosts favored those with the largest numbers of Cepheids and SNe Ia per host. GO-1995 (W. L. Freedman et al. 2021; CCHP) observed 10 hosts of 11 SNe Ia in one epoch and NIRCAM filters F115W and F444W (part way changing F444W to F356W) to measure Cepheids, the NIR-TRGB, and carbon stars. Their choice of hosts favored suitability for the three chosen distance indicators in all hosts, resulting in targets at D ≤ 25 Mpc. Their most distant galaxy, NGC 4639 (μ = 31.823 ± 0.091 in R22 or Table B1), is consistent with the high end of this range. One host (of two SNe Ia), NGC 5643, was selected by both programs. Cycle 1 program GO-2581 (R. Chandar et al. 2021) serendipitously observed one R22 host, NGC 4038, where we recovered 22 Cepheids in the same filter F150W used to measure Cepheid distances in the SH0ES baseline. An early Cycle 2 program GO-4087 (C. Huang et al. 2023) observed 90 Cepheids in the SH0ES host M101 with the same F150W filter. We will consider these two hosts (NGC 4038 and M101, both also present in the CCHP-selected sample) here as part of a JWST SH0ES-selected/system sample because they can be measured with the exact same NIRCAM F150W system as the others. A JWST Cycle 2 program, GO-2875 (A. Riess et al. 2023a; SH0ES) has observed another five hosts of seven SNe Ia. One of these, NGC 3447, is at D ≤ 25 Mpc based on HST Cepheid measurements (R22) and would complete the distance-limited SN Ia sample with JWST Cepheid observations. We measured 140 Cepheids in this host (following the same procedures given in R24) and include its measurement in Table A2. We also include JWST TRGB measurements presented in S. Li et al. (2024a) with D ≤ 25 Mpc. All distance data are in Table A2. We note that both groups use the same primary software for measuring stellar photometry (DOLPHOT; A. Dolphin 2016; D. R. Weisz et al. 2024), so there is every reason to expect measurement consistency. Here we adopt the distance measurements provided in F24 at face value.
There are several differences in how the observations were obtained and in the analysis procedures adopted. Describing these differences in detail goes beyond the scope of this paper; for full details, we direct the reader to the original papers (A. G. Riess et al. 2023b, 2024; G. S. Anand et al. 2024; F24; L24; S. Li et al. 2024a, 2024b). One specific difference impacting the quality of the results is the choice of primary filter and the number of epochs; GO-1685 adopted a redder filter, F150W, and obtained observations at two different epochs to constrain the phases of individual Cepheids (A. G. Riess et al. 2024), while GO-1995 used F115W as primary and obtained a single epoch (F24). For the one host in common, NGC 5643, the P–L relation obtained in F150W using the two-epoch phase constraints has a scatter of 0.17 mag, while the relation obtained using a single epoch of F115W has a scatter of 0.23 mag, about 35% larger. Both yield similar distances (SH0ES, μ = 30.52 mag; CCHP, μ = 30.51 mag). 14
2.2. Comparison Formalism
To briefly review, we can measure the distance modulus  to an SN Ia host by measuring the magnitude (m) or dereddened magnitude (m0) of a type of standard candle, a or b, in the ith host and also in NGC 4258. From these, we obtain their difference in distance modulus and then add the known geometric (maser) distance modulus, μ0,N4258:


with
where
Note that these equations assume that all error terms are independent and uncorrelated. We note that an individual host magnitude uncertainty, σ(mi,a ) is defined to include both measurement error and intrinsic scatter of the candle. Equation (4) provides the error in the difference in distance moduli for a single host or for a sample of hosts by substituting σa and σb from Equation (5).
The difference in distance modulus between the methods, Δμ(a − b), is independent of knowledge of the geometric distance, μ0,N4258. For a sample of N SN Ia hosts, the uncertainty in the measured differences,  , will be reduced by
  (Equation (5)), but uncertainties from the independent measurements of two methods in NGC 4258,
  , become the limiting factors for measuring the difference. We see no way to avoid this term as it encompasses the quality of the measurements in NGC 4258, which could vary from excellent to poor, which would be reflected in this term. For a population-based indicator like TRGB or JAGB, this term would also include any intrinsic field-to-field (or population-to-population) scatter. F24 (Table 5) refers to measurement uncertainties in NGC 4258 together with the 1.5% geometric distance uncertainty from M. J. Reid et al. (2019) as a systematic uncertainty in H0, terms which total 2.2%–4.3% for each method.
An (external) systematic error for each method, sysa and sysb , may describe a relative uncertainty between NGC 4258 and the SN hosts and may (be hoped to) partially cancel if it applies equally to methods a and b (or may have a covariance term to include). The uncertainty in the two-method comparison thus contains three basic terms: the error in the host subsample mean measurements, the uncertainties in each method’s measurements made in NGC 4258, and any relevant (external) systematic error that applies between them. These terms apply separately to both telescopes or methods and thus affect their comparison.
We give illustrative but realistic error budgets for the methods and comparisons in Table 1. For each method, we derive the statistical uncertainties from the measurements in the first and second rungs for an assumption of one anchor (NGC 4258) and ∼10 SN hosts. We also give a systematic uncertainty due to differences between the SN host and NGC 4258 applicable for that method.
Table 1. Representative Error Budget for Comparing Two JWST Distance Method Samples (∼10 Hosts Calibrated to NGC 4258)
| Term | σ(stat) | σ(sys) |
|---|---|---|
| (mag) | ||
| Cepheids | ||
| Method calibration measurement: intercept in NGC 4258 (∼100 Cepheids) | 0.03 | ⋯ |
SN host sample means: intercepts, ![$[\sim \sigma (P-L)/\langle {N}_{\mathrm{Ceph}}{\rangle }^{1/2}]\times {N}_{\mathrm{hosts}}^{-1/2}$](https://content.cld.iop.org/journals/0004-637X/977/1/120/revision3/apjad8c21ieqn6.gif)
| 0.02 | ⋯ |
Systematic between SN hosts and NGC 4258, P–L slope:  (slope), othera (slope), othera
| ⋯ | 0.01–0.05 |
| Cepheid Subtotal | 0.04 | 0.03 |
| TRGB | ||
| Method calibration measurement: TRGB mag in NGC 4258 | 0.04 | ⋯ |
SN host sample means: ∼0.06
| 0.02 | ⋯ |
| Systematic between SN hosts and NGC 4258, intrinsic TRGB variationb | ⋯ | 0.01–0.08 |
| TRGB Subtotal | 0.045 | 0.01–0.08 |
| JAGB | ||
| Method calibration measurement: JAGB mag in NGC 4258 | 0.05 | ⋯ |
SN host sample means: ∼0.06 
| 0.02 | ⋯ |
| Systematic between SN hosts and NGC 4258, intrinsic JAGB Methodc | ⋯ | 0.01–0.10 |
| JAGB Subtotal | 0.055 | 0.01–0.10 |
| Comparison between the two methodsd | 0.06 | ∼0.03–0.10 |
| Total | 0.07–0.12 | |
Notes. An uncertainty budget for the present analysis. Uncertainties are listed separately for each distance method (Cepheids, TRGB, and JAGB), and their individual subtotals are given.
a A mean difference in log P between NGC 4258 and an SN Ia host of ∼0.3 times a slope uncertainty of ∼0.05; “other” leaves room for other choices, but R24 shows a range of <0.03 mag for a wide range of choices. b Term highly dependent on the bands and colors used to measure; the low end would be suitable for I band, where TRGB is least sensitive to metallicity and age, and the high end of the range for NIR. c Level of differences for different measures, e.g., mode versus mean versus median of JAGB LF. d Depends on (a) and (b), which also will impact the weights; optimistic case here.
Download table as: ASCIITypeset image
For a realistic measurement error per host for Cepheids, TRGB, or JAGB of 0.05–0.08 mag, 10 hosts will yield an error in the mean (Equation (5)) of 0.02–0.03 mag. A critical and often-neglected term in a two-method comparison is the measurement error for NGC 4258 (Cepheid P–L intercept or TRGB/JAGB apparent magnitude) for each telescope and method, which does not cancel in the comparison in the way the geometric distance error does. Ideally, NGC 4258 would be the best-measured object, but in practice, this may not occur. For the quality of Cepheid measurements from JWST presented in R24, the uncertainty in the intercept of NGC 4258 using ∼100 Cepheids is 0.02 mag though it appears greater for the CCHP observations (F24, Table 5). For TRGB, we take the measurement error from F24 of 0.035 mag (see Appendix B for further discussion). For JAGB, we take this uncertainty to be 0.05 mag from F24 (Table 5) and reported by L24.
The primary (external) systematic difference in the case of Cepheids derives from the difference in period distribution, together with the uncertainty in the slope of the assumed P–L relation. 15 Metallicity effects largely cancel out, as NGC 4258 and the SN Ia host subsample have very similar measured metallicities; we adopt a common metallicity term of 0.2 mag dex−1, accurate to ∼0.02 mag after application. For a subsample of ∼10 hosts, random uncertainties will depend on the specific targets selected, including the number of Cepheids in each target and the number of epochs observed, which, in turn, impact the P–L scatter; individual uncertainties vary by a factor of a few from target to target. The systematic difference for TRGB is due to intrinsic TRGB variation between the SN hosts and NGC 4258. This is discussed at length by D. Scolnic et al. (2022), J. Wu et al. (2023), and R. I. Anderson et al. (2024) and will be different for TRGB measured in the optical or NIR. We give a range of 0.01–0.08 mag. For JAGB, the range of 0.01–0.10 mag is given owing to the nature of choices in the analysis. As discussed by S. Li et al. (2024b), there are variations up to the 0.1 mag level when applying different statistical techniques (e.g., mode/median).
We find the statistical error from a comparison is likely to be ∼0.06 mag but can range from 0.03 to 0.10 mag for the JWST sample, and the systematic contribution is 0.03–0.1 mag. For each technique, the uncertainty of the measurement for each method in NGC 4258 is the dominant source.
F24 gives uncertainties in two-method comparisons which are a factor of ∼3 smaller than those we derive from their data following standard error propagation (Equation (4) and Table 1). We discuss this further in the Appendix B, where we trace the origin to the nonpropagation of the given measurement uncertainties (or any uncertainty) in the measurements of each distance indicator in NGC 4258.
2.3. Distance Comparisons
We show in Figure 2 and Table 2 a comparison of distance measurements using HST Cepheid observations from R22 and those from other HST and JWST observations/techniques. We use the uncertainties as derived in Table 1 for the comparisons. We find that all techniques are in good accord at the ∼1σ and an average level of ∼0.03 mag.

Figure 2. The main panel compares SN Ia host distances calibrated with NGC 4258 for various distance methods, samples, and telescopes (X-axis) and HST Cepheids (Y-axis). The lower panel shows the differences between these on a per-host basis. The inset shows the mean differences for the whole sample. HST Cepheids are all observed by HST and analyzed by R22 and A. G. Riess et al. (2024); see Table A1 with the mean results given in Table 2. JWST (and specific HST) results can be found either in R24 (corresponding to SH0ES-selected) or F24 (corresponding to CCHP-selected) and computed here from the distances table, Table A2. All measures are in good, ∼1σ, agreement. The largest uncertainties in these comparisons arise from the individual measurements in NGC 4258 and the mean measures of the SN Ia hosts as given in Table 1.
Download figure:
Standard image High-resolution imageTable 2. Comparing SN Ia Host Distances
| Sample | Team | μJWST−μHST | σ |
|---|---|---|---|
| (mag) | (mag) | ||
| HST Cepheids versus JWST Cepheids | |||
| 10 Hosts | CCHP | −0.027 | 0.10 |
| 8 Hosts (D ≤ 25 Mpc) | SH0ES | −0.02 | 0.03 |
| 14 Unique Hosts | Both | −0.02 | 0.03 |
| HST Cepheids versus JWST JAGB | |||
| 7 Hosts (mode) | CCHP | 0.047 | 0.066 |
| 5 Hosts | SH0ES | −0.015 | 0.064 |
| HST Cepheids versus JWST NIR-TRGB | |||
| 10 Hosts | CCHP | 0.032 | 0.056 |
| HST Cepheids versus JWST I-TRGB | |||
| 6 Hosts (D ≤ 25 Mpc) | SH0ES | 0.02 | 0.067 |
| HST Cepheids versus I-TRGB | |||
| 11 Hosts | CCHP | 0.01 | 0.057 |
| HST Cepheids versus HST Miras | |||
| 2 Hosts | −0.08 | 0.078 | |
Note. SH0ES D ≤ 25 Mpc sample includes NGC 4038, M101, and NGC 3447 and excludes NGC 5468 as discussed in text. CCHP distances are from F24 Table 2 and include uncertainties in F24 Table 5. Errors in last column follow from Equation (4) and use the minimum systematic uncertainties listed in Table 1.
Download table as: ASCIITypeset image
When comparing Cepheid measurements from JWST and HST, we see that the mean difference with the CCHP JWST Cepheid sample of 10 hosts is −0.027 ± 0.10 mag, in the sense of JWST being closer. We note that the CCHP measurements are obtained in F115W, a different filter than used with HST, so systematic error cancellation does not apply, which is part of the reason for the relatively large error. See Figure 1 of A. G. Riess et al. (2023b) for sources of P–L dispersion. When we compare to the Cepheid measurements of the eight SH0ES-selected hosts of 11 SNe Ia, we find a mean difference with the HST Cepheids of −0.02 ±0.03 mag. The uncertainty here is smaller owing to 1) Cepheid samples in the SH0ES hosts which are a factor of ∼3 larger, 2) a P–L scatter which is 40% smaller due to the availability of multiple epochs and colors and 3) the matching of wavelength between JWST and HST (and hence the P–L slope). The JWST and HST Cepheid comparisons presented by A. G. Riess et al. (2024) included 15 variants (i.e., choices) including no period limits, P > 15 day limits, steeper and shallower P–L slope, no or double metallicity correction, most crowded and least crowded halves, no phase correction or single random phase, and the use of Cepheid colors (for dereddening) from HST or from JWST NIR or JWST mid-IR. The mean differences ranged from −0.030 to 0.017 mag, with the fluctuations all less than 1σ. We conclude that HST and JWST Cepheid measurements are robustly consistent (which is also true of the individual team samples).
For comparisons between JWST JAGB and HST Cepheids, we measure a difference with the CCHP JWST sample of 0.047 ± 0.066 mag, and for the SH0ES JWST sample we measure a difference of −0.015 ± 0.064 mag, though this can vary between 0.02 and −0.04, depending on whether the JAGB mode, median, or mean statistic is used, which remains an arbitrary choice (S. Li et al. 2024b). L24 finds that if they apply the mean or median instead of the mode, the JAGB distances would decrease (due to the greater skew of NGC 4258); the agreement would then be 0.01 ± 0.055 mag. F24 noted a larger difference of 0.08 mag between Cepheids and JAGB, but the Cepheid reference was their JWST Cepheids, not the HST Cepheids compared here. As discussed in Appendix B, with the measurement errors in NGC 4258 included, even the JWST-to-JWST difference is only 1σ. The CCHP JWST JAGB−Cepheid difference also matches the size and direction of the difference between CCHP JAGB and CCHP HST TRGB in common, 0.07 mag.
When we compare HST Cepheid distances to TRGB, we measure differences of 0.032, 0.02, and 0.01 mag for JWST CCHP, JWST SH0ES, and HST CCHP, respectively, each with a total uncertainty of ∼0.05−0.06 mag. The JWST I-TRGB measurements are presented by S. Li et al. (2024a) and here limited to the six hosts of eight SNe Ia with D ≤ 25 Mpc. All of these comparisons are in good accord at the ∼1σ level.
2.3.1. Cepheid Distance Linearity
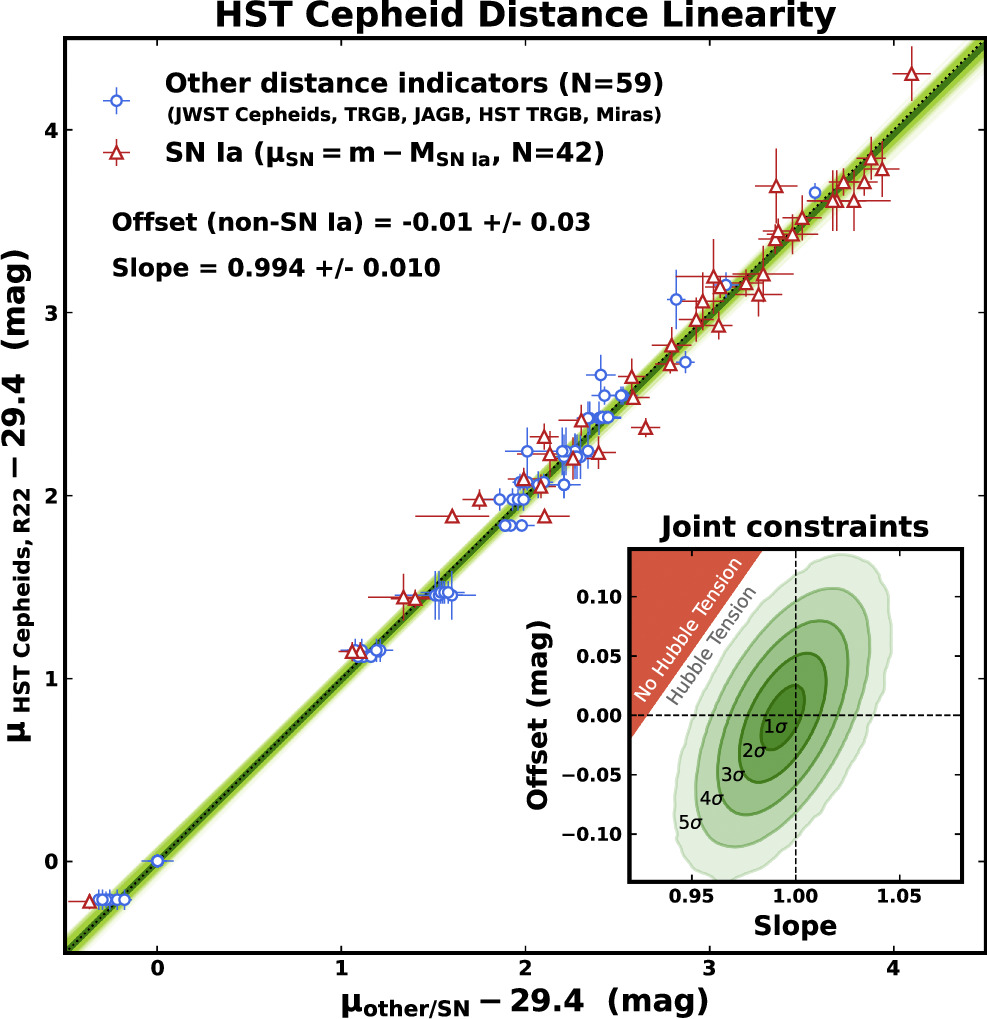
There are 59 independent distance measurements between NGC 4258 and SN Ia hosts in common with the same measured with HST Cepheids (R22; we will refer to here as μHST) that can be used to obtain a new constraint on the linearity of the Cepheid distance measurements—that is, the ratio μHST/μother. In Figure 3, we perform a linear fit, μHST = slope × μother − offset between HST Cepheid distances. We also can simultaneously include the 37 host measures from SNe Ia. For SNe, we replace μother with the SN standardized magnitude ( ) and allow for a unique SN offset, which is
 . It is critical (and we take care) to perform this fit with independent measurements and uncertainties for both axes (i.e., two dimensions and averaging the other methods before comparing to the HST Cepheid result). We find μHST/μother = 0.994 ± 0.010 and an offset of the non-SN data of −0.01 ± 0.03 mag, referenced to μ = 29.4 mag, the geometric distance of NGC 4258. The slope matches unity at 0.6σ, and the offset is consistent with zero. This is the strongest constraint measured for the linearity of HST Cepheid distances, and there is no evidence of a nonlinearity. It is also the strongest constraint on an offset between HST Cepheid distances and all other (non-SN) measures, a precision of 0.02 mag, that is, there is no evidence for either a multiplicative or additive bias in the HST Cepheid distances when compared to all other measures simultaneously.

Figure 3. HST Cepheid distance linearity assessed by comparing to all other indicators. The comparison is a linear fit μHST = slope × μother − offset between each method (non-SN) and HST Cepheids (relative to the distance of NGC 4258, 29.4 mag) with one additional offset term for including SNe (
 ), a total of one linearity term and two offsets. The HST Cepheid linearity is measured to be 0.994 ± 0.010, in good agreement with unity. There is also no evidence of an offset (non-SN) relative to all other indicators, with HST Cepheids in good accord with the mean. In the inset, we show the combined constraint out to 5σ confidence and compared to the region that would be necessary to produce an 0.18 mag mean bias between NGC 4258 and the mean HST SN Ia host, a range of 2.5 mag.
Download figure:
Standard image High-resolution imageA. G. Riess et al. (2022) analyzed the Cepheid distance linearity against only SNe Ia and found it consistent with unity at 1.5σ, but this was a weaker constraint due to the lack of the non-SN distances now available. We note that the additional, non-SN Ia, primary distance indicator data provide a stronger constraint than the SN data alone, owing to the smaller errors of the former per object, about half the size or a 4-to-1 weight advantage.
While there is no evidence for a nonlinearity, the constraint also strongly out rules a nonlinearity as a resolution of the Hubble tension. A nonlinearity would have to produce a change of  mag between the distance of NGC 4258 and the mean HST-calibrated SN Ia host (μ = 29.4 to 31.9), a span of 2.5 magnitudes, or a needed bias of 0.07 magnitudes in distance per magnitude, which is excluded by the constraint at ∼7σ. A combination of multiplicative and additive HST Cepheid bias would require 0.18 = (2.5 × (1 − slope ) + offset), which, as shown in Figure 3, is ruled out well beyond the 5σ confidence contour.
F24 claimed a 3σ correlation by regressing individual HST Cepheid distances from R22, (μHST), versus SN Ia  (i.e., included in the above); however, this correlation appears to be a direct result of including the same (i.e., fully correlated) variable, μHST, in both the dependent and independent axes (which is used to determine an SN
 ). We discuss this in Appendix B.
3.1. Expected Differences in H0 from JWST Subsamples
The measurement of H0 from JWST host subsamples alone will show relatively large variations due to the small number of SNe they contain, coupled to the substantial SN Ia intrinsic scatter. The selection differences and their impacts are illustrated in Figure 4, where we show the difference in H0 we would expect based on the full sample of host HST Cepheid measurements in R22 and the variation introduced by the anchor. These differences due to selection are often referred to as “subsample bias” because they measure how the subsample represents the full sample. The driver of this variation is the inherent scatter in the luminosity of individual SN Ia, 16 which is a factor of 2–3 times larger than the uncertainty in the distance estimate to a typical host. For example, the 10 SNe Ia calibrated with JWST in the CCHP sample and analyzed with the Carnegie Supernova Program (CSP) data, where the intrinsic SN Ia dispersion is found to be 0.19 mag (S. A. Uddin et al. 2023), produce a 1σ uncertainty in H0 of 2.0 km s−1 Mpc−1.

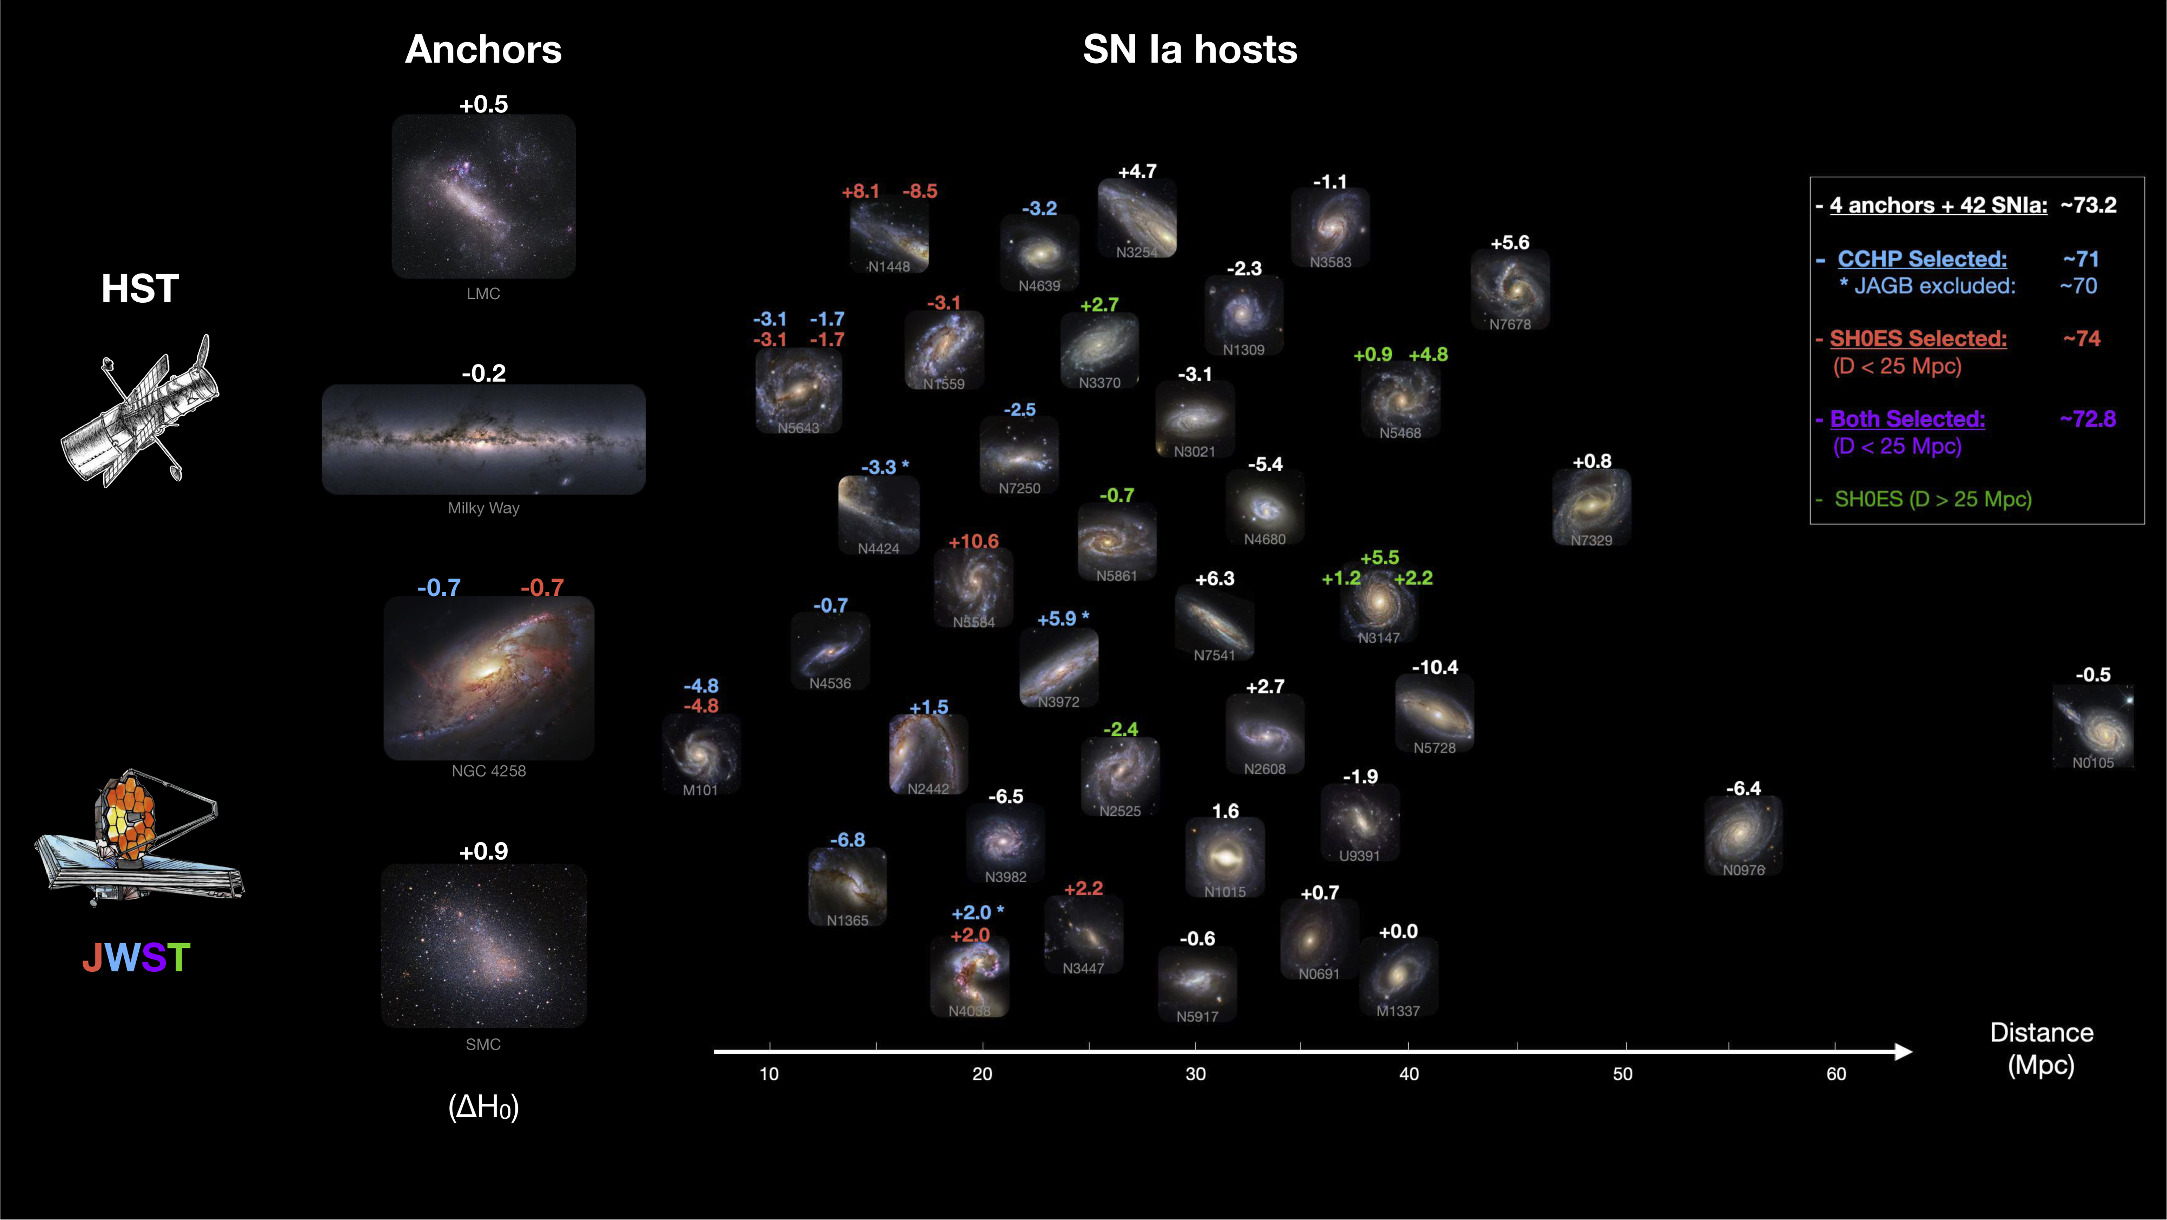
Figure 4. Anchors and SN Ia hosts selected to cross-check HST and JWST distances from the full HST sample of four anchors and 42 SNe Ia. We show the value of H0 indicated by HST alone for each SN Ia. Small samples will produce large fluctuations in the value of H0. (HST also indicates the selection by both teams of the anchor NGC 4258 will produce a lower value of H0 by −0.7 km s−1 Mpc−1.) The JWST subsample selected by each team may be directly compared to the same from HST (i.e., “apples to apples”) without bias, but if used alone to determine H0, the subsample value is seen to be biased with respect to the full HST sample mean with the values calculated from HST Cepheids indicated on the right. A larger sample, both teams combined (red and blue, N = 15 SNe Ia), is found to be minimally biased and nearly complete in distance to D < 25 Mpc.
Download figure:
Standard image High-resolution imageAnother difference in H0 between a JWST-only measurement and the full HST samples results from the availability of anchors. NGC 4258, the sole anchor available for JWST, produces the lowest value of H0 of the four anchors, decreasing H0 from the four-anchor mean of L. Breuval et al. (2024) by ΔH0 ≈ 0.7 km s−1 Mpc−1.
Determining H0 requires the standardized apparent magnitudes of the SN Ia ( ) in the relevant hosts and absolute magnitudes (
 ) determined as
  . For a well-measured mean
  , H0 may be determined from

This is a useful approximation to the empirical calibration for the Pantheon+ SNe Ia sample from R22 (this simplified approximation rather than the full, simultaneous distance-ladder fit including covariance is accurate to ∼0.01 mag). Calibrating all 42 SNe Ia with HST Cepheids and the single anchor, NGC 4258, produces a mean MB = −19.28 mag and H0 = 72.5 ± 1.5 km s−1 Mpc−1, matching fit #10 given by R22.
We now predict differences in H0
due only to the selection of a JWST subsample by comparing the  subsample means determined from the HST Cepheid distances using Equation (6). In Table A1, we list the relevant quantities for the full sample of 42 SNe Ia from R22 as well as the SN Ia host subsamples selected for JWST studies. The comparisons between expected (HST) and actual (JWST) measures of H0 are shown in Figure 5.

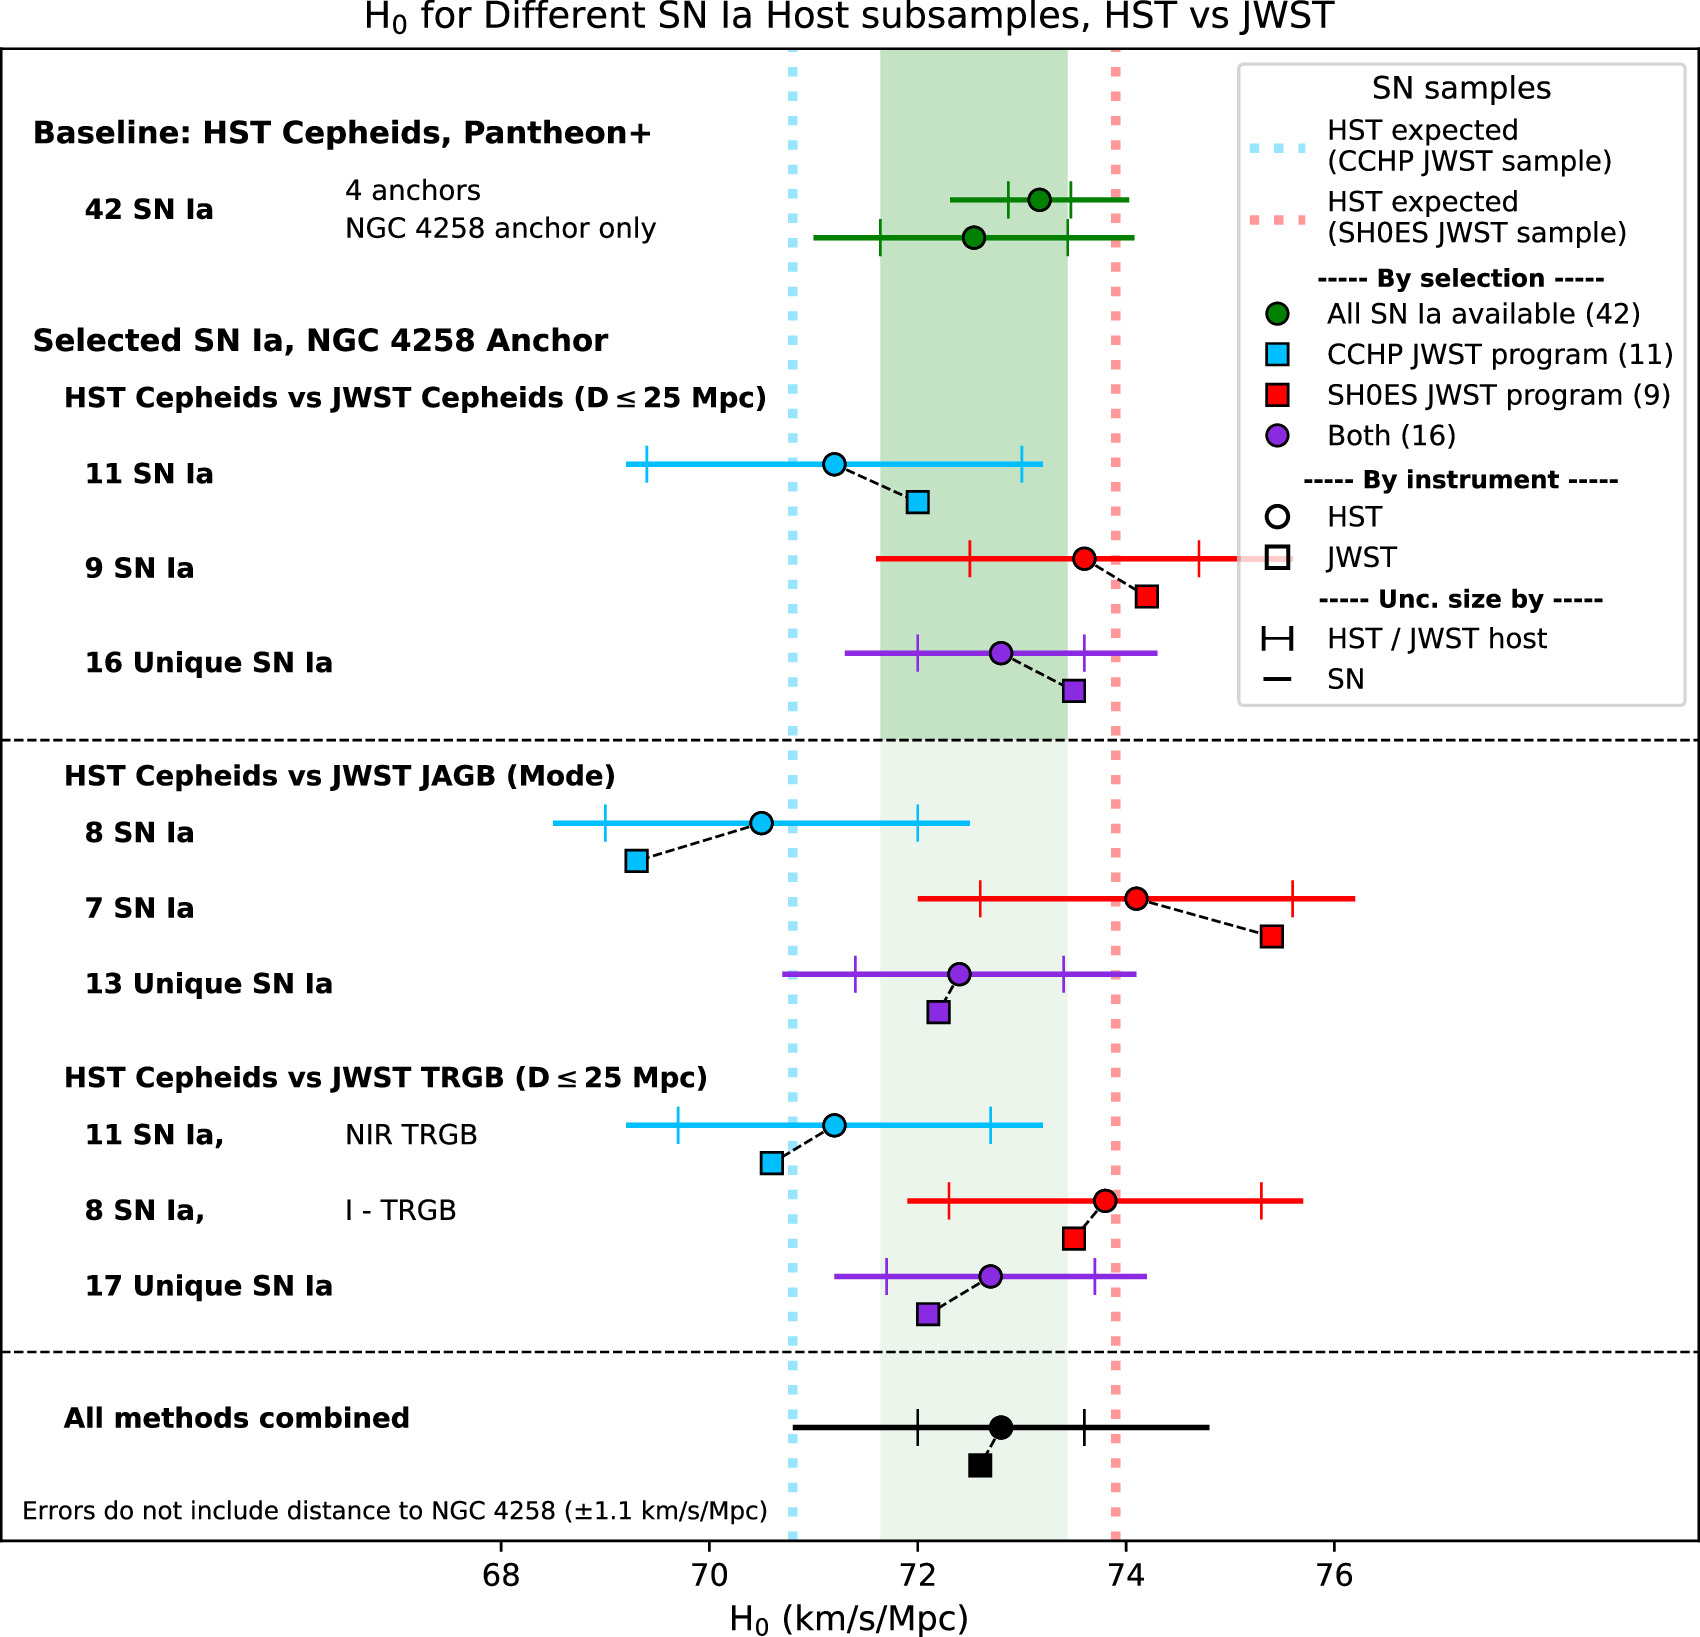
Figure 5. Comparisons of H0 between HST Cepheids and other measures (JWST Cepheids, JWST JAGB, and JWST NIR-TRGB) for SN Ia host subsamples selected by different teams and for the different methods. The top section shows the values for H0 using four geometric anchors and also using only NGC 4258. Below, for each selected subsample (by Team or method), we show the value of H0 based on the HST Cepheid measurements (from R22) and from the JWST distance measurements. The smaller capped error bars indicate the uncertainty from the distance measures between the first-/second-rung distance measure (Cepheids/TRGB/JAGB) alone, and the full error bar includes the SN data. The CCHP and SH0ES subsamples selected for JWST observations produce a large difference of 3–4 km s−1 Mpc−1 in H0 a priori owing to selection. The HST Cepheid and JWST distance measurements themselves are in good agreement.
Download figure:
Standard image High-resolution image3.2. CCHP JWST Sample Difference
For the 10 hosts of 11 SNe Ia selected by the CCHP for JWST observations, HST Cepheids gave  mag (where the uncertainty includes the measurement of NGC 4258, ±0.04 without it) and a corresponding value of H0 = 71.2 km s−1 Mpc−1, thus 2.0 km s−1 Mpc−1 lower than the full HST sample—simply due to the choice of SN hosts and anchor.
An even larger sample difference is expected for the smaller subsample of seven SN Ia hosts for which the CCHP JWST JAGB measurements are provided (L24). A priori, HST Cepheid measurements (see Table 1) find MB = −19.34 ± 0.05 mag and H0 = 70.3 km s−1 Mpc−1 for this JAGB subset, an expected reduction of 3.0 km s−1 Mpc−1 from the full HST sample due to selection. The use of CSP instead of the Pantheon+ SN samples reduces this by another 0.7 km s−1 Mpc−1 according to L24, and the selection of the mode statistic rather than the mean or median reduces H0 by another 1.1 km s−1 Mpc−1. The CCHP JAGB analysis excludes three SN Ia hosts (NGC 3972, 4038, and 4424) from the CCHP sample of 10, and these three excluded objects have a higher expected average, H0 = 75 km s−1 Mpc−1, based on their HST Cepheid measurements; among the three excluded objects are the two with the highest H0 from the CCHP sample (NGC 3972 and 4038).
The subsample chosen for the CCHP JAGB measurements produces an unusual combination of draws from the full HST sample, being both low in H0 and in a very tight cluster, each a ∼2σ level fluctuation. The SN Ia dispersion in MB of the set is uncommonly low at 0.06 mag, less than half the typical SN Ia population dispersion (D. Brout et al. 2022; D. Scolnic et al. 2022). As shown in Figure 6, only ∼5% of randomly selected samples of eight SNe Ia from the 42 yield an HST Cepheid predicted value of H0 this low, and ∼5% of samples have SNe with such a small variation in luminosity. These subsample characteristics seen from HST Cepheid measurements are well matched in the actual JWST JAGB measurements (L24). Because the subsample is unusual a priori, a standard uncertainty propagated to H0 will not account for the uncommonly high difference between this subsample and the full sample mean. This illustrates the greater value of comparing distance measures with one method to distance measures with another for subsamples rather than comparing H0 or SN scatter, which avoids the issue of uncommon or unrepresentative subsamples.
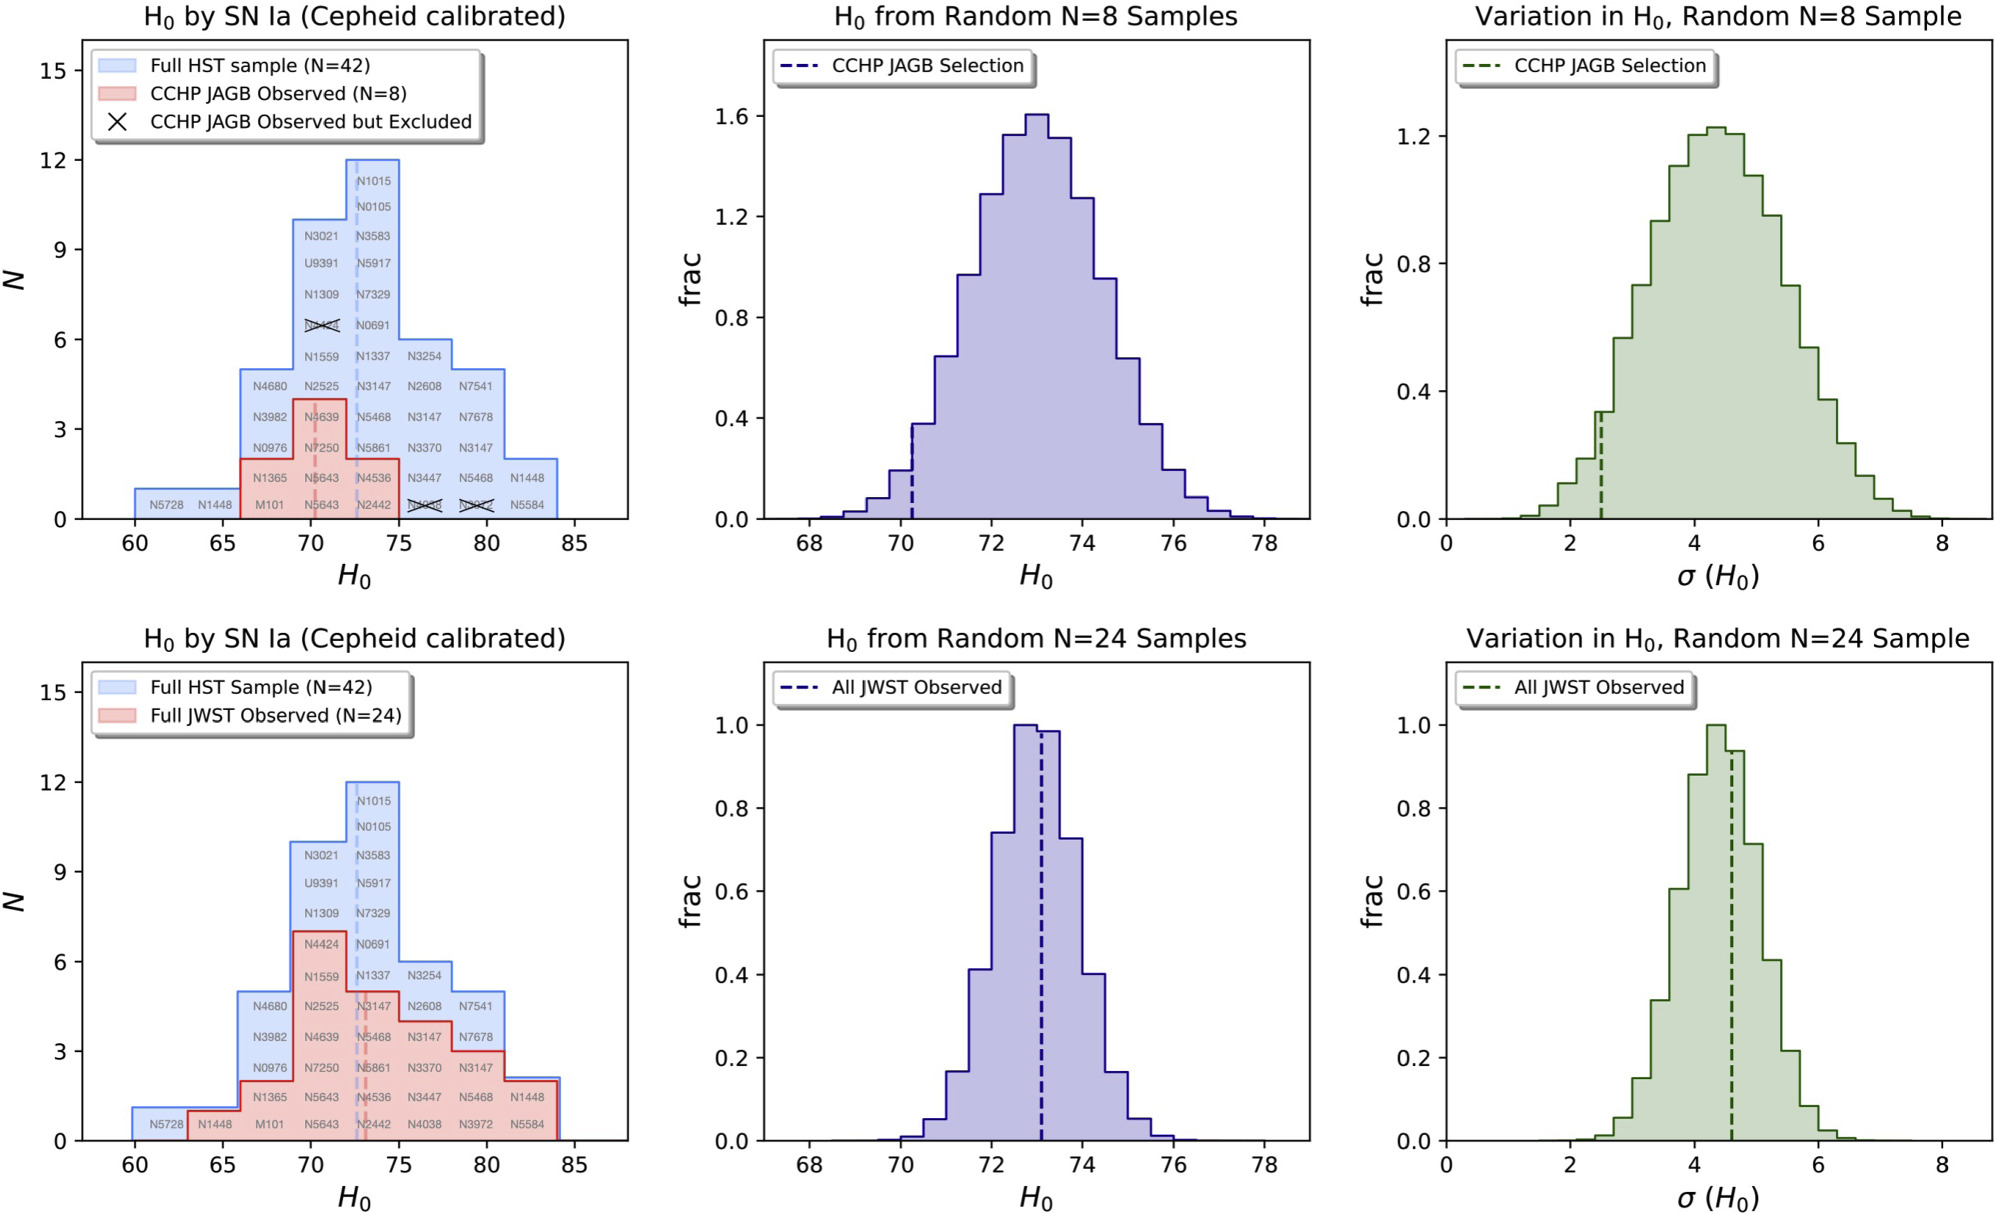
Figure 6. Distribution of H0 values for each calibrator SN Ia as calibrated by HST Cepheids (left panel). The mean of the complete set of 42, in blue, results in H0 = 73 km s−1 Mpc−1, and the standard deviation is a result of SN Ia dispersion with σ of 6% in distance. We show the subsample selected by the CCHP (10 hosts of 11 SNe Ia) and after their exclusion of three hosts for JAGB measurements (top-left panel). The remaining set of eight SNe Ia used for JAGB, in red, are biased low with respect to the mean, with HST Cepheids expecting H0 = 70.5 km s−1 Mpc−1 for this set. Selecting a every unique combination of eight SNe Ia from the original 42 shows the selected JAGB sample to be unusual, both low in H0 (top-middle panel, only 5% are lower) and with little variation in H0 (right panel, only 5% are lower), with <0.1% of samples both lower and tighter. This selection is the primary reason for the low value of H0 from CCHP JAGB, not from a difference in measured distances.
Download figure:
Standard image High-resolution imageThe value of H0 found by F24, which is lower than that of R22, is anticipated by the difference of the selected subsample relative to the HST full sample mean and the exclusion of three galaxies for JAGB measurements (see Figure 2, vertical blue line). F24 reports JWST Cepheids in the CCHP-selected sample give a value of ∼72 km s−1 Mpc−1 and NIR-TRGB ∼70 km s−1 Mpc−1, both near the HST-expected ∼71 km s−1 Mpc−1 for the subsample, and JWST JAGB gives ∼69 km s−1 Mpc−1, near the HST measured for that subsample (with three excluded) of 70.3 km s−1 Mpc−1; see Figure 6, all with the Pantheon+ SN sample. For the combination of these three methods, F24 reports 70 km s−1 Mpc−1, near the HST-expected value of ∼70.8 ± 2.3 km s−1 Mpc−1. In summary, the difference of this selected SN subsample relative to the mean and the exclusion of several hosts for JAGB measurements reduce H0 as expected by the full sample. In Figure 4, we show the individual SN Ia values of H0 for the full HST sample and the differences from anchor choice as a full summary.
For the SH0ES JWST host selection of 11 SNe Ia in eight hosts, HST Cepheids predict  mag and H0 = 73.9 ± 2.3 km s−1 Mpc−1 (or −19.26 mag and 73.6 km s−1 Mpc−1 for nine SNe Ia with D ≤ 25 Mpc). This represents a ∼1σ fluctuation due to the SN selection in the other direction (a higher H0). This compares well with the JWST Cepheid measurement of H0 = 74.2 km s−1 Mpc−1.
The full error bars in Figure 5 include the noise from the small subsample of SN measurements. Thus, for a new measurement with JWST in comparison to HST, the differential errors as given in Table 2 can range from 0.03 to 0.10 mag or from 1 to 3 km s−1 Mpc−1.
3.3. H0 from Joint Samples
To avoid a selection bias relative to the SN Ia population, it is important to define a (combined) sample that is complete to some distance (a common method to avoid magnitude bias and also to avoid the vagaries of human selection). We note that a near-complete sample of SNe Ia (in R22) to D ≤ 25 Mpc with JWST observations is formed by combining both the above SH0ES and CCHP samples for a total of 14 (unique) hosts of 16 SNe Ia, missing only SN 1998aq (NGC 3982) D ≤ 25 Mpc, which neither team targeted. A combined D ≤ 25 Mpc JWST sample excludes one host of two SNe Ia, NGC 5468 from the SH0ES JWST sample, which is at D = 40 Mpc. The CCHP sample of 10 alone does not include hosts of six SNe Ia at distances ≤ 25 Mpc or at distances nearer than that sample's most distant (NGC 4639, μ ≤ 32.0 at 95% confidence): SN 2005df, SN 2007af, SN 2001el, SN 2012ht, SN 2021pit, and SN 1998aq. The merged JWST D ≤ 25 Mpc sample of 16 SNe Ia is also seen to be more representative of the full HST sample of 42 SNe Ia than either group’s selected subsample, an expected consequence of “reversion to the mean” as the samples grow. HST Cepheids predict H0 = 72.9 ± 2.1 km s−1 Mpc−1 for the JWST D ≤ 25 Mpc sample.
For the merged D ≤ 25 Mpc sample of 16 SNe Ia, we find from JWST Cepheids H0 = 73.4 ± 2.0 km s−1 Mpc−1, similar to the HST result from this same sample. The joint sample of JWST JAGB and TRGB measurements yield H0 = 72.2 ± 2.3 km s−1 Mpc−1 and H0 = 72.1 ± 2.3 km s−1 Mpc−1, respectively. The HST Cepheid expectation for the JAGB H0 is somewhat smaller at 72.4 km s−1 Mpc−1 due to the exclusion of several hosts in L24. Finally, we can combine all three methods, which yields H0 = 72.6 ± 2.0 km s−1 Mpc−1, in good agreement with the value expected from HST Cepheids for the same sample of H0 = 72.8 ± 2.0 km s−1 Mpc−1. The uncertainties for this combination are explained in Table 3 and values of H0 and their uncertainties for different sub-samples are in Table 4. For these estimates we used the minimum systematic error listed in Table 1 for each method. For an expanded JWST sample of SN Ia hosts with smaller statistical uncertainty, we would advocate a more comprehensive analysis of systematic uncertainties. When we compare the HST predicted values of H0 to those found with JWST measurements, we find the values inferred using JWST are consistent with expectations for every subsample. We can see that the measured values are at or within 1σ of these smaller uncertainties, i.e., between HST and JWST excluding SNe, for each comparison set. We reiterate that the HST expectations above all come from the use of NGC 4258 as a single anchor, yielding lower values of H0 by 0.5 than the three anchor calibrations in R22.
Table 3. H0 Error Budget for ∼10 SNe Ia Measured with JWST by Three Methods Calibrated by NGC 4258
| Term | σ(stat) | σ(sys) |
|---|---|---|
| (mag) | ||
| Cepheid subtotal (see Table 1) | 0.04 | 0.03 |
| TRGB subtotal (see Table 1) | 0.045 | 0.01–0.08 |
| JAGB subtotal (see Table 1) | 0.055 | 0.01–0.10 |
| Combining three methods | 0.02 | ∼0.02 |
| Common uncertainties, independent of distance method | ||
| First rung: geometric distance to NGC 4258 | ⋯ | 0.032 |
Second rung: SN distances to hosts,a (0.13–0.17)
| 0.043–0.056 | ⋯ |
| Third rung: SNe Ia in Hubble flow | ⋯ | 0.01 |
| Common uncertainty subtotal | 0.047–0.059 | 0.04 |
| Cepheids and common total | 0.068–0.075 | 0.044 |
| TRGB and common total | 0.065–0.072 | 0.044 |
| JAGB and common total | 0.065–0.072 | 0.044 |
| Three methods and common total | 0.052–0.063 | 0.044 |
| Three-method stat+sys error in H0: 0.062–0.072 mag or 2.0–2.3 km s−1 Mpc−1; | ||
| Individual methods ∼2.5 km s−1 Mpc−1 | ||
Note. An uncertainty budget for the present analysis. Uncertainties are listed separately for each distance method (Cepheids, TRGB, and JAGB), and their individual subtotals are given. We derive the uncertainties when combining the three which we label “Three methods.” A separate list of uncertainties, which are common to each distance method (e.g., the uncertainties from SN measurements), are also given. Finally, we combine the averaged uncertainty with the common uncertainty to derive a total H0 uncertainty.
a Pantheon + SN sample D. Brout et al. (2022) has a mean per SN Ia error of 0.13 mag; CSP SN sample (S. A. Uddin et al. 2023) finds σint = 0.17 per SN for CSP I and II.
Download table as: ASCIITypeset image
Table 4. Comparison of Measured and Expected Values of H0 (with Pantheon+ SN)
| Sample | Telescope | H0 | σ(H0) | ||
|---|---|---|---|---|---|
| Total | HST/JWST | ||||
| Baseline: HST Cepheids, Pantheon+ | |||||
| 42 SN Ia | 4 Anchors | HST | 73.17 | 0.86 | 0.30 |
| 42 SN Ia | NGC 4258 Anchor | HST | 72.54 | 1.54 | 0.90 |
| JWST Cepheids Measured and HST Cepheid Expected | |||||
| 11 SN Ia | CCHP Selected | HST | 71.2 | ||
| JWST | 72.0 | 2.4 | 1.8 | ||
| 9 SN Ia | SH0ES Selected | HST | 73.6 | ||
| (D ≤ 25 Mpc) | JWST | 74.2 | 2.3 | 1.1 | |
| 16 SN Ia | Both Unique SN | HST | 72.9 | ||
| (D ≤ 25 Mpc) | JWST | 73.4 | 2.1 | 1.1 | |
| JWST JAGB (Mode) and HST Cepheid Expected | |||||
| 8 SN Ia | CCHP Selected | HST | 70.3 | ||
| mode | JWST | 68.9 | 2.4 | 1.5 | |
| mean/median | JWST | 70.0 | 2.4 | 1.5 | |
| 7 SN Ia | SH0ES Selected | HST | 74.1 | ||
| JWST | 75.4 | 3.1 | 1.5 | ||
| 13 SN Ia | Both Unique SN | HST | 72.4 | ||
| JWST | 72.2 | 2.3 | 1.3 | ||
| JWST NIR-TRGB and HST Cepheid Expected | |||||
| 11 SN Ia | CCHP Selected | HST | 71.2 | ||
| JWST | 70.1 | 2.4 | 1.5 | ||
| JWST I-TRGB (D ≤ 25 Mpc) and HST Cepheid Expected | |||||
| 8 SN Ia | SH0ES Selected | HST | 73.8 | ||
| JWST | 73.5 | 2.4 | 1.5 | ||
| 17 SN Ia | Both Unique SN | HST | 72.7 | ||
| JWST | 72.1 | 2.2 | 1.2 | ||
| JWST All Methods (D ≤ 25 Mpc) and HST Cepheid Expected | |||||
| 13–17 SN Ia | All | HST | 72.8 | ||
| JWST | 72.6 | 2.0 | 1.0 | ||
Note. Subsample uncertainties do not include 1.1 km s−1 Mpc−1 error from maser distance to NGC 4258.
Download table as: ASCIITypeset image
For the merged sample, the averaging of distance methods occurs before the use of SN data to avoid double counting. 17 It is interesting to examine the much larger sample of all SN Ia hosts observed to date with JWST, which includes 24 of the 42 HST SNe Ia. The full SN sample with JWST observations (to date) is highly representative of the HST SN sample as shown in Figure 6 in terms of expected H0 and variance with little sample bias. When increasing the number of SN hosts, we can see from the widths of the middle panels in Figure 6 how the second-rung uncertainty from SNe will decrease. The impact of selection when comparing HST and JWST will diminish with the growing samples.
A complete JWST ladder, still “under construction,” is necessarily weaker than the one built by HST over decades as it is limited to a single anchor rather than four (L. Breuval et al. 2024), resulting in less precision, loss of redundancy, and a reduction in resolution of the tension at inception. Limiting the HST ladder to the same single anchor as JWST, NGC 4258, results in H0 = 72.5 ± 1.5 km s−1 Mpc−1 (R22), a reduction of the tension to 3σ before any comparison with JWST. Limiting to one anchor and the 17 SNe Ia at D < 25 Mpc trivially further reduces the significance of the tension, H0 = 72.3 ± 1.8 km s−1 Mpc−1, but only masks the tension rather than offering any explanation. The situation is illustrated in Figure 7. While JWST is enormously powerful for checking HST distances, it only weakly constrains the tension due to its lack of statistics from SNe and anchors.
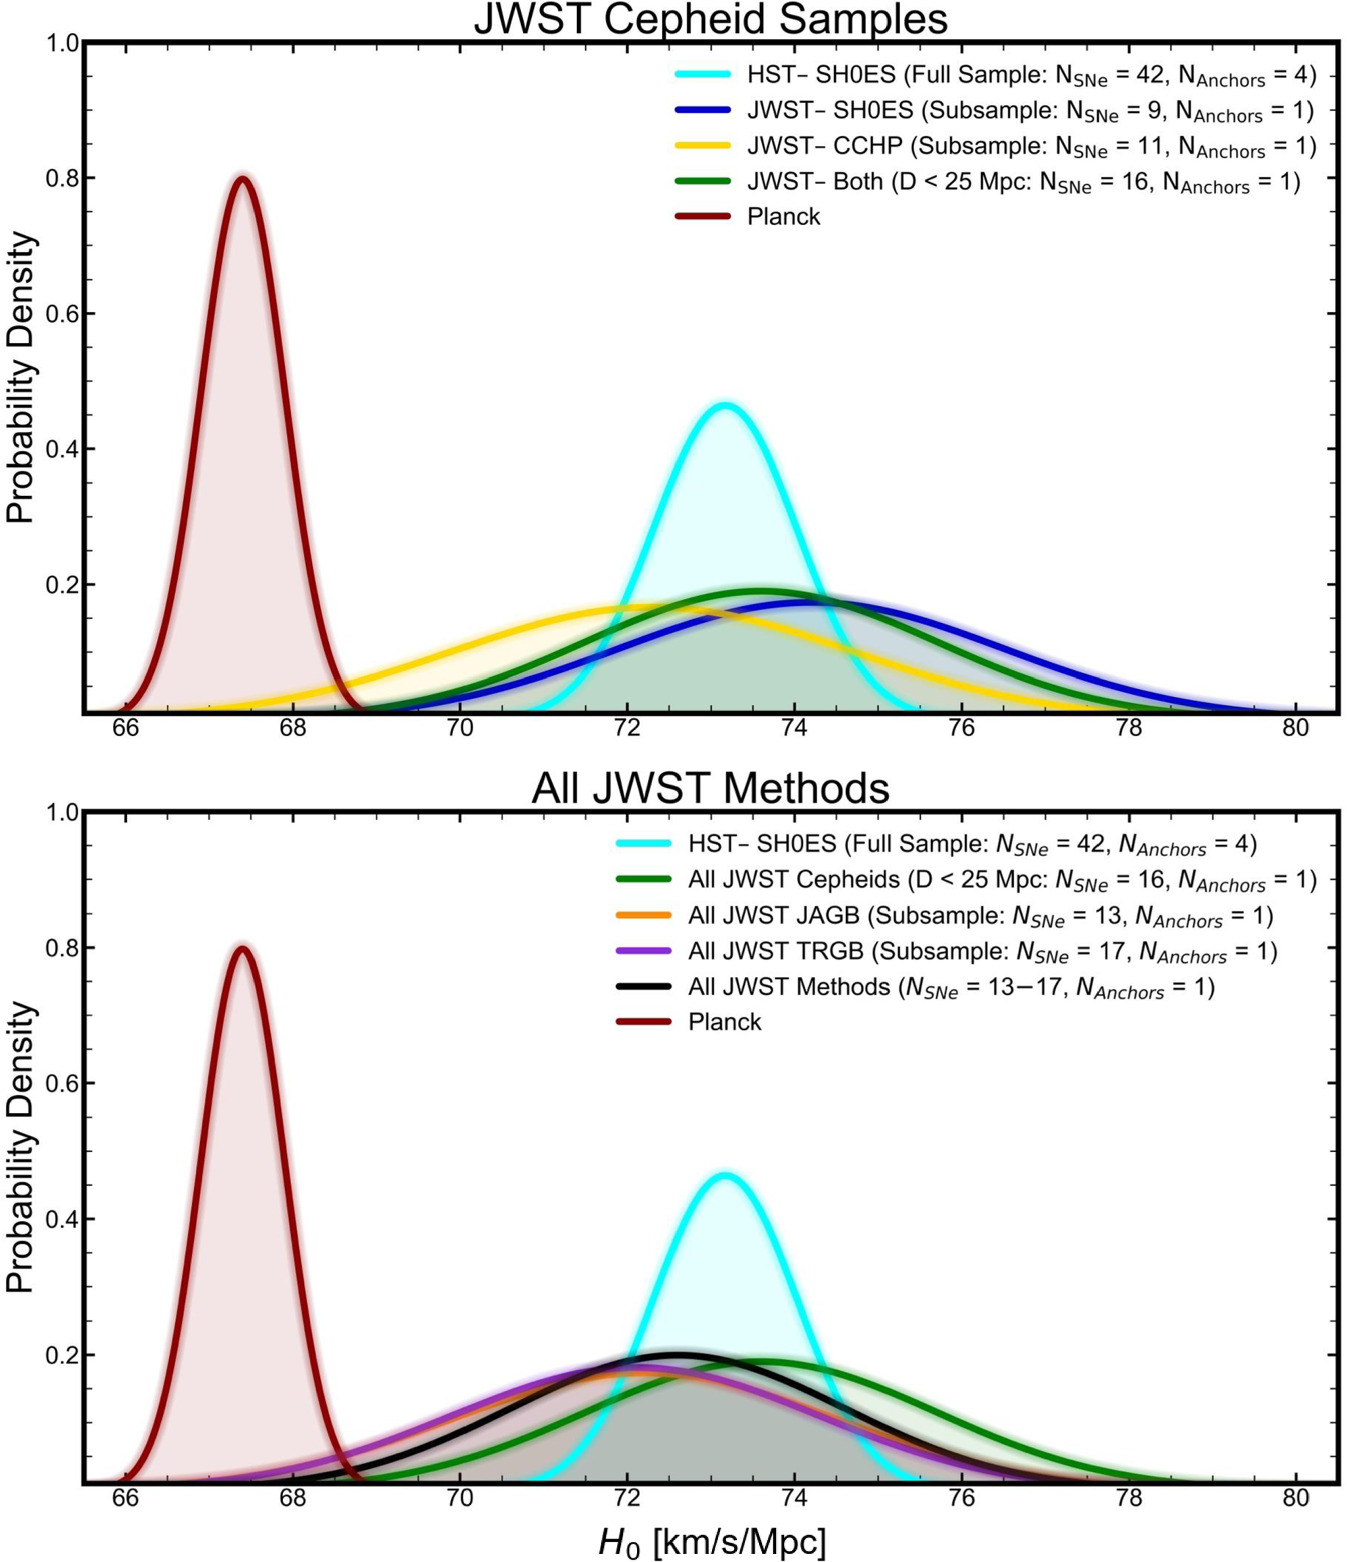
Figure 7. Comparisons of H0 between HST Cepheids and other subsamples of JWST Cepheids and anchors.
Download figure:
Standard image High-resolution imageSimply summarized, JWST offers the means to test HST on the second rung, but given their demonstrated consistency, there is no reason not to use the full HST ladder—its SN sample is complete, it has superior statistics, and it uses multiple redundant anchors to measure H0. However, the expanding JWST sample will gradually remedy the disparity. We show here that a combination of all JWST subsamples is already nearly complete to D ≤ 25 Mpc, reaches 40% of the HST SN sample, and reduces the a priori bias, an expected consequence of reversion to the mean of larger samples.
Finally, we remark that the present circumstance is not unusual in observational cosmology; a comparable situation was seen for CMB measurements. The South Pole Telescope (SPT) has measured CMB fluctuations on finer angular scales than Planck but over smaller patches of the sky, including 2500 deg2 in the initial SPT-Sunyaev-Zeldovich survey (K. T. Story et al. 2013), and 500 deg2 for the SPTpol survey (J. W. Henning et al. 2018). Fitting the ΛCDM model to these data sets, the SPT team found H0 = 75.0 ± 3.5 and 71.3 ± 2.1 km s−1 Mpc−1, respectively, higher than the Planck constraints and in good agreement with the SH0ES distance ladder. However, where the SPT and Planck measurements were directly comparable (i.e., on the SPT patch, for the range of angular scales accessible to both instruments), they were found to agree well with one another, with a null-test probability to exceed of 0.30 (Z. Hou et al. 2018). The conclusion, therefore, was not that the SPT data indicated a problem with the full-sky Planck data or vice versa but that the SPT data provided a valuable new consistency check of the Planck measurements, which was passed, and that the SPT H0 results differed from the Planck results because of sample variance on that patch of sky (i.e., it was not exactly representative of the full sky).
Future data might help resolve the Hubble tension problem but not simply by yielding a high or low value of H0 (or even an intermediate result). Instead, we think it will be necessary to understand why different types of measurements have yielded inconsistent results for a decade. If there is an observational or data analysis error with the CMB or local distance ladder, it is far from clear what it might be. Studies that provide consistency tests are an important part of seeking a solution. Measurements from two different CMB space missions agree (G. E. Addison et al. 2018), ruling out a number of potential candidate causes of an erroneous Hubble constant. The community-wide effort to seek cosmological solutions to the tension are valuable but so far have largely demonstrated the difficulty in explaining the tension. Whatever the explanation, it seems fair to say that it is elusive and that we, as a community, are missing something.
A major success of the first years of JWST has been its ability to provide a number of cross-checks on the local distance ladder as measured using HST. In this paper, we surveyed measurements using HST and JWST with multiple techniques including Cepheids, TRGB, and JAGB to search for any systematic biases in these measurements. We find that HST Cepheid measurements are consistent at the 0.03 mag and 1σ level with all other techniques from the two telescopes. By comparing all distance indicators to common hosts, HST Cepheids versus others, we find the strongest constraint to date on the linearity in the HST Cepheid measurements, 0.994 ± 0.010, with no significant evidence of nonlinearity, and more than 5σ from either a multiplicative or additive bias needed to resolve the Hubble tension. We show that different values found for H0 based solely on JWST can be traced to differences in the small samples of SN hosts (and their SNe) and anchors selected for early JWST observations. When combining all the JWST measurements for each technique, we find 73.4 ± 2.1, 72.2 ± 2.2, and 72.1 ± 2.2 km s−1 Mpc−1 for JWST Cepheids, JAGB, and TRGB, respectively. When we combine all the methods (but each SN measurement included only once), we determine H0 = 72.6 ± 2.0 km s−1 Mpc−1, in good agreement with 72.8 km s−1 Mpc−1 that HST Cepheids would yield for the same sample. While it will still take multiple years for the JWST sample of SN hosts to be as large as the HST sample, we show that the current JWST measurements have already ruled out systematic biases from the first rungs of the distance ladder at a much smaller level than the Hubble tension.
We are indebted to all of those who spent years and even decades bringing JWST to fruition. This research has made use of NASA's Astrophysics Data System. D.S. is supported by Department of Energy grant DE-SC0010007, the David and Lucile Packard Foundation, the Templeton Foundation and Sloan Foundation. G.S.A. acknowledges financial support from JWST GO-1685 and GO-2875. C.D.H. acknowledges financial support from HST GO-16744 and GO-17312. A.V.F. is grateful for support from the Christopher R. Redlich Fund and many other donors.
If something does not make sense, please email ariess@stsci.edu with questions.
Here we include all the distance measurements discussed in this paper from W. L. Freedman (2021), A. G. Riess et al. (2022), S. Li et al. (2024a, 2024b), F24, and others. They are presented in Tables A1 and A2.
Table A1. Mean SN Ia  Derived from Subsamples Calibrated by HST Cepheids, NGC 4258, and Pantheon+ (R22)
| Host | μCeph | σ | SN |

| σ |

| σ | H0 | σ |
|---|---|---|---|---|---|---|---|---|---|
| (mag) | (mag) | (mag) | (mag) | (km s−1 Mpc−1) | |||||
| N4258 | 29.398 | 0.025 a | ⋯ | ⋯ | ⋯ | ⋯ | ⋯ | ⋯ | ⋯ |
| CCHP JWST-selected Targets, N = 11 | |||||||||
| N7250 | 31.642 | 0.130 | 2013dy | 12.283 | 0.178 | −19.357 | 0.222 | ||
| N4536 | 30.870 | 0.061 | 1981B | 11.551 | 0.133 | −19.320 | 0.147 | ||
| N3972 b | 31.644 | 0.096 | 2011by | 12.548 | 0.094 | −19.103 | 0.136 | ||
| N4424 b | 30.854 | 0.133 | 2012cg | 11.487 | 0.192 | −19.376 | 0.236 | ||
| N4639 | 31.823 | 0.091 | 1990N | 12.454 | 0.124 | −19.373 | 0.155 | ||
| N4038 b | 31.612 | 0.121 | 2007 sr | 12.409 | 0.106 | −19.212 | 0.164 | ||
| M101 | 29.188 | 0.055 | 2011fe | 9.7800 | 0.115 | −19.421 | 0.127 | ||
| N2442 | 31.459 | 0.073 | 2015F | 12.234 | 0.082 | −19.230 | 0.111 | ||
| N1365 | 31.378 | 0.061 | 2012fr | 11.900 | 0.092 | −19.478 | 0.112 | ||
| N5643 | 30.553 | 0.063 | 2013aa | 11.252 | 0.079 | −19.322 | 0.101 | ||
| N5643 | 30.553 | 0.063 | 2017cbv | 11.208 | 0.074 | −19.366 | 0.097 | ||
| Mean | −19.32 | 0.05 | 71.2 | 2.0 | |||||
| For JAGB (N = 8): Mean | −19.34 | 0.05 | 70.3 | 2.0 | |||||
| SH0ES JWST-selected/System Targets, N = 11 | |||||||||
| N1559 | 31.500 | 0.071 | 2005df | 12.141 | 0.086 | −19.367 | 0.112 | ||
| N1448 | 31.298 | 0.051 | 2001el | 12.254 | 0.136 | −19.046 | 0.146 | ||
| N1448 | 31.298 | 0.051 | 2021pit | 11.752 | 0.200 | −19.548 | 0.207 | ||
| N5584 | 31.766 | 0.062 | 2007af | 12.804 | 0.079 | −18.963 | 0.102 | ||
| N5643 | 30.553 | 0.063 | 2013aa | 11.252 | 0.079 | −19.322 | 0.101 | ||
| N5643 | 30.553 | 0.063 | 2017cbv | 11.208 | 0.074 | −19.366 | 0.097 | ||
| N5468 | 33.127 | 0.082 | 1999cp | 13.880 | 0.080 | −19.248 | 0.116 | ||
| N5468 | 33.127 | 0.082 | 2002cr | 13.993 | 0.072 | −19.135 | 0.111 | ||
| N4038 b | 31.612 | 0.121 | 2007 sr | 12.409 | 0.106 | −19.212 | 0.164 | ||
| N3447 | 31.947 | 0.049 | 2012ht | 12.736 | 0.089 | −19.213 | 0.102 | ||
| M101 c | 29.188 | 0.055 | 2011fe | 9.7800 | 0.115 | −19.421 | 0.127 | ||
| Mean | −19.25 | 0.05 | 73.9 | 2.0 | |||||
| Mean all JWST D ≤ 25 Mpc, 16 SNe Ia | −19.27 | 0.04 | 72.8 | 1.8 | |||||
| SH0ES JWST Cycle 2 Observed | |||||||||
| N2525 | 32.059 | 0.105 | 2018gv | 12.728 | 0.074 | −19.344 | 0.130 | ||
| N3370 | 32.132 | 0.062 | 1994ae | 12.937 | 0.082 | −19.196 | 0.104 | ||
| N5861 | 32.232 | 0.105 | 2017erp | 12.945 | 0.107 | −19.294 | 0.152 | ||
| N3147 | 33.173 | 0.163 | 2021hpr | 13.843 | 0.159 | −19.358 | 0.230 | ||
| N3147 | 33.173 | 0.163 | 1997bq | 13.821 | 0.141 | −19.380 | 0.218 | ||
| N3147 | 33.173 | 0.163 | 2008fv | 13.936 | 0.200 | −19.264 | 0.260 | ||
| Mean of all JWST observed, 24 SNe Ia | −19.26 | 0.03 | 73.1 | 1.6 | |||||
| Remaining HST Subsample | |||||||||
| N3021 | 32.473 | 0.162 | 1995al | 13.114 | 0.116 | −19.368 | 0.203 | ||
| N1309 | 32.552 | 0.069 | 2002fk | 13.209 | 0.082 | −19.345 | 0.108 | ||
| N3982 | 31.736 | 0.080 | 1998aq | 12.252 | 0.078 | −19.484 | 0.113 | ||
| N1015 | 32.691 | 0.077 | 2009ig | 13.350 | 0.094 | −19.346 | 0.123 | ||
| N5917 | 32.377 | 0.125 | 2005cf | 13.079 | 0.095 | −19.297 | 0.160 | ||
| U9391 | 32.861 | 0.075 | 2003du | 13.525 | 0.084 | −19.335 | 0.114 | ||
| N3583 | 32.814 | 0.087 | ASASSN-15so | 13.509 | 0.093 | −19.308 | 0.129 | ||
| N2608 | 32.620 | 0.158 | 2001bg | 13.443 | 0.166 | −19.191 | 0.232 | ||
| N7541 | 32.512 | 0.124 | 1998dh | 13.418 | 0.128 | −19.095 | 0.181 | ||
| N0691 | 32.838 | 0.114 | 2005W | 13.602 | 0.139 | −19.250 | 0.182 | ||
| N3254 | 32.343 | 0.084 | 2019np | 13.201 | 0.074 | −19.141 | 0.114 | ||
| N5728 | 33.101 | 0.208 | 2009Y | 13.514 | 0.115 | −19.607 | 0.242 | ||
| N7678 | 33.196 | 0.157 | 2002dp | 14.090 | 0.093 | −19.113 | 0.187 | ||
| M1337 | 33.060 | 0.121 | 2006D | 13.655 | 0.106 | −19.406 | 0.164 | ||
| N4680 | 32.609 | 0.208 | 1997bp | 13.173 | 0.205 | −19.440 | 0.296 | ||
| N7329 | 33.252 | 0.122 | 2006bh | 14.030 | 0.079 | −19.248 | 0.146 | ||
| N0976 | 33.719 | 0.153 | 1999dq | 14.250 | 0.103 | −19.475 | 0.188 | ||
| N0105 | 34.538 | 0.252 | 2007A | 15.250 | 0.133 | −19.290 | 0.292 | ||
| Mean of all unique 42 SNe Ia | −19.28 | 0.03 | 72.5 | 1.5 | |||||
Note.
a
Includes intercept uncertainty from Cepheid sample and tie to NGC 4258 sample with different mean period; see Table 3.
b
Hosts excluded by CCHP JAGB analysis.
c
JWST program GO-2581.
d
JWST program GO-4087. Sample errors in mean include measurement errors for NGC 4258 but not geometric distance error of 0.032 mag. H0 follows from  with Pantheon+ SNe as 5 log(H
 .
.
A machine-readable version of the table is available.
Download table as: Machine-readable (MRT)Typeset image
Table A2. Distance Moduli for Comparison
| HST Cepheids | JWST Cepheids | JWST TRGB | HST TRGB | JWST JAGB | Miras | |||||||||||||
|---|---|---|---|---|---|---|---|---|---|---|---|---|---|---|---|---|---|---|
| Host | R22 | err | CCHP | err | SH0ES | err | CCHP | err | SH0ES | err | F21 | err | CCHP | err | SH0ES | err | H24 | err |
| N4258 | 29.4 | 0.025 | 29.4 | 0.087 | 29.4 | 0.03 | 29.4 | 0.035 | 29.4 | 0.05 | 29.4 | 0.04 | 29.4 | 0.05 | 29.4 | 0.05 | 29.4 | 0.04 |
| M101 | 29.188 | 0.055 | 29.14 | 0.08 | 29.12 | 0.03 | 29.18 | 0.04 | ⋯ | ⋯ | 29.08 | 0.04 | 29.22 | 0.04 | ⋯ | ⋯ | 29.1 | 0.06 |
| N1309 | 32.552 | 0.069 | ⋯ | ⋯ | ⋯ | ⋯ | ⋯ | ⋯ | ⋯ | ⋯ | 32.49 | 0.07 a | ⋯ | ⋯ | ⋯ | ⋯ | ⋯ | ⋯ |
| N1365 | 31.378 | 0.061 | 31.26 | 0.1 | ⋯ | ⋯ | 31.33 | 0.07 | ⋯ | ⋯ | 31.36 | 0.05 | 31.39 | 0.04 | ⋯ | ⋯ | ⋯ | ⋯ |
| N1448 | 31.298 b | 0.051 | ⋯ | ⋯ | 31.289 | 0.03 | ⋯ | ⋯ | 31.38 | 0.07 | 31.32 | 0.06 | ⋯ | ⋯ | 31.29 | 0.04 | ⋯ | ⋯ |
| N1559 | 31.500 b | 0.071 | ⋯ | ⋯ | 31.371 | 0.03 | ⋯ | ⋯ | 31.5 | 0.05 | ⋯ | ⋯ | ⋯ | ⋯ | 31.39 | 0.04 | 31.41 | 0.08 |
| N2442 | 31.459 | 0.073 | 31.47 | 0.09 | ⋯ | ⋯ | 31.61 | 0.09 | ⋯ | ⋯ | ⋯ | ⋯ | 31.61 | 0.04 | ⋯ | ⋯ | ⋯ | ⋯ |
| N2525c | 32.059 | 0.11 | ⋯ | ⋯ | ⋯ | ⋯ | ⋯ | ⋯ | 31.81 | 0.08 | ⋯ | ⋯ | ⋯ | ⋯ | ⋯ | ⋯ | ⋯ | ⋯ |
| N3021 | 32.473 | 0.162 | ⋯ | ⋯ | ⋯ | ⋯ | ⋯ | ⋯ | ⋯ | ⋯ | 32.22 a | 0.05 | ⋯ | ⋯ | ⋯ | ⋯ | ⋯ | ⋯ |
| N3370 | 32.130 | 0.06 | ⋯ | ⋯ | ⋯ | ⋯ | ⋯ | ⋯ | ⋯ | ⋯ | 32.27 a | 0.05 | ⋯ | ⋯ | ⋯ | ⋯ | ⋯ | ⋯ |
| N3447 | 31.947 | 0.05 | ⋯ | ⋯ | 31.95 | 0.03 | ⋯ | ⋯ | 31.92 | 0.09 | ⋯ | ⋯ | ⋯ | ⋯ | 31.85 | 0.07 | ⋯ | ⋯ |
| N3972 | 31.644 | 0.096 | 31.67 | 0.1 | ⋯ | ⋯ | 31.74 | 0.07 | ⋯ | ⋯ | ⋯ | ⋯ | ⋯ | ⋯ | ⋯ | ⋯ | ⋯ | ⋯ |
| N4038 | 31.612 | 0.121 | 31.7 | 0.12 | 31.67 | 0.035 | 31.61 | 0.08 | ⋯ | ⋯ | 31.68 | 0.05 | ⋯ | ⋯ | ⋯ | ⋯ | ⋯ | ⋯ |
| N4424 | 30.854 | 0.133 | 30.91 | 0.22 | ⋯ | ⋯ | 30.93 | 0.05 | ⋯ | ⋯ | 31.0 | 0.06 | ⋯ | ⋯ | ⋯ | ⋯ | ⋯ | ⋯ |
| N4536 | 30.870 | 0.061 | 30.95 | 0.12 | ⋯ | ⋯ | 30.94 | 0.06 | ⋯ | ⋯ | 30.96 | 0.05 | 30.98 | 0.03 | ⋯ | ⋯ | ⋯ | ⋯ |
| N4639 | 31.823 | 0.091 | 31.8 | 0.12 | ⋯ | ⋯ | 31.75 | 0.07 | ⋯ | ⋯ | ⋯ | ⋯ | 31.74 | 0.04 | ⋯ | ⋯ | ⋯ | ⋯ |
| N5468 | 33.127 b | 0.082 | ⋯ | ⋯ | 32.975 | 0.03 | ⋯ | ⋯ | ⋯ | ⋯ | ⋯ | ⋯ | ⋯ | ⋯ | ⋯ | ⋯ | ⋯ | ⋯ |
| N5584 | 31.766 b | 0.062 | ⋯ | ⋯ | 31.838 | 0.03 | ⋯ | ⋯ | 31.81 a | 0.09 | 31.82 | 0.1 | ⋯ | ⋯ | 31.85 | 0.04 | ⋯ | ⋯ |
| N5643 | 30.553 b | 0.063 | 30.51 | 0.08 | 30.52 | 0.03 | 30.61 | 0.07 | 30.56 | 0.06 | 30.475 | 0.08 | 30.59 | 0.04 | 30.49 | 0.04 | ⋯ | ⋯ |
| N7250 | 31.642 | 0.13 | 31.41 | 0.12 | ⋯ | ⋯ | 31.62 | 0.04 | ⋯ | ⋯ | ⋯ | ⋯ | 31.6 | 0.08 | ⋯ | ⋯ | ⋯ | ⋯ |
Note.
a The HST TRGB distances given in F21 for NGC 1309, 3021, 3370, and 5584, all at the far end of the measurable range, are contentious as G. S. Anand et al. (2022) have reanalyzed them and could not detect the TRGB. We include them here to keep the F21 sample complete. b R24 Table 3 refit R22 HST Cepheids to a common P–L slope with JWST at the same wavelength to negate common error. These HST distance-modulus values (mag) improve the Cepheid comparison with JWST and are N5643, 30.518 ±0.033; N5584, 31.828 ±0.037; N1559, 31.473 ±0.045; N1448, 31.236 ±0.034; and N5468, 33.058 ±0.052. c N2525 qualifies for the D < 25 Mpc TRGB sample based on its distance. The uncertainties for the CCHP JWST measures in NGC 4258 were derived from Table 5 in F24 after removing the 1.5% geometric distance uncertainty.
A machine-readable version of the table is available.
Download table as: Machine-readable (MRT)Typeset image
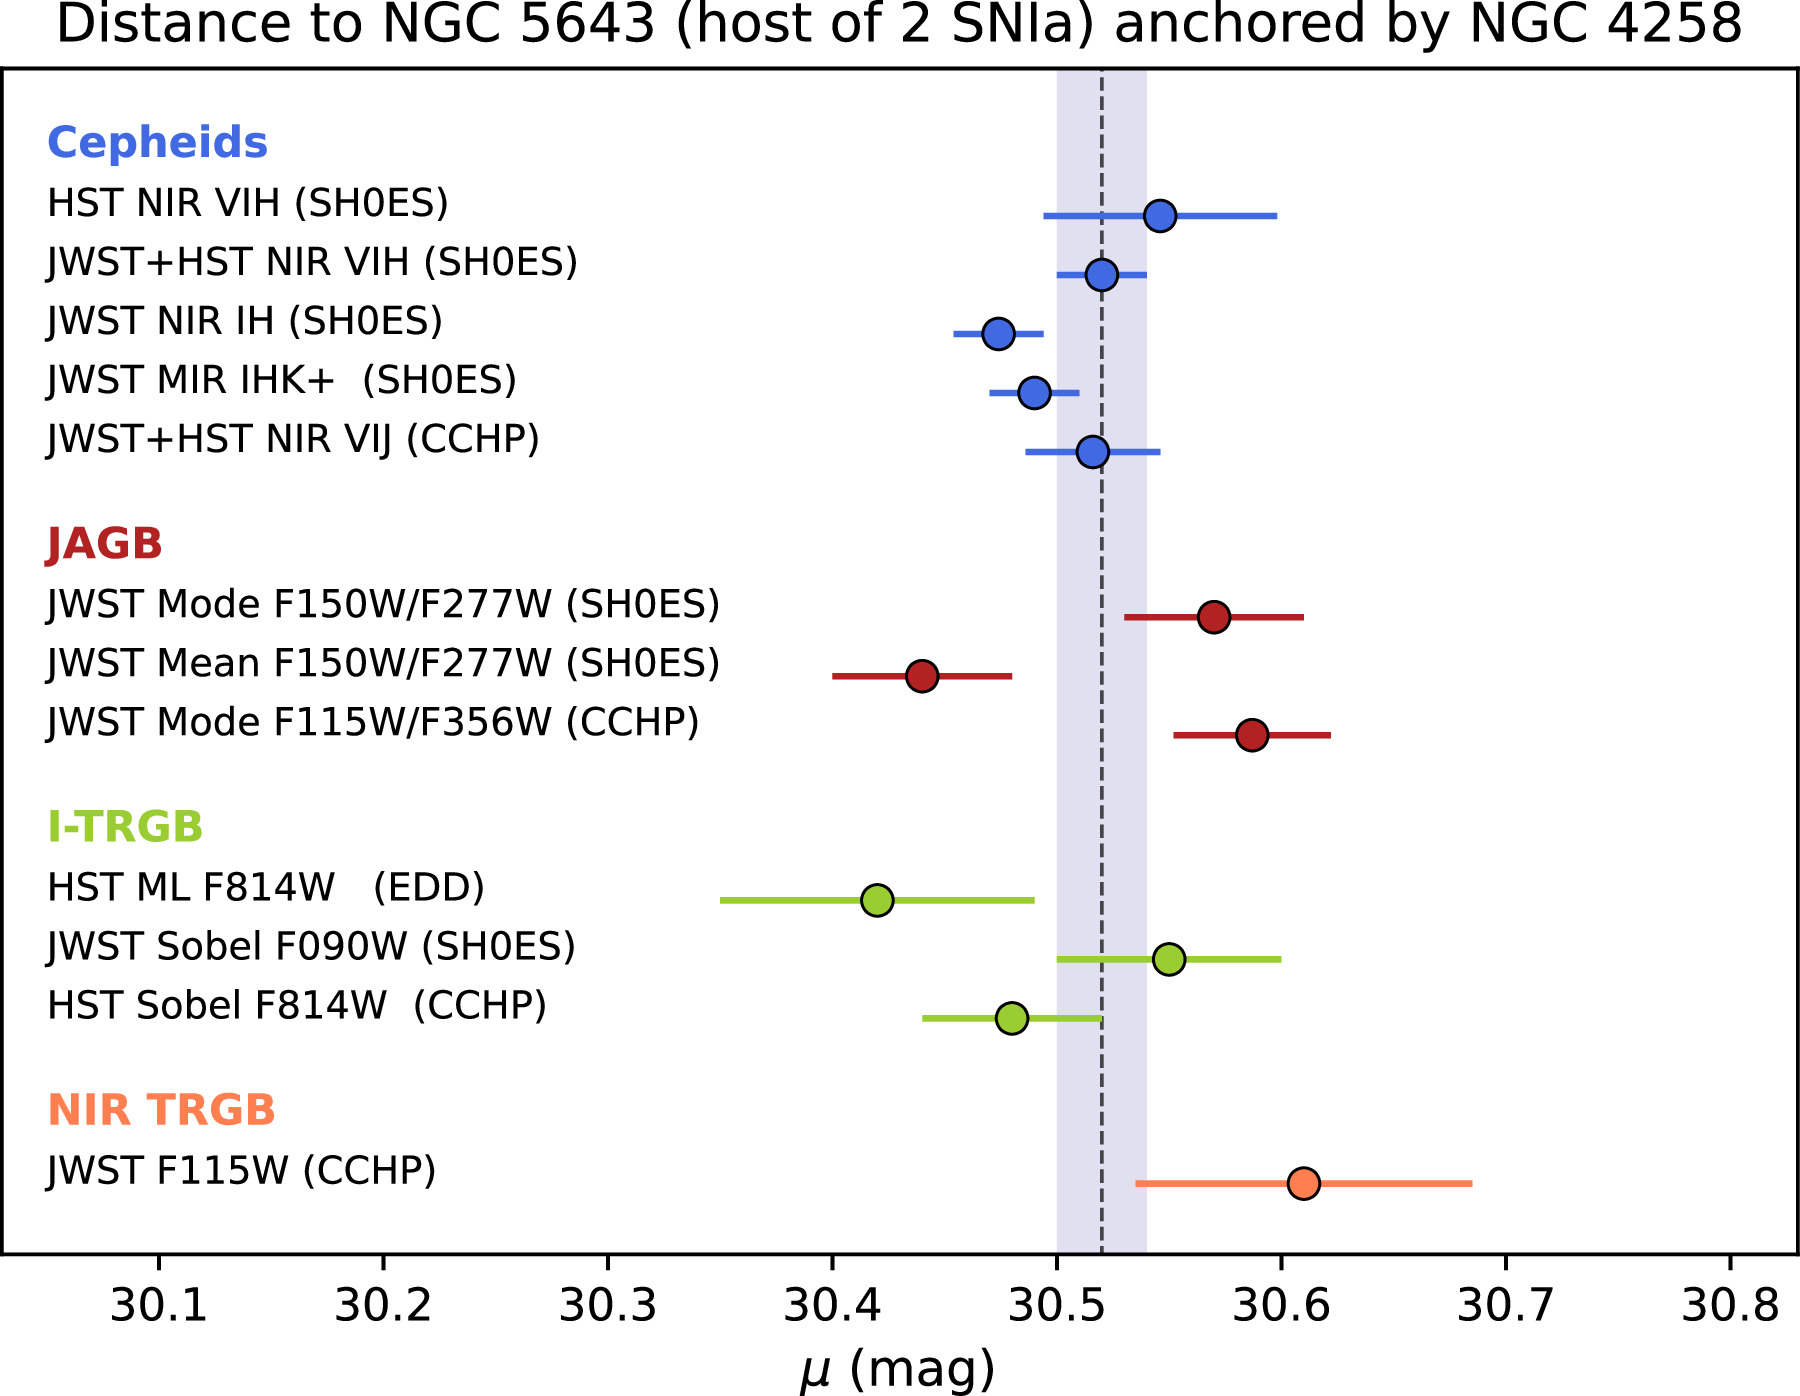
We show an example plot that can be made using the data table. NGC 5643 has the largest number of measurements from different teams and techniques. We show the agreement of these results in Figure A1. We augment the plot with data from R. B. Tully (2023).

Figure A1. Distance comparisons for NGC 5643 from multiple analyses. The SH0ES measurements can be found in R22 and A. G. Riess et al. (2024) for Cepheids, S. Li et al. (2024b) for JAGB, and here for JWST TRGB. Extragalactic Distance Database measurements are from G. S. Anand et al. (2022). The CCHP measurements can be found in W. L. Freedman (2021) and F24. All measurements are anchored to NGC 4258 in the first rung. We plot a consensus mean of μ = 30.52 ± 0.03 mag.
Download figure:
Standard image High-resolution imageHere we discuss a few points which we believe may be in error in the F24 (as initially posted to arxiv.org) analysis based on the considerations below. We fully recognize that these issues may evolve with additional work.
1.
Method for correlated errors and H0. There are two types of uncertainties in the determination of H0 which are correlated across distance methods (i.e., the same error) and so not reduced by combining distance measuring methods: the SNe uncertainty (due to the ∼10 SN in the hosts, and the ∼300 which measure the Hubble flow) and the 1.5% uncertainty geometric distance of NGC 4258. Table 5 in F24 presents random and systematic errors for each of three methods before fully reducing their combination. However, the random errors given in F24 Table 3 for each method include the same ∼10 SN Ia (and Hubble flow SNe) and the dominant error is the fit SN intrinsic scatter of 0.19 mag (Table 3 in F24) divided by
 , 2.9% in H0 and is the same uncertainty for all distance methods. F24 reduces this by as though independent. This also occurs in Figure 11 of F24 where the PDFs for the three-method results, including the SNe in common, are combined by multiplying them together.A similar situation occurs in the reduction of the systematic errors for each method. F24 gives these in their Table 5 as the sum of the irreducible 1.5% geometric error for NGC 4258 and the individual uncertainties in measuring each method in NGC 4258 (e.g., TRGB fitting, smoothing parameters, Cepheid P–L cutoff, etc.). Here too the method combination fully reduces these errors which also reduces the geometric distance error though it is the same for all methods. To illustrate this we separate the reducible and irreducible error terms for the F24
H0 error budget in Table B1 and recalculate the error in H0. We find a method combined error of 3.3% or ±2.3 km s−1 Mpc−1 which matches the independent calculation of the expected uncertainty in Table 3. It is higher than the combined error of ±1.5 km s−1 Mpc−1 from the method combination in F24 which is a consequence of neglecting the method-correlated errors in their reduction.
, 2.9% in H0 and is the same uncertainty for all distance methods. F24 reduces this by as though independent. This also occurs in Figure 11 of F24 where the PDFs for the three-method results, including the SNe in common, are combined by multiplying them together.A similar situation occurs in the reduction of the systematic errors for each method. F24 gives these in their Table 5 as the sum of the irreducible 1.5% geometric error for NGC 4258 and the individual uncertainties in measuring each method in NGC 4258 (e.g., TRGB fitting, smoothing parameters, Cepheid P–L cutoff, etc.). Here too the method combination fully reduces these errors which also reduces the geometric distance error though it is the same for all methods. To illustrate this we separate the reducible and irreducible error terms for the F24
H0 error budget in Table B1 and recalculate the error in H0. We find a method combined error of 3.3% or ±2.3 km s−1 Mpc−1 which matches the independent calculation of the expected uncertainty in Table 3. It is higher than the combined error of ±1.5 km s−1 Mpc−1 from the method combination in F24 which is a consequence of neglecting the method-correlated errors in their reduction.2.
Method for measurement Uncertainties in NGC 4258 and Distance Comparisons. In the point above, we separated the measurement uncertainties for each method in NGC 4258 from the 1.5% geometric distance uncertainty as provided in F24 (see Table 5, 3rd column). In magnitudes these are 0.035, 0.05, 0.087 for TRGB, JAGB and Cepheids, respectively. As given in Section 2.2, the measurement uncertainty of each method in NGC 4258 is the largest component of the total comparison uncertainty because they do not average down with more SN hosts. For example, the 0.087 mag uncertainty for measuring Cepheids with JWST in NGC 4258 alone is already larger than the size of the JAGB-Cepheid difference. Likewise, the mean difference between the CCHP JAGB distances (L24) and those from CCHP HST TRGB (W. L. Freedman 2021) of 0.073 mag would be even more significant than JAGB-Cepheids, but not so including the NGC 4258 measurement errors. In Table B2 we use the data in F24 (Tables 2 and 5) to calculate the weighted mean differences and their uncertainties without these terms (following F24) and with them. As shown, all of the distance comparisons are in good accord. We conclude that the difference between the mean CCHP JWST JAGB and CCHP JWST Cepheid distances are not significant after including the neglected NGC 4258 method measurement errors.
3.
Linearity of Cepheid Distances. F24 claimed a 3σ correlation or Cepheid distance nonlinearity by comparing HST Cepheid distances from R22, μHST, and SN Ia absolute luminosity, MB . However, the values of
(also from R22) were formed from so that the measured quantity, μHST, appears on both sides of the regression (axes), and thus are intrinsically correlated. In the uncorrelated space of HST Cepheid distance vs SN Ia MB
we calculate a slope ranging from 0.032 to 0.039 ± 0.022 or 1.5σ to 1.7σ significance, depending on the regression method used, and thus we do not detect a significant dependence. Likewise, we find the difference for the near and far SN mean MB
in Figure 16 of F24 to be 0.04 ± 0.05 mag(0.9σ) and 0.07 ± 0.11 mag(0.6σ) for the high and low SNR split, respectively, and thus not significantly different. A stronger test of HST Cepheid distances is given in Section 2.3.1 and using all independent measures produces a relation of (1-slope) which is −0.006 ± 0.01.


Table B1. Reducible and Irreducible H0 Uncertainties from F24
| Source of Error | SN Mean a | Hosts Mean | N4258 b | N4258 |
|---|---|---|---|---|
| Error | Measures | Measures | Geom. D | |
| % | % | % | % | |
| TRGB zero-point | 2.6 | 1.0 | 1.6 c | 1.5 d |
| JAGB zero-point | 2.6 | 1.0 | 2.4 e | 1.5 |
| Cepheid zero-point | 2.6 | 1.3 | 4.0 f | 1.5 |
| Combined methods g | 2.6 | 0.6 | 1.3 | 1.5 |
| Combined | 3.3h | |||
Notes.
a Error from 10 SNe Ia with intrinsic scatter 0.19 mag from Table 3 in F24 and error in Hubble flow SNe; host distance measures were removed from the random error in F24 Table 5 and put in Column (3). b Errors in each method measurement in NGC 4258 after removing the geometric distance error now placed in Column (5). c As per F24: NGC 4258 uncertainty in color term, TRGB fitting, extinction, photometry calibration. d Uncertainty of 1.5% in NGC 4258 distance (M. J. Reid et al. 2019). e As per F24: NGC 4258 uncertainty in the mode, smoothing parameter, convergence error, extinction. f As per F24: uncertainty in NGC 4258 reddening law fit zero-point, NGC 4258 P-L cutoff, aperture correction uncertainty, including cross matching the HST catalogs, photometric zero-point uncertainty, and metallicity. g Cepheid, TRGB, and JAGB combined errors; first and last columns do not reduce because they use the same SNe and NGC 4258 geometric distance. h Or 2.3 km s−1 Mpc−1.
Download table as: ASCIITypeset image
Table B2. CCHP Distance Method Comparisons without and with Method Measurement Errors in NGC 4258
| Comparison | N | Weighted Diff a | Error | w/NGC 4258 Measurement Errors |
|---|---|---|---|---|
| (mag) | ||||
| CCHP: JWST JAGB-JWST Cepheids | 7 | 0.086 | ±0.040 (2.2σ) | ±0.108(0.8σ) |
| CCHP: JWST JAGB-JWST TRGB | 10 | 0.019 | ±0.029 (0.7σ) | ±0.067(0.8σ) |
| CCHP: JWST Cepheids-JWST TRGB | 10 | −0.059 | ±0.039 (1.5σ) | ±0.101(0.3σ) |
| CCHP: JWST JAGB-HST TRGB (F21) | 4 | 0.073 | ±0.032 (2.3σ) | ±0.072(1.0σ) |
Note.
a We note some numerical differences between the weighted mean error given in F24 and what we calculate from their data in Table 2. Most significant is JAGB versus Cepheids, where F24 gives 0.028, and we find 0.040, which reduces the significance of the claimed difference from 3σ claimed by F24 to 2σ and then 0.8σ including the measurement errors for each method in NGC 4258 in Table A1 here and Table 5 in F24.
Download table as: ASCIITypeset image