How we manage the world’s limited arable land is critical for increasing food security and protecting nature. Agriculture is the largest land use on Earth [1–3], the largest consumer of water [4], a major source of water pollution [5], and the primary driver of deforestation and species extinction [5]. Over the past two decades, cropland area has continued to expand into natural ecosystems [6]. It will likely continue to do so to meet increasing demand for food, biofuels, and other commodities.
To improve food security and decrease agriculture’s environmental impact, the food system will need to be more efficient. Cassidy et al reported that 24% of calories were ‘lost’ to inefficiencies in using crops to support meat, dairy, and egg consumption in 2000 [7]. More recent research suggests the trend is toward less efficiency. Ray et al [8] reported an increase in the fraction of crop production used for feed and other non-food uses between 2000 and 2010 [8]. However, quantifying the feed used to produce the food is required to estimate the calories available in the food system. Further, since 2010, global consumption of calories from meat, dairy, and eggs has increased by 22% [1]. (This represents a 13% increase per capita). During that same period, ethanol and biodiesel production also increased [9]. Understanding how these changes affect food availability is crucial for identifying leverage points to improve the efficiency of the global food system.
Here, we quantify the impact of cropland use for food, livestock feed, biofuels, and other non-food uses from 2010 to 2020. First, we allocate crop production to its various uses. Second, we calculate the number of calories available in the food system based on feed-to-food conversion ratios for meat, dairy, and eggs. Third, we quantify the changes in crop usage and the changes in available calories between 2010 and 2020. Finally, we identify places with the greatest inefficiencies and what is driving them. The results presented in the main text focus on the comparison between 2010 and 2020. The supporting material also includes results for 2015.
2.1. Scope of the analysis
The analysis described below was conducted for the top 50 crops by calorie production (table 1), which account for 97.6% of all calories produced. To reduce the impact of annual production fluctuations, we present results as the average over 3 years of analysis. For example, the year 2020 is an average of years 2019, 2020, and 2021. Because the FAO supply utilization accounts (SUA) time series starts in 2010, the average for 2010 was calculated from a linear trend fit to the years 2010–2012.
Table 1. 50 crops included in this analysis. The percentages are based on the average production from 2019 to 2021. Crop production data from FAOStat crop production data [1] (downloaded Oct 2024). Conversion from tonnes to calories is described in methods section.
| Crop group | Percent global calorie production | Crops in this group |
|---|---|---|
| Cereals | 62.6% | Maize (26.2%), wheat (16.5%), rice (13.5%), barley (2.9%), sorghum (1.3%), millet (0.7%), oats (0.5%), triticale (0.3%), rye (0.3%), cerealsnes (0.2%) |
| Oil crops | 19.2% | Soybean (9.4%), oilpalm (4.3%), rapeseed (1.6%), sunflower (1.5%), groundnut (1.5%), coconut (0.3%), sesame (0.3%), olive (0.2%), linseed (0.1%) |
| Roots & tubers | 5.2% | Cassava (2.5%, potato (1.6%), sweet potato (0.6%), yam (0.5%), taro (0.1%) |
| Sugar crops | 5.0% | Sugarcane (4.0%), sugarbeet (0.9%) |
| Fruits | 2.1% | Banana (0.5%), grape (0.3%), apple (0.3%), plantain (0.2%), orange (0.2%), mango (0.2%), date (0.1%), fruitnes (0.1%), tangerine (0.1%) |
| Pulses & legumes | 1.9% | Bean (0.6%), chickpea (0.3%), cowpea (0.2%), lentil (0.1%), broadbean (0.1%), pigeonpea (0.1%) |
| Vegetables & melons | 1.5% | Vegetablesnes (0.5%), onion (0.3%), tomato (0.2%), garlic (0.2%), watermelon (0.1%), cabbage (0.1%) |
| Other | 0.2% | Cocoa (0.2%) |
| Rest of the crops | 2.5% | 103 additional crops tracked by FAO |
Note: ‘nes’ (not elsewhere specified) is used by FAO to track the production of crops when countries do not report a specific crop name.
2.2. Crop production and utilization
We used the food and agriculture SUA [10] to allocate crop production within each country to food, feed, and non-food categories. Although previous analyses [7] used FAO’s food balance sheets (FBS) [11], we used the SUA as it provides a more detailed breakdown of commodities associated with each crop [12]. This additional detail allowed us to avoid making assumptions about how to allocate the FBS ‘Processed’ category across food, feed, and non-food uses. Also, it is important to note that FAO’s current accounting methodology for both the FBS and SUA started in 2010. Previous efforts that compared the FBS data for 2010–2013 using the old and new databases found large discrepancies [13]. As such, we could not credibly assess longer term trends or compare the results presented here to similar work by Cassidy et al [7] for the year 2000.
First, each crop was broken up into its constituent commodities within each country. For example, linseed is broken up into linseed, cake of linseed, and oil of linseed. The complete list of crop-specific commodities, along with their corresponding calorie content per gram, is in table S1. To standardize the assessment of impact on the food system, the volume (in tonnes) of each commodity was converted to calories. See supplemental material for further details.
Second, we calculated the total calories allocated as food, feed, and other (non-food) for each crop (and its constituent commodities). We calculated ‘Food’ as the sum of the ‘Food supply quantity (tonnes)’ and ‘Tourist consumption’ elements in the SUA database. For ‘Feed’ and ‘Other (non-food),’ we used elements in the SUA with those same names.
Third, we calculated the allocation of calories as described above for every country and the globe as a whole. For each country-crop combination, we assume that exported calories are allocated according to the global pattern and that domestic and exported calorie utilization are appropriately weighted. These steps were repeated annually for each country in which the crop was produced. See Supplemental Material for further details.
2.3. Feed calories utilized for livestock commodities
We used feed-to-food conversion rates to estimate what percentage of total feed calories were returned to the food system for human consumption. We refer to this quantity for consumption as ‘Indirect Food.’ The following livestock commodities were included to calculate Indirect Food calories: cattle meat, pig/swine meat, chicken meat, dairy, and eggs. Consistent with Cassidy et al [7], goats, sheep, water buffalo, camels, and horses were excluded from the analysis as these livestock are primarily produced on rangelands. Indirect Food was calculated using a weighted average of domestic livestock production [1], animal-specific feed-to-food calorie conversion rates, and supplemental feeding rates (table S2, equations (S1)–(S5)). The feed-to-food calorie conversions used here are consistent with Cassidy et al [7] and similar to those published in Shepon et al [14]. The feed-to-food calorie conversion rates vary across livestock commodities. Dairy is the most efficient (2.5:1); beef is the least efficient (33:1). However, feed-to-food efficiency varies across regions and livestock systems [15]. See supplemental material for further details.
2.4. Calories utilized for biofuel production
We estimate the calories allocated to biofuel production from OECD-FAO data explorer [9], which reports the quantity of the domestic output of crops and commodities used to produce ethanol and biodiesel. Our analysis accounts for 93.6% of the bioethanol and 99.2% of the biodiesel produced globally between 2021 and 2023 [9]. We assumed that quantities reported were categorized as ‘non-food’ in the SUA data. We accounted for the calories in the distiller grains byproduct of producing ethanol from maize. Estimates of feed production calculated above were not adjusted, as the SUA data reported the amounts of byproducts used as feed. See the supplemental material text and tables S3(a) and (b) for additional details.
2.5. Available and lost calories
We use the term ‘available calories’ to represent the sum of crop calories available as food for people, either by eating crops (‘direct calories’) or from livestock commodities after accounting for feed-to-food efficiency factors (‘indirect calories’). ‘Lost calories’ as the sum of calories unavailable because of the inefficiency of feed-to-food conversion and the calories allocated to non-food uses, such as biofuels. We then estimated the number of people whose caloric needs could be met, given the total and available calorie production. Consistent with Cassidy et al [7], we assumed a 2700 kcal/person/day diet. Since caloric demand varies with factors such as age, sex, and physical activity, the analysis was also completed using assumptions of 2300 and 2500 kcal/person/day, and the results are presented in tables S6(a)–(c).
We do not address food loss and waste here. Although there is a ‘loss’ category in the SUA, we allocate those calories proportionally to ‘food,’ ‘feed,’ and ‘non-food’ because the database lacked commodity-level values. The reported loss accounts for 5% of all production. We do not include the SUA elements of ‘seed’ in our results, as this ensures they remain relevant for policy on crop utilization; we do not propose reallocating seed to any other purpose.
2.6. The influence of diet on available calories
To quantify the impact of diet choice on the number of available and lost calories, we calculated the amount of beef consumption in excess of a healthy quantity defined by the EAT-Lancet healthy reference diet [16]. More specifically, we calculated the difference between per capita beef consumption [17] and 5.11 kg/cap/year. This difference was multiplied by population size to estimate total excess. Next, we calculated the number of lost calories avoided if the excess beef were substituted with chicken or lentils. The analysis was completed for all countries, excluding countries that had a lower per capita beef consumption 5.11 kg/person/year and low-income food deficit countries as defined by FAO [17]. Those criteria limited the scenario to 48 countries. (Note: We accounted for FAO FBS reported beef consumption in carcass weight, which is 1.4 times greater than the retail boneless weight used for the EAT-Lancet healthy reference diet.)
We focused on beef consumption as it is the least efficient at converting feed calories to edible meat [7, 14]. Therefore, changes in beef consumption will a greater impact on the number of people that could be fed per hectare of cropland. In addition to inefficiency in the food system, beef has similarly disproportionately high greenhouse gas emissions [18] and is a leading risk factor for cardiovascular disease [19]. Reducing beef consumption will lead to a more efficient food system.
2.7. Geographic patterns
To visualize spatial patterns, we distributed the results using crop-specific sub-national data for 50 crops. These maps were created by combining data on sub-national production [20], national production [1], and sub-national crop distribution (CROPGRIDS) [21]. Specifically, we reconstructed the Monfreda et al [20] geodatabase, perturbed the data by adjusting it annually using national production data from FAOSTAT [1], and then distributed the data within administrative units using the CROPGRIDS dataset [21]. Each step normalized the data to align with FAOSTAT’s annual production data and distributed it among administrative units in GADM v4.1 (OECD and Food and Agriculture Organization of the United Nations 2024)) (see supplemental material). Direct, Indirect, and Non-food calories data were then distributed across these production maps for three-year periods circa 2010, 2015, and 2020. See supplemental material for additional details on data construction, testing, and the raster products for 50 crops.
3.1. Crop production and utilization
Global crop production increased by 2.80 × 10¹⁴ calories/year (23.9%) between 2010 and 2020. This increase is attributed to increased calorie production used for (direct) food (14.9%), feed (31.2%), and non-food uses (36.3%) (figure 1). The biggest increases in food calories were from wheat (14.9% of the total food calorie increase), rice (13.9%), and maize (7.2%). See table S4(a) for crop-specific calorie totals and allocation breakdown.
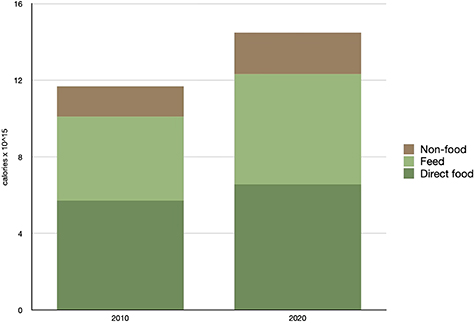
Figure 1. Crop production utilized as food, feed, and non-food uses. Total calorie production on croplands increased 23.9% between 2010 and 2020. This increase was primarily due to calories used for feed and non-food purposes. For context, 1 × 10¹⁵ calories are enough to meet the annual caloric needs of 1 billion people eating 2700 kilocalories per day.
Download figure:
Standard image High-resolution image
3.2. Feed calories utilized for livestock commodities and non-food uses
Feed production increased 31.2% from 2010 to 2020. The increased production was not evenly distributed across livestock commodities, indicating changes in diet. The largest increases in commodities used for feed were maize (59.6%) and soybeans (21.1%). The largest increases in feed allocation were for beef and pork, garnering 31% and 25% of the total increase in feed share, respectively. See table S4(b) for country-specific calorie totals and allocation breakdown.
The fraction of crop calories used for non-food uses increased from 2010 to 2020. Biodiesel and bioethanol production, a subset of non-food uses, increased 137% and 10%, respectively, accounting for 1.3% and 3.9% of global calorie production in 2020. Oil palm and maize had the largest increases in non-food calorie production, at 34% and 29%, respectively. The percentage of domestic calories used for ethanol feedstocks was highest in the United States (16%) and Brazil (13%). The highest percentages of domestic production used for biodiesel were Colombia (9%), Indonesia (8%), Thailand (8%), and Malaysia (7%). These estimates for calories used for biofuels are conservative—we only estimated calories for biofuels from domestic production, excluding biofuels produced using imported feedstocks. For example, biodiesel produced in Germany using oil palm feedstock from Indonesia is excluded from estimates for both countries. See table S3(c) for country-specific calories used for biofuel production.
3.3. Available and lost calories
Total calorie production increased 23.9% between 2010 and 2020, yet available calories per person only increased by 9%. Two key factors contribute to this decline in efficiency (figure 2). First, the fraction of crop calories consumed directly as food (direct calories) decreased from 49% to 45% and the fraction of calories utilized for non-food commodities increased from 14% to 15% of total calorie production on croplands (figure 1). Second, the use of feed became less efficient during that time (figure 2). Between 2010 and 2020, the fraction of total calorie production used for feed increased from 38% to 40%. The largest increases were for increased beef and pork production, which are the least efficient livestock groups. These two factors resulted in there only being a 14.9% increase in food calories despite a 23.9% increase in total calorie production.
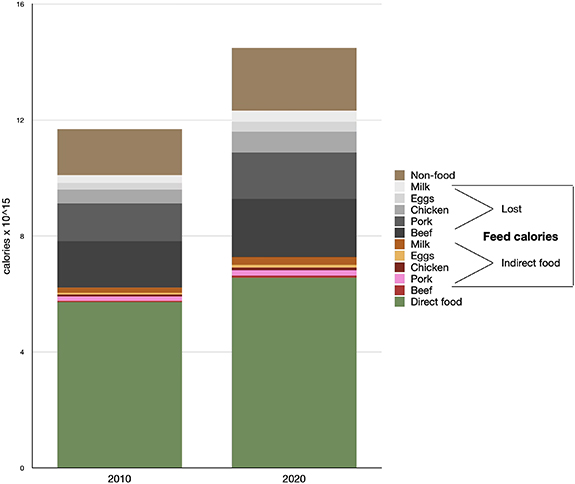
Figure 2. Available and lost calories from croplands. ‘Available’ calories are the sum of calories of crops consumed directly as food (green) and indirect calories from livestock commodities like beef and eggs that were produced using feed calories (yellow-orange-pink-red). ‘Lost’ calories are the sum of feed calories used to produce livestock commodities that do not end up as feed calories (gray) and calories lost for non-food uses like biofuels and shampoo (brown).
Download figure:
Standard image High-resolution image
3.4. Effects of diet choice on available and lost calories
If beef consumption in the 48 countries included in this analysis (table S5) was reduced to healthy quantities, as defined by the EAT-Lancet healthy reference diet [16], 1.23 × 10¹⁵ calories currently lost in the food system could become available. That is enough calories to support 1.23 billion people each year. For a more conservative estimate, 8.51 × 10¹⁵ calories lost in the food system—enough to meet the caloric needs of 851 million people annually—could be avoided if chicken replaced beef consumption to reduce the latter to the EAT-Lancet reference diet. More than half of the global potential to increase available calories is in the United States (37%) and Brazil (21%). As mentioned in the methods, low income food deficit countries and countries consuming less than 5.11 kg/person/year were excluded from the analysis. See table S5 for results for all 48 countries.
3.5. Geographic patterns
The United States, China, India, Brazil, and the EU27 produced 57% of total calorie production on croplands in 2020 (table 2, figure 3). Total calorie production on global croplands increased 23.9% between 2010 and 2020. Production increased across all four countries and the EU27, ranging from +15% in the United States to +46% in Brazil.
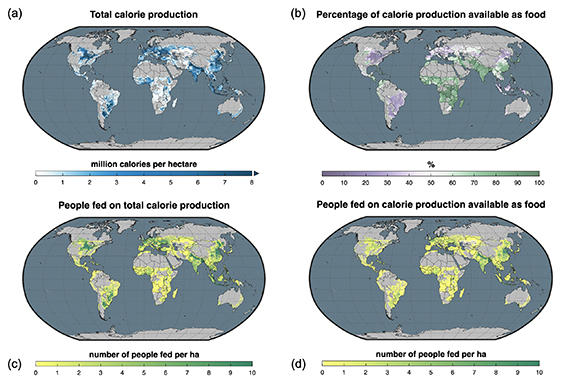
Figure 3. Geographic patterns of calories produced and available for as food for 50 crops in 2020. The above maps show (a) total calorie production, (b) of the percentage total calories available as food after accounting for feed-to-food efficiency, (c) the number of people potential fed per hectare based on total calorie production and (d) the number of people potentially fed per hectare of available calories. Available calories are the sum of direct and indirect (livestock commodities via feed) calories. The number of people fed per hectare assumes an annual intake of 2700 kcal/day. Maps for the years 2010 and 2015 are in figures S1–S4 in the supplemental material. Estimates of the number of people fed per hectare at 2300 kcal/day, 2500 kcal/day, and 2700 kcal/day are provided in tables S6(a)–(c).
Download figure:
Standard image High-resolution image
Table 2. Changes in crop production and allocation from 2010 to 2020.
| Production in 2010 | Production in 2020 | |||||||||||||
|---|---|---|---|---|---|---|---|---|---|---|---|---|---|---|
| Geography | Production calories | Direct Food | Feed | Non-food | People fed per ha, total calories | People fed per ha, available calories | Indirect calorie fraction | Production Calories | Direct Food | Feed | Non-food | People fed per ha, total calories | People fed per ha, available calories | Indirect calorie fraction |
| USA | 1.74 × 10¹⁵ | 0.20 | 0.50 | 0.30 | 18.8 | 4.7 | 0.10 | 2.00 × 10¹⁵ | 0.17 | 0.56 | 0.28 | 22.1 | 5.0 | 0.11 |
| China | 2.06 × 10¹⁵ | 0.55 | 0.37 | 0.08 | 14.8 | 8.7 | 0.11 | 2.51 × 10¹⁵ | 0.48 | 0.42 | 0.11 | 18.1 | 9.5 | 0.11 |
| India | 1.16 × 10¹⁵ | 0.82 | 0.15 | 0.02 | 7.1 | 6.2 | 0.28 | 1.46 × 10¹⁵ | 0.79 | 0.19 | 0.02 | 8.6 | 7.3 | 0.29 |
| Brazil | 8.14 × 10¹⁴ | 0.29 | 0.45 | 0.26 | 13.6 | 4.5 | 0.09 | 1.19 × 10¹⁵ | 0.24 | 0.50 | 0.26 | 16.2 | 4.7 | 0.10 |
| EU27 | 1.08 × 10¹⁵ | 0.36 | 0.56 | 0.07 | 14.3 | 6.2 | 0.13 | 1.14 × 10¹⁵ | 0.36 | 0.54 | 0.10 | 15.7 | 6.7 | 0.13 |
| Rest of World | 4.82 × 10¹⁵ | 0.55 | 0.33 | 0.12 | 8.3 | 4.9 | 0.11 | 6.19 × 10¹⁵ | 0.52 | 0.34 | 0.14 | 9.4 | 5.2 | 0.11 |
| Global | 1.17 × 10¹⁶ | 0.49 | 0.38 | 0.14 | 10.5 | 5.6 | 0.12 | 1.45 × 10¹⁶ | 0.45 | 0.40 | 0.15 | 12.1 | 6.0 | 0.12 |
However, these gains do not necessarily translate to an increase in available food. In 2020, only 17% and 24% of calories produced on croplands were used directly for food in the USA and Brazil, respectively. After accounting for the indirect food calories from feed used to produce livestock commodities, the available food accounted for 23% and 29% of total calorie production in the USA and Brazil, respectively. In contrast, India consumed 79% of calories produced on croplands directly for food in 2020, down from 82% in 2010. While India’s allocation of calories to feed increased since 2010, it remained substantially lower (19% of total calories) than that of the USA, China, Brazil, or the EU27. In 2020, 84% of total calorie production in India was available for human consumption, after accounting for the indirect food calories contributed by livestock commodities. The difference between the percentages of direct and available food is much larger in India (from 79% to 84%) than in all countries and regions listed in the table. This difference is because most feed calories are allocated to producing milk, which has a higher feed-to-food conversion efficiency (table S2). Although calorie production is much lower, the percentage of calories available as food is similar across much of sub-Saharan Africa.
The number of people fed per hectare integrates the production and the allocation data. On average, croplands produce enough calories to meet the needs of 12 people per hectare, but only six after accounting for lost calories (table 2). The geographic patterns vary widely. For example, while the production in the United States could feed 22.1 people per hectare of cropland, the available calories are only sufficient to meet the needs of 5.0 people per hectare. Although the overall increase in crop production could theoretically support 2.3 more people per hectare, in reality, just 0.3 more people are supported based on available calories due to the decrease in cropland efficiency for food production. Although the differences are not as stark in Brazil and the EU27, these countries also have a wide gap between calorie production and calories available for people. In contrast, India produces 40% fewer calories per hectare of cropland than in the United States yet could feed 2.3 more people per hectare. As stated in the methods, these results are based on the assumption of 2700 kcal/day/person. Tables S6(a)–(c) show influence of assuming 2300, 2500, and 2700 kcal/day on the number of people that could be fed per hectare of cropland.
Calorie production on global croplands increased by 23.9% from 2010 to 2020 while cropland area only increased by 3.2% [1]. However, croplands were less efficient at delivering available calories to the food system in 2020 than in 2010. This decreased efficiency is primarily due to a greater fraction of calories allocated to feed and non-food uses. Feed and non-food calories increased by 31.2% and 36.3%, respectively, while calories consumed directly as food only increased by 14.9%. While consumption of meat, dairy, and eggs increased globally, beef consumption was the largest driver of increased feed use. From 2010 to 2020, feed calories used for beef production increased by 25.8%.
The inefficiencies highlighted here occur in the context of several additional factors that increase the risk to food security. Yield trends for major crops have stagnated in many regions [8, 17]. Further, the gap between current and attainable yields is widening in many areas where a large share of crop production is consumed directly as food [17]. Climate change has already affected crop yields [22–24], and yields are projected to decrease across most of today’s croplands [25, 26].
Although this study emphasized the impact of crop use on competition for limited cropland, the relevance of the findings is much broader. This study found that croplands produced enough calories to support 14.5 billion people in 2020, yet 2.3 billion people were moderately to severely food-insecure, of whom 733 million people experienced chronic hunger in 2023 [27]. Meanwhile, 2.1 billion adults over 25 years old were overweight or obese in 2021 [28]. The current food system clearly fails to meet the nutritional needs of half of the global population.
Choices about how crop production is utilized for food, feed, and non-food uses also directly influence agriculture’s environmental impact. Agriculture accounts for 22% of global greenhouse gas emissions [29, 30], 92% of consumptive water use [4], is a primary source of water pollution [5, 31], and is the leading cause of deforestation [32, 33]. In most cases, the environmental impact aligns with how calories are utilized. For example, beef production is the least efficient use of crops analyzed here, and it has the highest greenhouse gas emissions per kilogram [18]. In contrast, crop calories consumed directly as food generally have much lower greenhouse gas intensities [18, 34]. Our findings complement related studies that show how shifting to healthier diets, even just shifting some beef consumption to chicken, would greatly reduce diet-related emissions [35, 36]. These climate impacts from agriculture can create a downward spiral, in which a warmer climate exacerbates the environmental impacts of agriculture [37] and increases deforestation to mitigate climate-induced production declines [24].
There are several caveats to this analysis. First, food availability is not the same as food security. Additional factors such as accessibility, affordability, and nutrition would be required to have a more holistic view of food security. Second, the analysis included 50 crops that comprise 97.5% of calories produced on croplands. The remaining 103 crops tracked by FAO are primarily fruits and vegetables. Third, there are no sub-national data for all countries included in this analysis. However, that limitation would only affect how the results are presented on the maps. The analysis presented here only required national data from the FAO. Further, restricting the crop-specific raster datasets to only administrative units where data are available enables other studies to treat climate, soil, market access, and other socio-environmental characteristics as independent variables. Fourth, the analysis does not include the source countries for feed used for the domestic production of livestock commodities. However, using the global average of crop utilization for feed commodities is likely to have a minimal impact on the results, as there is limited variation in the ICF (see table S4(b)). This assumption would be less credible if the analysis included where livestock were consumed or assessed other embodied resources, such as greenhouse gases, water, land, or fertilizer. Fifth, food waste is not included in our analysis and falls beyond its scope. If included, the results would illustrate that although all food waste affects the food system, its effects are not evenly distributed. Wasting livestock commodities, particularly beef, has a disproportionately large impact because of the substantial feed calories required to produce them. Despite these limitations, the analyses and underlying datasets developed here have the potential to inform related analyses assessing opportunities and trade-offs for improving global food security while reducing agriculture’s environmental impact. We caution that the approximations we made to update the data to 2020 are uncontrolled, in that there is no estimate of the associated error. We provide high-resolution, high-quality data in the same format from the agricultural statistics agencies of Brazil and the USA to facilitate application-specific validation studies.
This analysis highlights several key leverage points for targeting action to enhance the efficiency of the global food system. First, a few commodities drive most of the inefficiency. More than half (54.7%) of calories produced on croplands in 2020 were utilized as feed (39.7%) and other non-food uses, including biofuels (14.9%). Shifting these calories to direct consumption as food would provide enough calories to feed an additional 7.9 billion people. This estimate is conservative because we assumed a daily energy intake of 2700 kcal/person, 8% higher than the 2500 kcal/person used in the analysis of the EAT-Lancet healthy reference diet [16].
We are not naïve enough to think that people would be healthy if they only ate the crops currently used for animal feed, biofuels, and other non-food uses. However, the land currently used to produce livestock feed and biofuel feedstocks could be used to grow crops that meet caloric and nutritional requirements. Due to significant differences in feed-to-food efficiency, even reallocating some of the calories used in beef production to feed pigs or chickens would increase the calories available for people. Beef production was the largest source (39.7%) of calories lost from converting feed to food, while only providing 9% of calories from animal source calories produced with crop feed (excluding fish). The calories lost from biofuels and other non-food uses have limited benefits, as feedstocks for biofuels compete for land that could be used to grow food or conserve biodiversity [38–41].
Second, these challenges are concentrated in a small set of countries. Biofuel production is tightly concentrated, with 72% of bioethanol production occurring in only two countries, the US (47%) and Brazil (25%). The European Union produces 31% of the world’s biodiesel, and three countries—Indonesia (19%), the US (19%), and Brazil (12%)—account for another 50%. Feed production and beef consumption are also tightly concentrated. Nearly half (47.9%) of feed production is concentrated in the USA (19.3%), China (18.2%), and Brazil (10.4%). Reducing beef consumption to healthy levels in 48 higher-income countries and replacing that protein with lentils or chicken would reduce the number of lost calories equivalent to meeting the caloric needs of 1.2 billion or 850 million people, respectively. More than half of that 850 million people could come from substituting excess beef for chicken in just the United States (37%) and Brazil (21%).
How we use croplands to produce food for people has become less efficient from 2010 to 2020. The results presented here illustrate that a few commodities, particularly beef and biofuels, account for most of the current inefficiencies. Further, these inefficiencies are concentrated in a small set of countries. Shifting to healthier diets in the United States and Brazil, and reducing biofuel production in the United States, Brazil, European Union, and Indonesia are leverage points for increasing the number of available calories from croplands. Targeting actions and policies for these commodities and countries can have an outsized impact on improving food security, health, and the environment.
We thank two anonymous reviewers, whose constructive comments strengthened the research. Skylar Knight and Mary Hoff provided editorial support. Chad Monfreda, Navin Ramankutty, and Jonathan Foley provided data. Charlie West assisted with background research and editing. One Earth Philanthropy funded the research.
The distribution, harvested area, and yield data for 50 crops for the years 2010, 2015, and 2020 are openly available at https://doi.org/10.5281/zenodo.18476564. The figures, geodatabse, and input files are available there as well. The code used to develop the data and conduct the analysis are opening available at https://github.com/jamesgerber/HalfTheCaloriesProducedAvailableAsFood.
Supplementary data 1 available at https://doi.org/10.1088/2976-601X/ae4f6b/data1.
Supplementary data 2 available at https://doi.org/10.1088/2976-601X/ae4f6b/data2.
Supplementary data 3 available at https://doi.org/10.1088/2976-601X/ae4f6b/data3.
Supplementary data 4 available at https://doi.org/10.1088/2976-601X/ae4f6b/data4.
Supplementary data 5 available at https://doi.org/10.1088/2976-601X/ae4f6b/data5.
Supplementary data 6 available at https://doi.org/10.1088/2976-601X/ae4f6b/data6.
Supplementary data 7 available at https://doi.org/10.1088/2976-601X/ae4f6b/data7.
Supplementary data 8 available at https://doi.org/10.1088/2976-601X/ae4f6b/data8.