The Atlantic meridional overturning circulation (AMOC) transports relatively warm upper-ocean water to the north, where it sinks and returns as cold, deep water to the South Atlantic. Changes in AMOC strongly impact northward ocean heat transport and the climate of the Atlantic mid- and high-latitudes, anthropogenic carbon and oxygen uptake by the ocean, sea level in the northern North Atlantic and the location of tropical rainfall belts [1–3]. In 1961, it was demonstrated that a simple theoretical model of the thermohaline (i.e. temperature and salinity driven) circulation possesses two modes of operation with possible abrupt transitions between the two, when a saddle-node bifurcation (also called tipping point) is passed [4]. Although this simple model is highly idealised, it has since been shown that a full suite of ocean and climate models of increasing complexity, even up to an eddy-resolving ocean, reproduces this fundamental behaviour [5]. Paleoclimatic evidence points to major abrupt climate changes during the last glacial period with a focus on the northern North Atlantic and with global repercussions, related to instabilities of the AMOC [6–8].
Earlier reports from the intergovernmental panel on climate change (IPCC) argued that an abrupt collapse of the AMOC before 2100 was very unlikely (i.e. less than 10% probability in IPCC language), based on the absence of such events in future global warming projections [9, 10]. The latest, 6th IPCC report concluded [1]: ‘There is medium confidence that there will not be an abrupt collapse before 2100.’ This lack of confidence was based on their assessment that model bias (error) may considerably affect the sensitivity of the modelled AMOC to freshwater forcing: ‘tuning towards stability’ and model biases [1] give climate models a tendency toward unrealistic stability [8, 11–13]. Furthermore, these models neglect increasing meltwater release from the Greenland ice sheet in their future projections, a potentially significant forcing [14, 15].
In IPCC language the term abrupt refers to events taking place over a few decades or less (<30 years) and persisting at least over a few decades. In our view the term abrupt is not applicable to the future shutdown of the overturning associated with North Atlantic deep water (NADW) as seen in climate models, which will be discussed further below. An abrupt AMOC collapse (<30 years) is only triggered by massive freshwater hosing as has been performed in idealised studies [2, 3].
Climate models from 53 modelling centres around the world contribute to the coupled model intercomparison project (CMIP)6 [16, 17] with climate change simulations, driven by standardised future greenhouse gas and aerosol emission scenarios beyond 2014 [18]. We analyse the data of all those available CMIP6 model simulations which have been extended to either year 2300 or 2500. This set comprises 20 scenario runs computed with 10 different models; more details are presented in table S1.
For the AMOC and all other variables annual averages were used, apart from the mixed-layer depth for which we took the annual maximum value which on the Northern Hemisphere occurs in March. The AMOC was analysed at a fixed depth (∼1000 m) at 26°N, being the depth of maximum overturning between years 1950 and 2000, which slightly varies per model (see also supplementary material). The reason for this is that our focus is on the dramatic changes in the AMOC due to the cessation of NADW formation, which would otherwise be obscured by picking up the maximum of the shallow wind-driven contribution.
The calculations of the heat transport at 26°N were largely performed in a previous study [19], extended with values from beyond 2100 with the same scripts as used in [19]. To emphasise longer timescales and eliminate intra-decadal natural variability, all time series were smoothed using a lowess filter with a window of 40 years, unless noted otherwise in the figure caption.
Under a high-emission scenario (SSP585) the AMOC declines throughout the 21st century and reaches a shutdown of its deep northern overturning in all nine models that were run beyond 2100 (figure 1, red curves) (GISS-E2-2-G only extended SSP245 and SSP126 scenario runs). In these states the vertically-integrated northward volume transport at 26°N has evolved from 14–26 Sv (1 Sv = 106 m3 s−1) over a layer of ∼1000 m in the late 20th century to 1–6 Sv. This transition features abrupt change in depth of maximum overturning at 26°N (figure 2(a)) from one determined by NADW formation in the northern North Atlantic [20] to one linked to downwelling in the subtropics (figures 2(b) and 3). Once the deep thermohaline flow associated with NADW becomes weaker than the wind-driven shallow Ekman cell, the overturning maximum abruptly shifts to shallow depth of 200 m or less (figure 2(a)). Figure 2(b) shows that northward transport below the shallow maximum vanishes in most cases, implying downwelling further north restricted to 100–200 m depth. Exceptions are the CanESM5 model in which the surface cell becomes extremely weak, and the SSP126 run by CESM-WACCM which is still in transition in year 2300, featuring a very weak northward volume transport of <2.5 Sv below the Ekman cell.
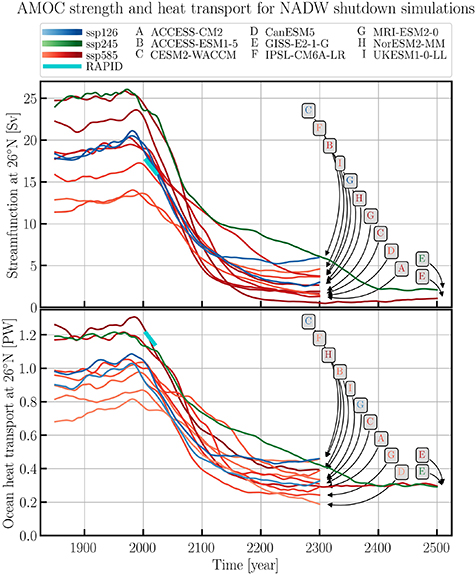
Figure 1. (upper) Ensemble means of the AMOC strength and (below) total ocean heat transport at 26°N in the model simulations in which the northern AMOC shuts down. The letters are ordered from top to bottom to correspond to lines with decreasing values in year 2300/2500. The short cyan line shows the observed (yet insignificant) trend of the RAPID observations [21, 22] for 2005–2023 (upper) and 2005–2020 [23] (below).
Download figure:
Standard image High-resolution image

Figure 2. Evolution of maximum overturning depth in models featuring a northern AMOC shutdown in their extended runs (a) and vertical profile of the AMOC during the last 10 years of the extended run (b). From panel (b) the transport is northward where curves increase with depth, and southward where they decrease with depth. Downwelling further north is restricted to depths where AMOC strength increases.
Download figure:
Standard image High-resolution image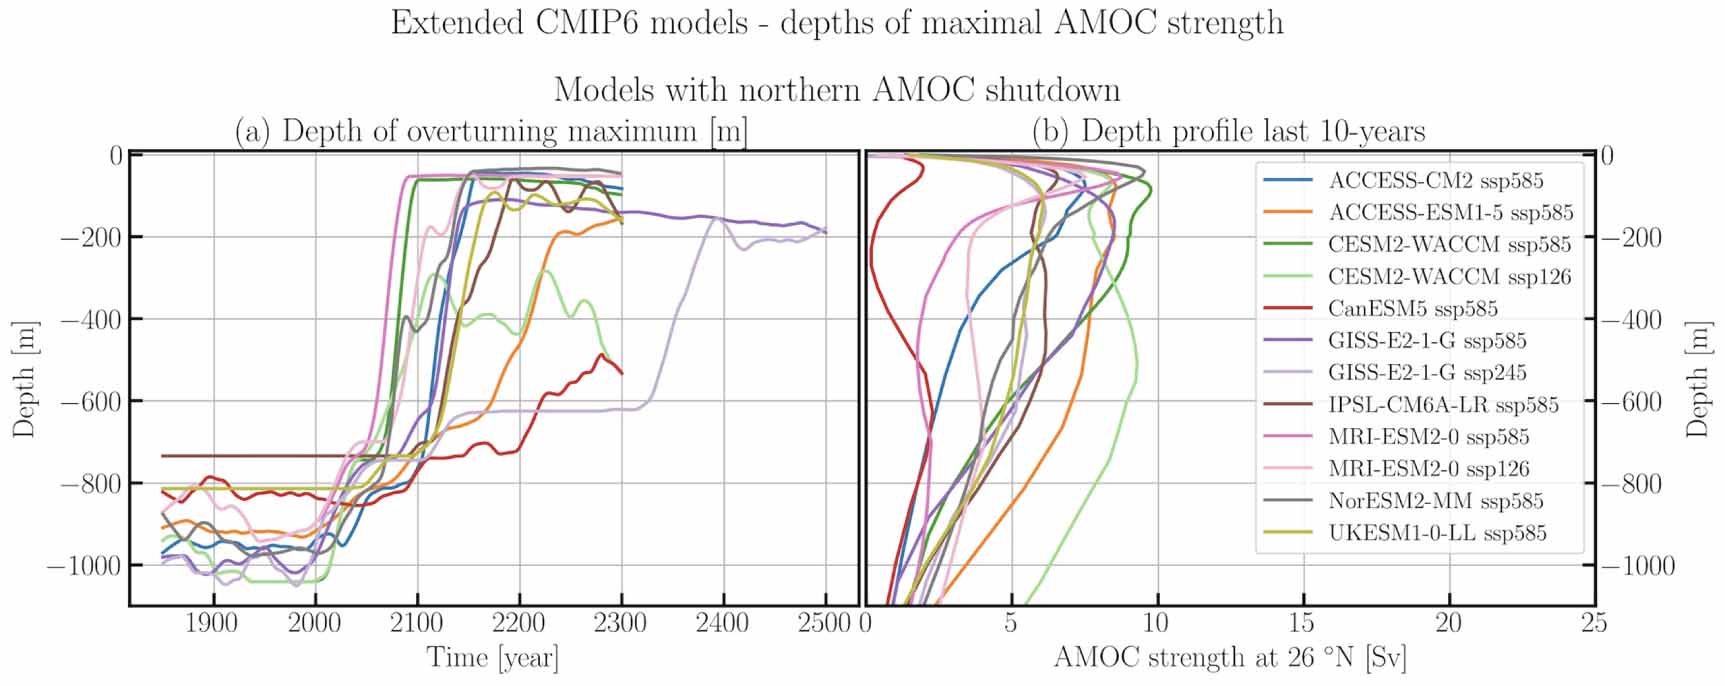
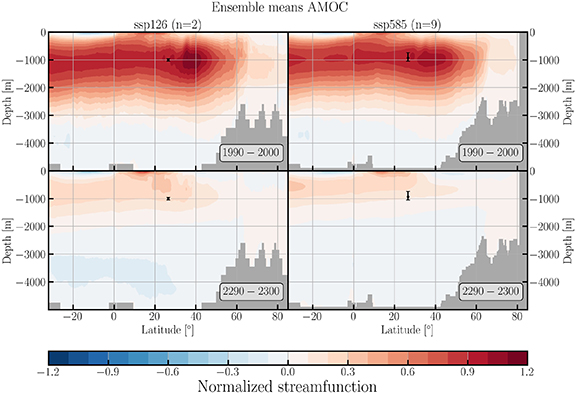
Figure 3. The multi model mean AMOC stream function for the SSP126 and SSP585 scenario-runs in which the northern AMOC shuts down, scaled by the 1950–2000 mean value at 26°N. Upper panels 2090–2100 averages, lower panels 2290–2300 values indicating the transition to a shallow overturning with downwelling south of 30°N.
Download figure:
Standard image High-resolution image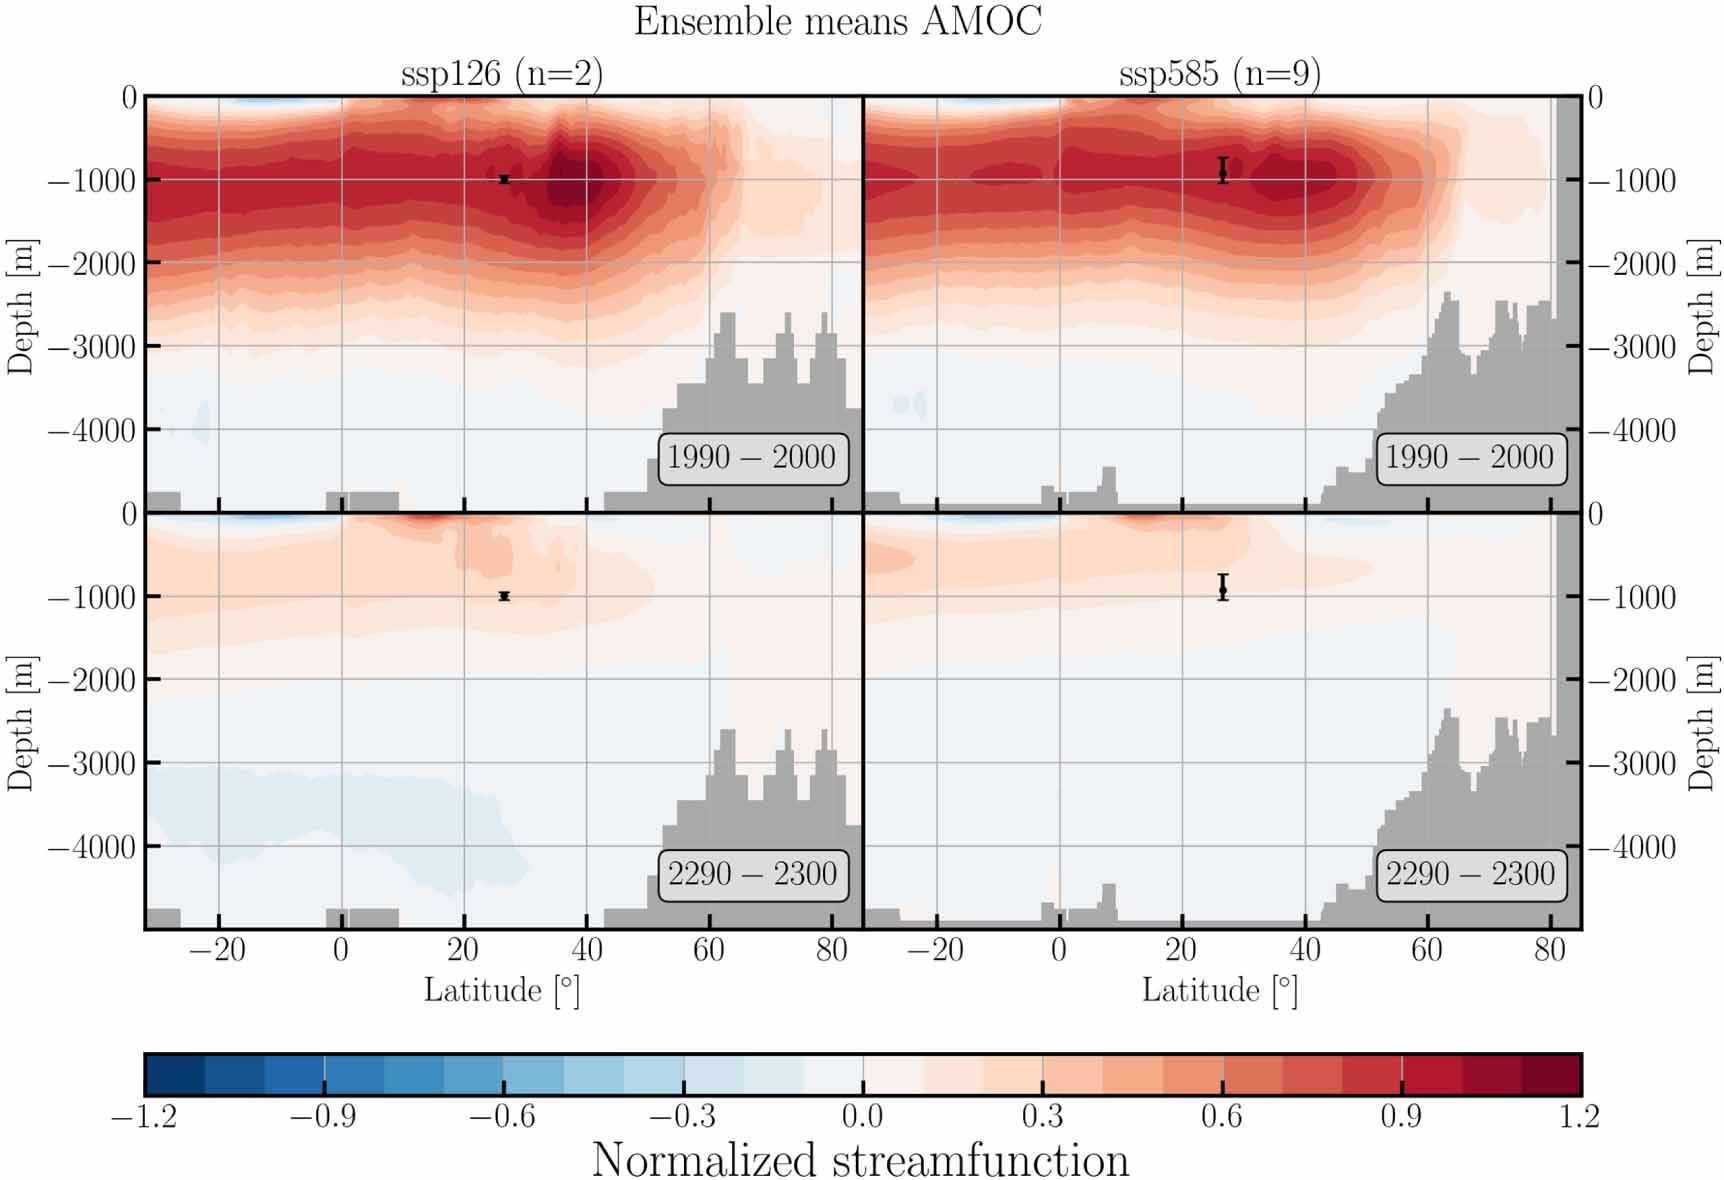
Based on figures 1–4, we define a northern AMOC shutdown when net northward transport below the mixed-layer is less than 2.5 Sv and the streamfunction at the depth of its 20th century maximum is less than 6 Sv. Using these thresholds for the AMOC at 26°N is consistent with the 5 Sv threshold at 45°N found in hosing experiments [24], below which the AMOC did not recover in these simulations. It is also consistent with the evolution of the ten members of the extended SSP245 GISS-E2-1-G runs (bottom panel in figure 4). Note that the AMOC is weaker at 45°N than at 26°N, and the decrease is somewhat larger there (figure 3). The latitude 26°N is most relevant for climate as it is where ocean heat transport peaks [25], and the AMOC has been monitored there since 2004 by an observing system, the RAPID-MOCHA array [26, 27]. The downward trend of 0.8 Sv per decade as measured by the RAPID-MOCHA array [21] closely corresponds to the smoothed decline over the same period in the models (figure 1), although it should be noted that this trend is not or only barely statistically significant in view of the relatively short time series and strong interannual variability [21, 28]. Therefore the correspondence could be coincidental, but the RAPID-MOCHA time series is consistent with the decline in the scenario runs featuring a northern AMOC shutdown (figure 1).
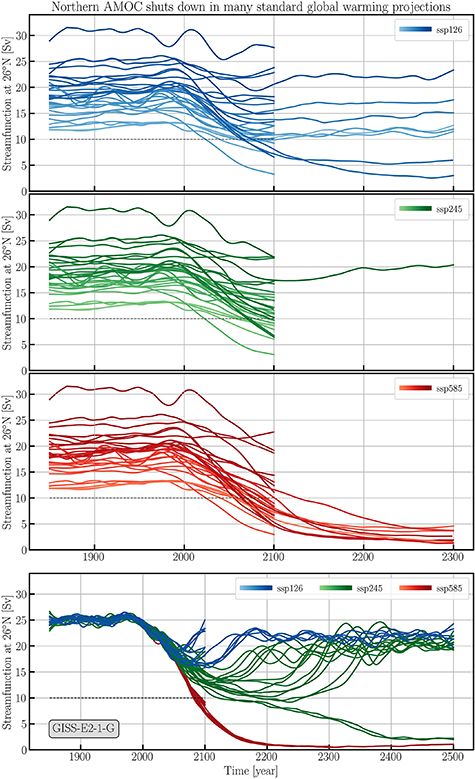
Figure 4. Upper 3 panels: AMOC evolution in all model-runs analysed with ensemble mean values in case of multiple ensemble members for the three emissions scenarios, excluding the GISS-E2-1-G model. Lower panel: all ensemble members of the GISS-E2-1-G model for the three emissions scenarios. The stippled line at 10 Sv indicates the threshold in year 2100 below which we assess model simulations run till 2100 are en route to a northern AMOC shutdown; see also supplementary material.
Download figure:
Standard image High-resolution image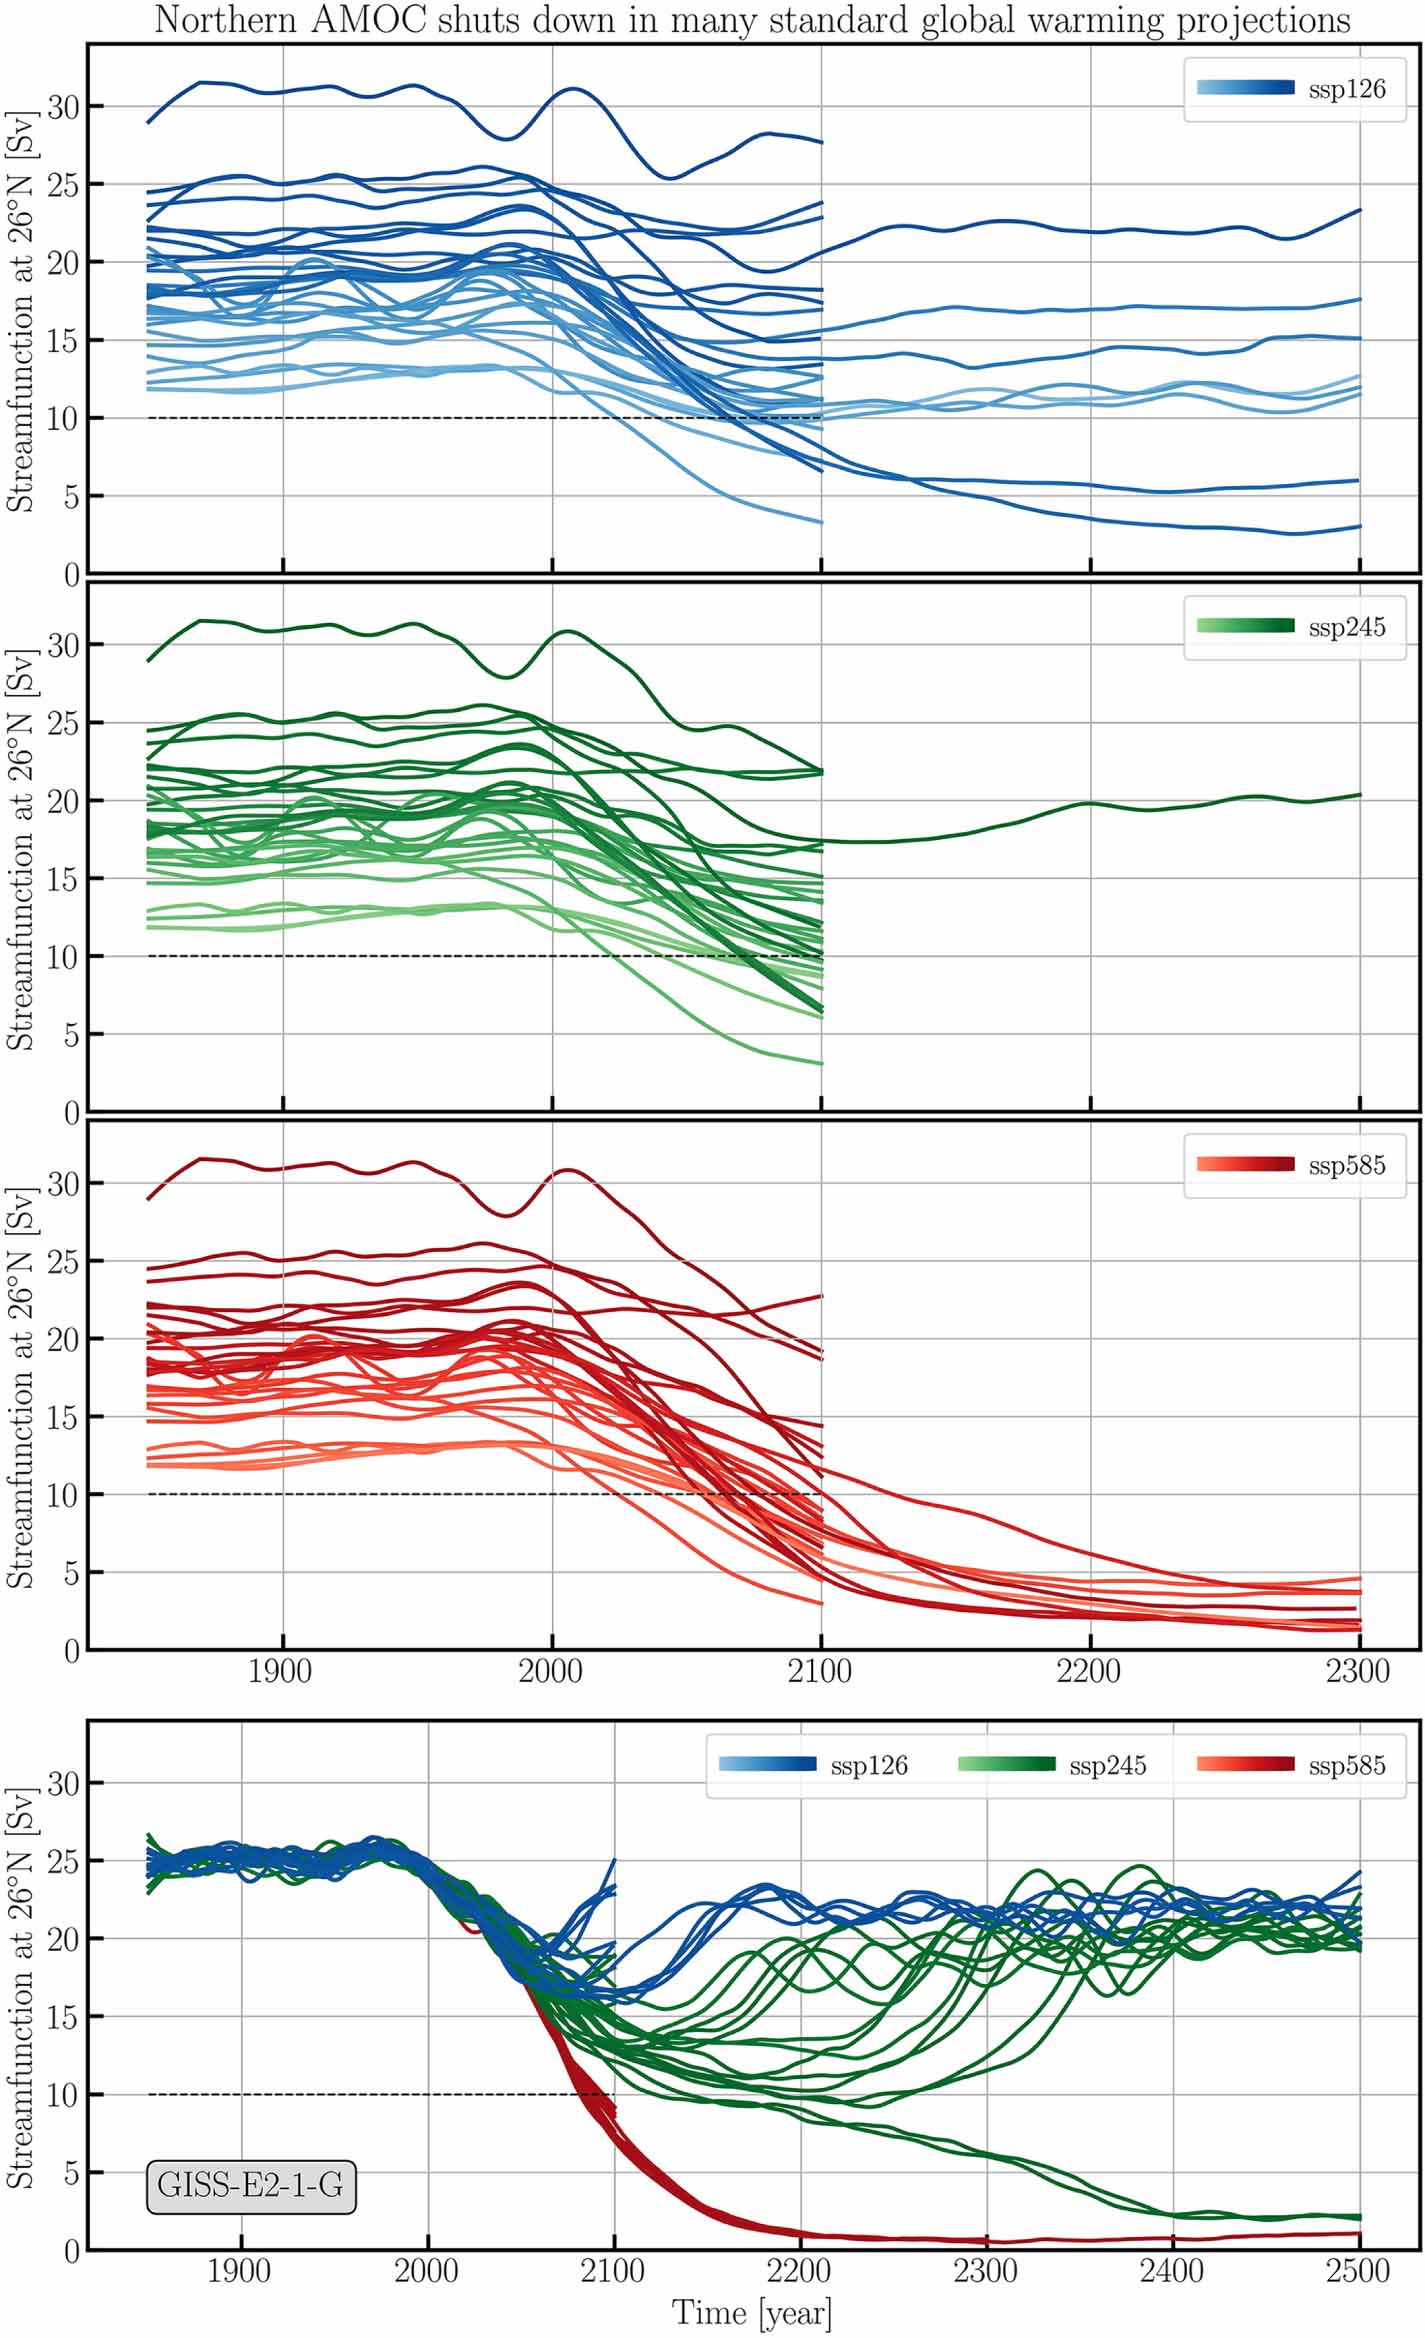
Only two models (GISS-E2-1-G and GISS-E2-2-G) have been continued beyond 2100 with an intermediate emission scenario (SSP245, figure 2, green curves in 2nd and 4th panel). In the former model, in 2 out of 14 ensemble members the AMOC declines below 10 Sv in the mid-22nd century and eventually evolves to a northern AMOC shutdown, while in other GISS-E2-1-G members the AMOC recovers, the difference merely being somewhat different initial conditions, i.e. started in the last 200 years of a 7500 year pre-industrial control run with 20 year intervals between the ensemble members [29]. This behaviour was interpreted as a noise-induced transition when the AMOC comes close to its tipping point in this model. In GISS-E2-2-G none of the five members shows a northern AMOC shutdown.
Even in a low-emission scenario in accord with the Paris agreement (SSP126), the AMOC evolves to a northern AMOC shutdown in 2 out of 9 extended runs (figure 1). In one model, MRI-ESM2-0, the AMOC evolution in the high- and low-emission scenarios is very similar, suggesting a tipping point may already have been passed before year 2050, when the forcing in the low-emission scenario starts to decrease, or even already at the beginning of this century, given the over 50 year time scale for a northern AMOC shutdown to unfold (see supplementary material).
Irrespective of emission scenario, in all extended model runs where the AMOC weakens to less than ∼10 Sv by 2100, the AMOC evolves further to a northern AMOC shutdown after 2100 (figure 4 and supplementary material). If this were also the case for models which have not (yet) been extended, then this would imply that for high emission scenarios (SSP585), 57% of all non-extended models are en route to a northern AMOC shutdown by 2300, thus 70% of all models if we add the nine extended ones. Note that this criterion is conservative, as three extended models which do not drop below 10 Sv by 2100 nevertheless reach a northern AMOC shutdown later, albeit more slowly. By this criterion the risk of a northern AMOC shutdown is much lower for the intermediate (37% of all models, SSP245) and low-emission scenarios (25%, SSP126).
3.1. Mechanisms of northern AMOC shutdown
The existence of an AMOC tipping point has been confirmed in the full climate model hierarchy [30] up to a modern complex global climate model [31] and recently in a strongly eddying global ocean model [5]. The CMIP6 simulations are not designed to reveal possible tipping points. Even when a tipping point is crossed, the rate of AMOC decline in the time series of figure 1 does not necessarily show where that tipping point is. One reason is that the increase in forcing (i.e. greenhouse gases), occurs on a similar time scale, i.e. O (100 years), as the AMOC continues to decline after passing the tipping point [5], (figure 1). That is one reason why model experiments to locate tipping points are conducted with a very slow increase in forcing [31, 32].
A critical part of the causal chain with a faster response time scale is the deep convection in the northern North Atlantic, typically occurring in late winter to early spring at times when surface layer density reaches a maximum and vertical stratification is at its lowest. Since this is thermally driven convection, with colder surface waters being mixed with somewhat warmer deep waters, this mixing warms the surface, increases surface heat loss and evaporation, and thus cools and densifies the water column down to greater depths—a crucial process for the density-driven AMOC, although it should be noted that the link between convection and AMOC is complex and water mass transformation involves more than convective mixing [33]. Ocean convection is known to have a tipping point itself, the Welander mechanisms [34]: the northern convection regions are net-precipitation regions, so in the absence of deep mixing, freshwater tends to accumulate in the surface layer, increasingly inhibiting mixing that is otherwise forced by heat loss. This is another self-amplifying feedback which can shut down deep convection in the northern Atlantic [35, 36].
The depth of the surface mixed layer in March, is shown for two representative models, henceforth abbreviated as MRI and UKESM (figure 5). These two models are further investigated as they have deep convection sites over all three (Labrador, Irminger, Iceland) basins. The remaining models are presented in the supplementary material. Convection depths feature significant variability up to approximately year 2000 but start a continuous decline after that. In the high-emission scenario, in both models deep convection has ceased by the mid-21st century, leaving only a typical wind-mixed surface layer depth of the order of 100–200 m at most (we take a maximum mixed-layer depth of 250 m as threshold indicating a cessation of deep convection). In the low-emission scenario, deep convection in the Nordic Seas declines more slowly. In MRI, halfway through the 22nd century all deep convection has ceased, while in UKESM it remains active especially in the Nordic Seas, albeit with a much shallower mixed layer depth than before 2000. This is consistent with the AMOC not evolving to a northern AMOC shutdown in UKESM, contrary to MRI, but weakening considerably. While a shutdown of part of the deep convection areas will weaken the AMOC, a shutdown of all deep convection areas must be considered a precursor of a transition to a northern AMOC shutdown.

Figure 5. Map of deep mixing or convection (a), (b) and time series of mixing depths (c), (d) in two representative models, MRI and UKESM. The other models are shown in the supplementary material. The geographical areas enclosed by an orange contour are defined by demanding the March mixed layer between 1965–1995 is deeper than 650 m. The division between Labrador and Irminger Sea is approximately west and east of the southern tip of Greenland and further based on a cluster recognition algorithm.
Download figure:
Standard image High-resolution image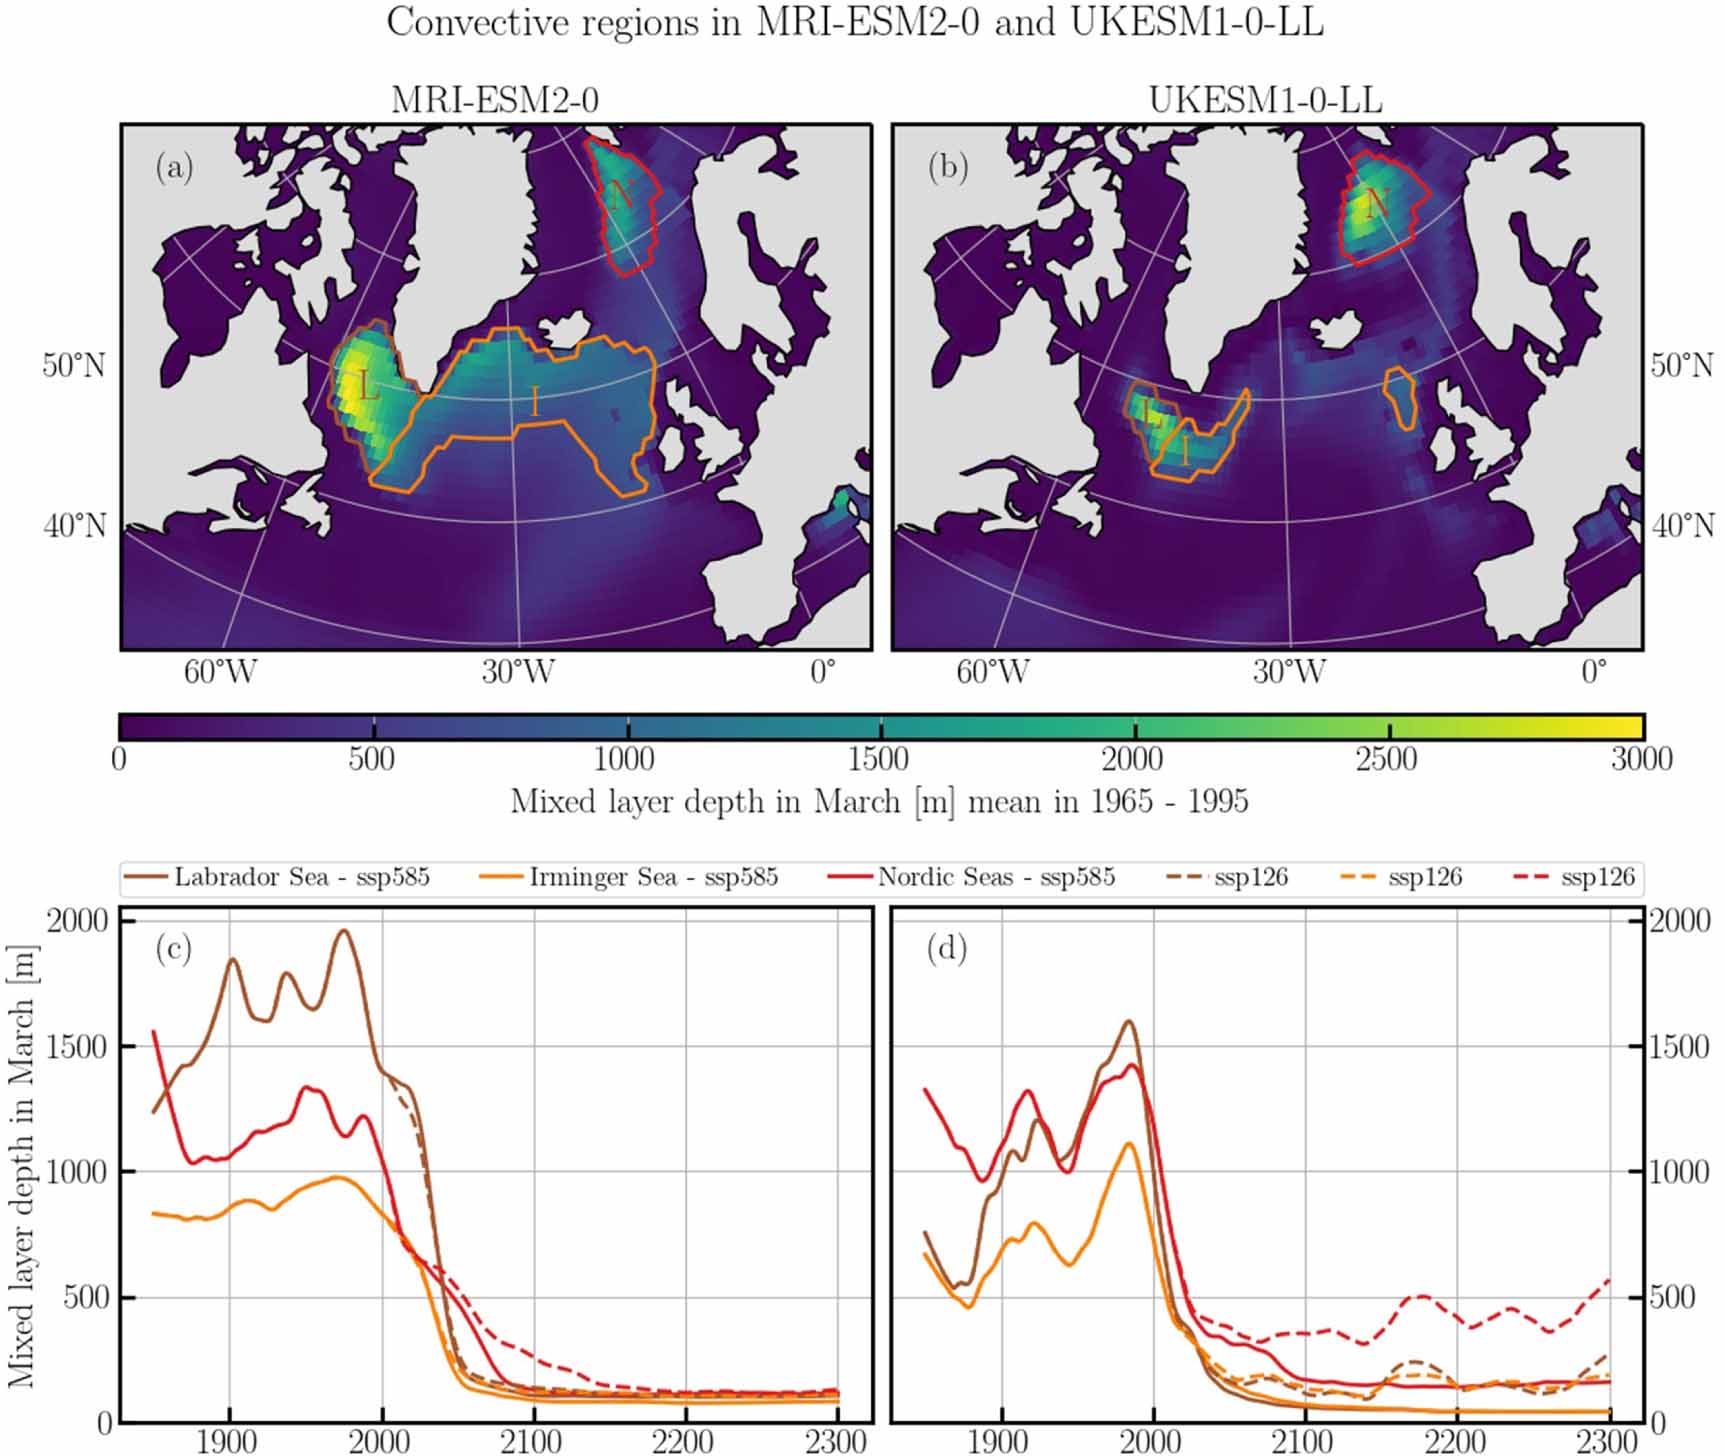
Deep convection in the Nordic Seas appears more resilient to global warming than convection in the subpolar gyre (SPG, i.e. Labrador and Irminger Seas), possibly related to differences in stratification, and state-dependent responses can be expected [5]. Previous studies have shown than many CMIP5 and CMIP6 models feature a deep-convection collapse by 2050 in the SPG region [37, 38]. This leads to rapid cooling over the northern Atlantic ‘with a substantial effect on surface temperature over Europe, precipitation pattern in the tropics … and a possible impact on the mean atmospheric circulation’ [37]. Thus, even if this does not lead to a northern AMOC shutdown the societal impacts would likely be serious [2, 39, 40].
Observation-based data products of mixing depths in the northern Atlantic (figure 6) still show large variability, so that the decline of mixing depths seen during the past 5–10 years may or may not be the beginning of the end of deep convection. But this decline is consistent with what the models project. It is a matter of concern how convection in climate models switches from a phase of internal variability to a phase of terminal decline around the current time (figures 5(c) and (d)), even though mixed-layer depths in the models are overestimated [20].
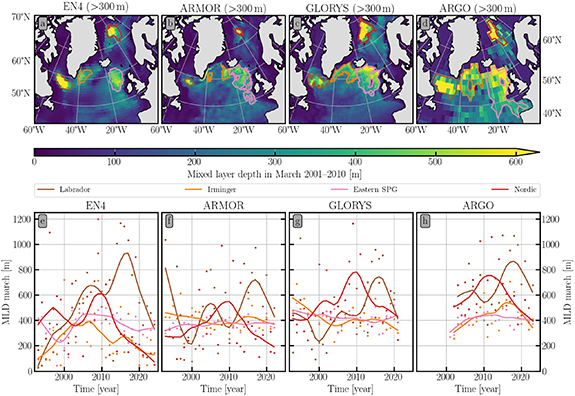
Figure 6. Climatological mean march mixed layer depth (a)–(d) derived from the EN4 [41], ARMOR [42], GLORYS [43] and ARGO [44] datasets (for Argo we take the maximum as the set is not gridded and shows many gaps when taking one month), together with their timeseries (e)–(h), plotted with a 10 year lowess filter (solid lines) and dots (annual values) for the Labrador Sea, Irminger Sea, eastern SPG, and Nordic Seas. The regions were selected on basis of the depth criterion in the tile of panels (a)–(d), as different data products use different definitions of the mixed layer depths, and the absolute values of the different datasets are not expected to align.
Download figure:
Standard image High-resolution image
3.2. The role of surface buoyancy fluxes versus oceanic changes
Figure 7 shows that the sea surface salinity in the convection regions declines during a collapse of deep mixing but remains rather stable in at least one convective region when the northern AMOC does not shut down, because a convection collapse and shutdown of the northern AMOC cuts off supply of saltier water from the subtropics to the North Atlantic subpolar areas, while surface flux changes play only a minor role. In UKESM the northern AMOC does not shut down for low emissions and the AMOC stabilises around 11–12 Sv.
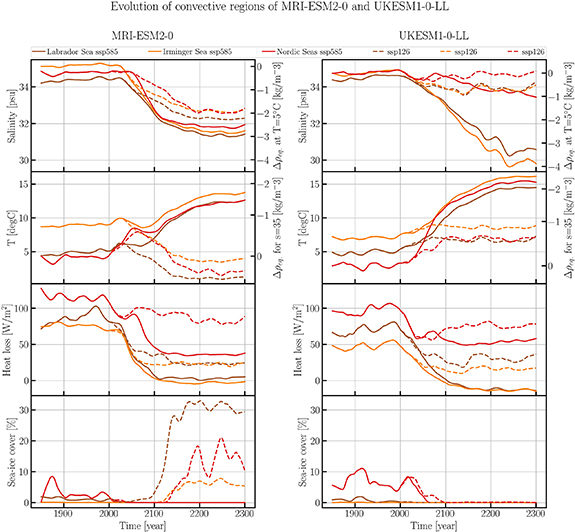
Figure 7. Changes in surface layer salinity and temperature, ocean surface heat loss and sea-ice cover in MRI and UKESM for a low (dashed lines) and a high (solid lines) emission scenario. The variables shown are averaged over the convective areas shown in figure 5. Note that the northern AMOC shuts down for both low and high emissions in MRI, but only for high emissions in UKESM (figure 1), where some Nordic Sea convection continues for low emissions.
Download figure:
Standard image High-resolution image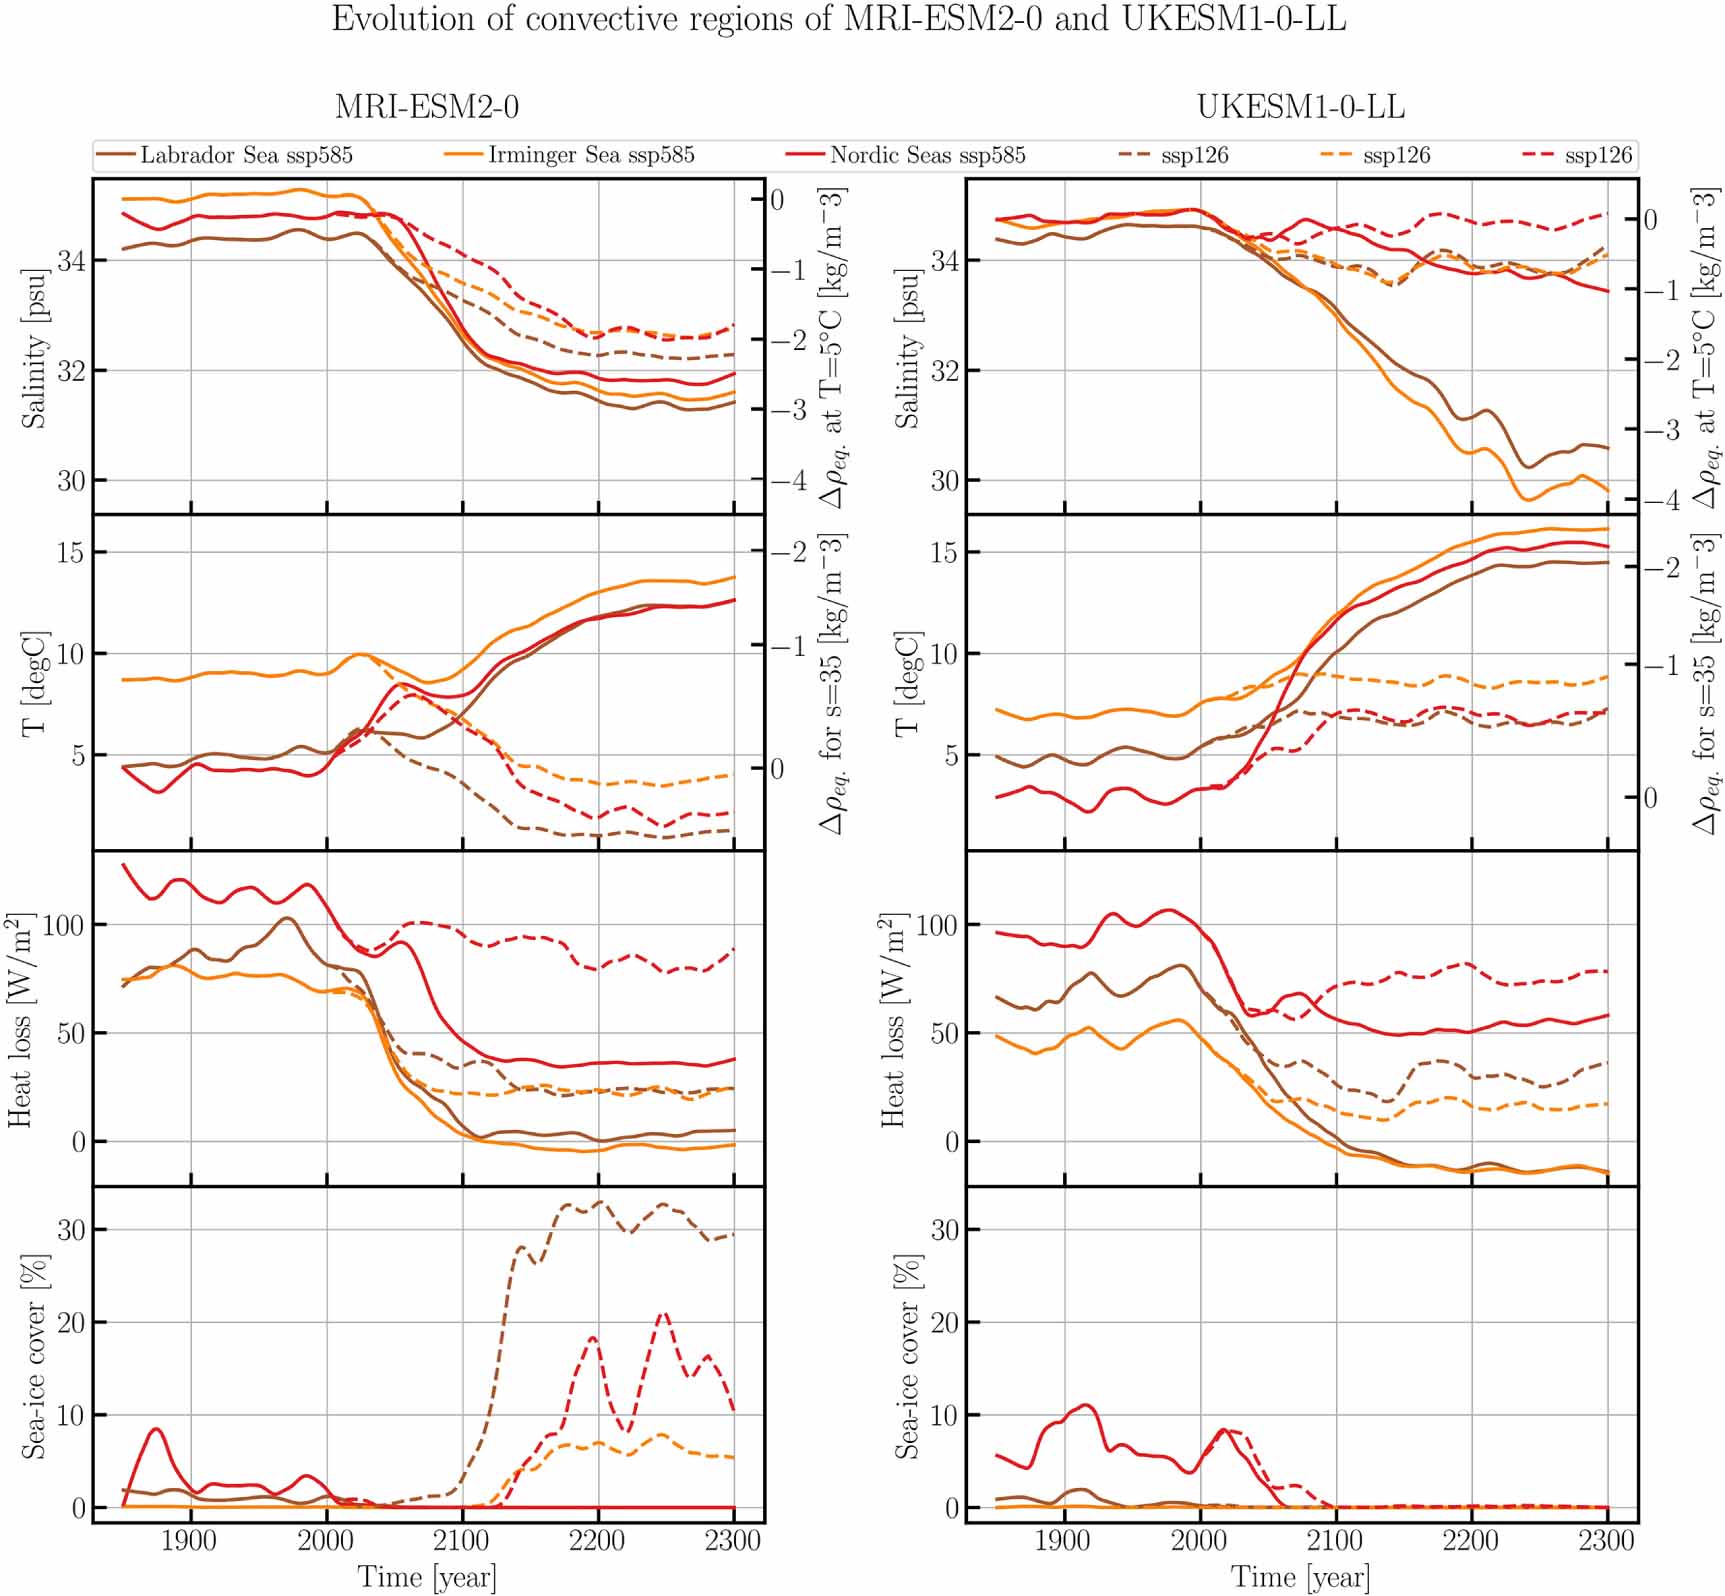
Temperature, on the other hand, can either drop or increase during a northern AMOC shutdown depending on emissions scenario, due to the competing effects of reduced AMOC heat transport versus warming due to greenhouse gases. The latter overwhelms the AMOC-induced cooling in high-emission scenarios [2]. When a northern AMOC shutdown occurs in a low-emission scenario, the resulting regional cooling is amplified by a large increase in sea-ice cover, a strong positive feedback.
The scales on the right of figure 7 show that the salinity effect on surface density dominates during such a northern AMOC shutdown, regardless of whether warming adds to the density decline for high emissions, or cooling counteracts it for low emissions. This scenario is confirmed by similar analysis of other models in which the northern AMOC shuts down. The dominant effect of salinity on density in the convection regions demonstrates the combined effects of reduced vertical mixing (Welander feedback) and advective salt transport (Stommel feedback) as key destabilising feedbacks. The decline in mixed-layer depths leads AMOC decline on average by ∼30 years (compare figures 5 and 1, and supplementary material).
Recently, it was suggested that a sign change in the surface buoyancy flux over the North Atlantic deep mixing regions is a precursor for a forthcoming AMOC tipping event [5, 45]. Figure 8 shows that the surface buoyancy flux change during a northern AMOC shutdown (green lines) is dominated by the declining surface heat loss to the atmosphere (red lines). This, however, is part of a negative feedback which balances the declining amount of heat transported into the convection regions by the AMOC, hence its effect on the buoyancy in the upper ocean is smaller than that of salinity, as discussed above for figure 7, see also [5]. We also note that in UKESM the green straight line does not clearly change sign, but this is due to the Nordic Seas. In the SPG the sign-change is more there invoking the salt-advection feedback that then also forces the mixed-layer shutdown in the Nordic Seas, see also figure 4 for the later timing of the Nordic Seas mixed-layer decline (red line) compared to Labrador and Irminger Seas mixed-layer decline (yellow and brown lines).
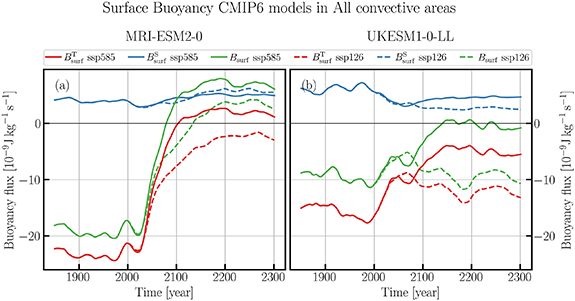
Figure 8. Changes in heat and freshwater exchange between ocean and atmosphere over the convective areas shown in figure 5 in terms of buoyancy (surface density becoming lighter if the term is positive) in the ocean for MRI and UKESM and scenarios as in figures 5 and 7. Superscript T refers to heat flux (positive ocean heat gain, negative ocean heat loss), superscript S refers to freshwater gain.
Download figure:
Standard image High-resolution image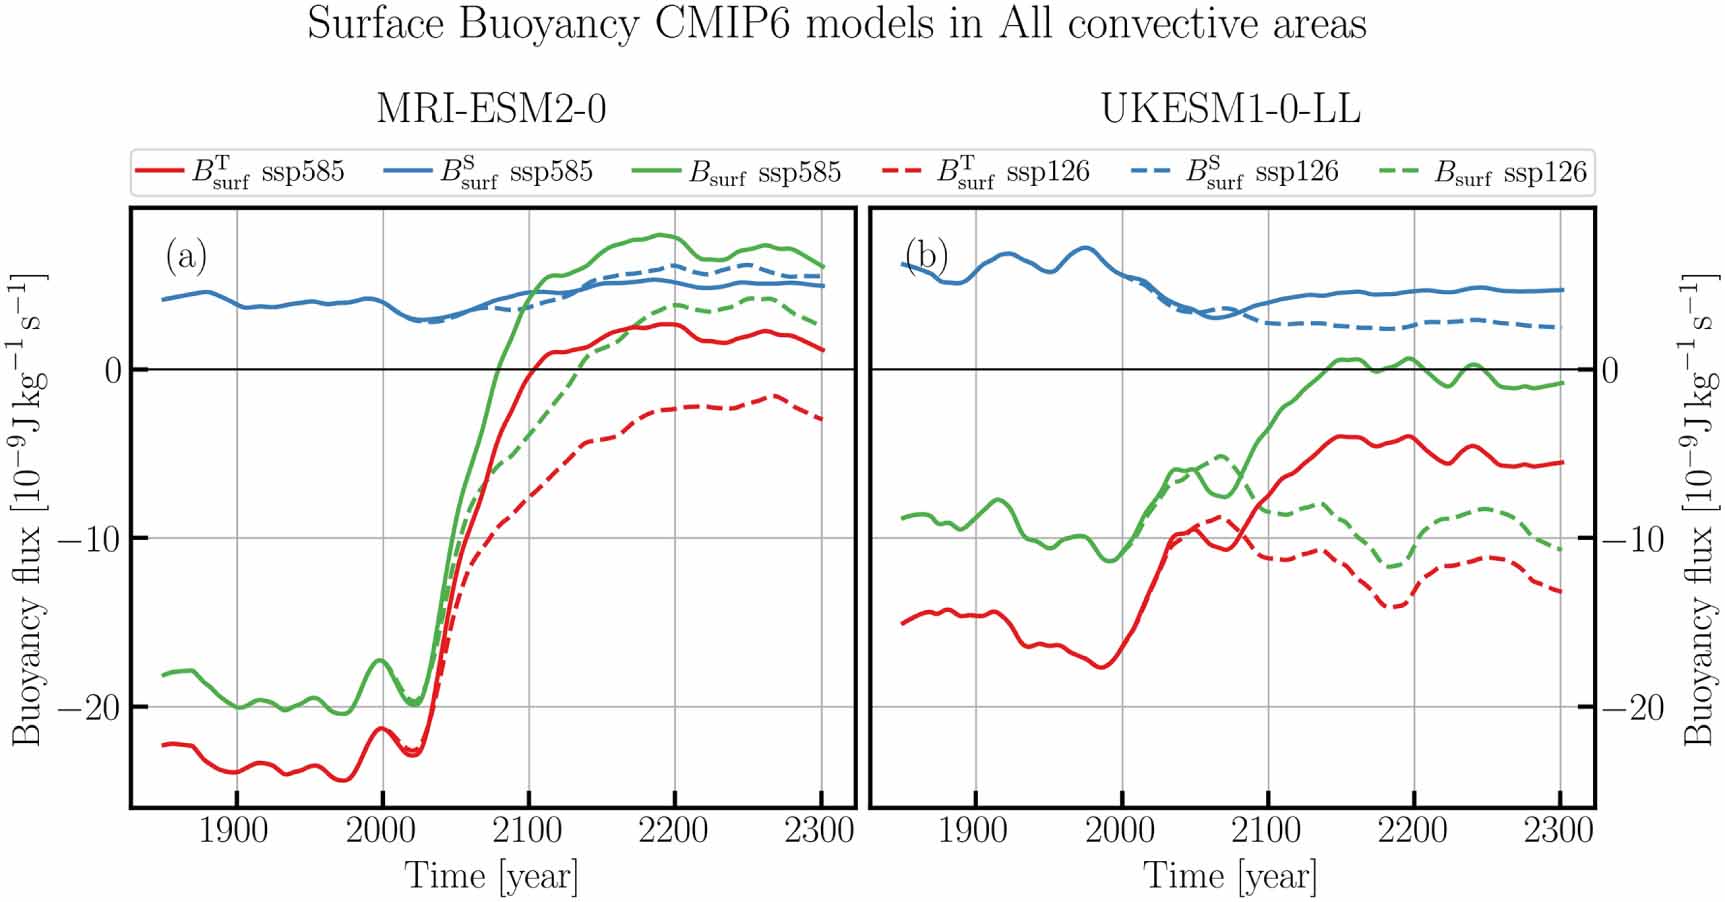
Figure 8 also demonstrates that changes in freshwater forcing (blue lines) are an unlikely trigger for the deep-mixing collapse and onset of the northern AMOC shutdown. It is the changing heat flux, i.e. decreasing heat loss to the warming atmosphere (purple lines) that seems to trigger the decrease in deep mixing and AMOC, despite the smaller effect of temperature changes on surface buoyancy compared to salinity. This implies that the salt-advection feedback by the AMOC must be triggered by global warming but thereafter becomes the dominant factor in changing surface buoyancy. This scenario may differ from what is inferred from experiments in which climate models are forced by fixed heat and freshwater fluxes from a simulation using increasing greenhouse gases [46, 47]. Fixed heat flux-forced runs already contain the response by the AMOC that modifies the heat fluxes by decreasing its heat transport when declining, see also [47]. As a result, the salt-advection feedback from the AMOC can be shown to dominate AMOC decline [47], but here we show with figure 8 that it needs to be triggered by the warming.
Of particular concern is our finding that deep convection in many models stops in the next decade or two, and that this is a tipping point which pushes the northern AMOC into a terminal decline from which it will take centuries to recover, if at all. As a result, CMIP6 models point to a significantly higher risk than previously assumed for the AMOC to evolve to a state in which the northern AMOC has vanished [1, 48]. Although the whole AMOC does not completely shut down to 0 Sv, consistent with the evolution of CMIP6 models forced under extreme climate change [49], the heat transport in these states is greatly reduced and the ocean’s net heat release north of 45°N (green curves) essentially disappears (figure 9). This can cause major surface cooling, unless it is more than compensated by greenhouse-gas induced global warming under high emissions.
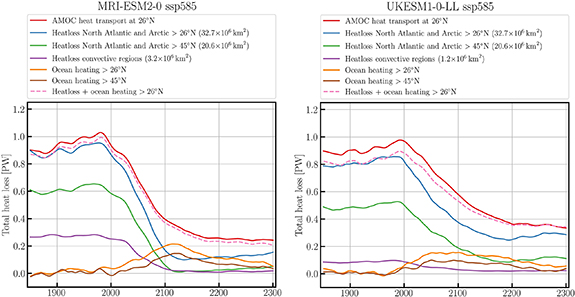
Figure 9. Atlantic Ocean heat transport at 26°N (red curve) with net ocean heat loss (sum of up minus downwelling long- and shortwave radiation and sensible and latent heat fluxes) to the atmosphere north of 26°N (blue curve) and ocean heat storage north of 26°N (orange curve). The sum of those two is given by the stippled red curve and the difference between the straight and stippled red curves is due to Bering Strait heat transport, horizontal diffusion across 26°N, possible eddy-induced heat transport across 26°N and sea-ice melt north of 26°N. The green curve shows net ocean heat loss to the atmosphere north of 45°N where Europe is warmed by the AMOC; the brown curve shows ocean heat storage north of 45°N and the purple curve net ocean heat loss to the atmosphere from the convective areas in the model. Left panel for MRI and right panel for UKESM, both for the SSP585 simulations.
Download figure:
Standard image High-resolution image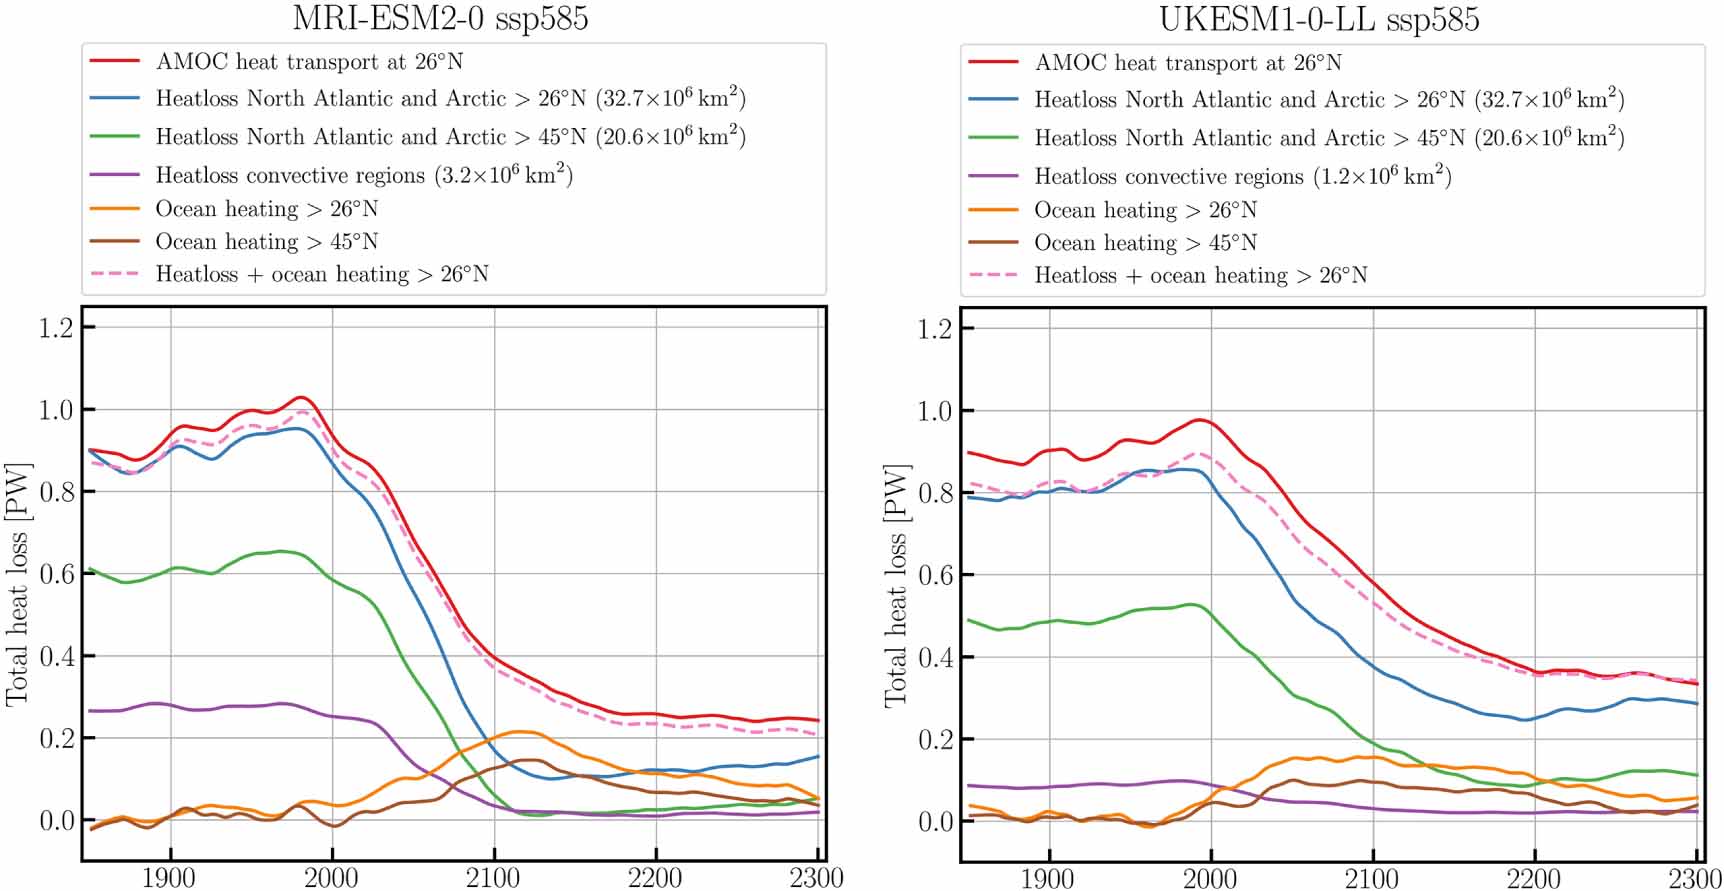
Previously, a threshold of 5 Sv for the AMOC at 45°N after applying freshwater hosing [24] was suggested to characterise an AMOC that remains in a weak state and does not recover. Our thresholds of 6 Sv at the depth of its 20th century maximum at 26°N, together with a 2.5 Sv threshold for net northward transport below the mixed-layer are consistent with aforementioned threshold. Below these thresholds the shallow residual AMOC no longer possesses adiabatic pathways between the SPG and the Southern Ocean and becomes strongly diffusive [50, 51], largely determined by the patterns of wind forcing. This is further corroborated by figure 9 showing the lack of oceanic heat release to the atmosphere north of 45°N after a northern AMOC shutdown.
All AMOC projections shown in figure 1 evolve to a state without NADW cell using the 6 Sv and 2.5 Sv thresholds. But when the forcing increases slowly, the northern AMOC shutdown evolves over 50–100 years [2, 11, 45, 52]. This 50–100 year timescale for a northern AMOC shutdown has important consequences. First, when projections ending in year 2100 do not show such northern AMOC shutdown this does not imply that the northern AMOC is not in the process of vanishing in those simulations, but simply that the length of the simulation was too short to show whether models are en route to a northern AMOC shutdown or not. This is also the reason why only when analysing extended simulations, the northern AMOC shutdown becomes apparent. Second, this also means that the term ‘abrupt’ is not applicable to a northern AMOC shutdown triggered by realistic forcing scenarios of global warming and/or Greenland meltwater added. An abrupt collapse only occurs after massive amounts of freshwater hosing applied in idealised studies, e.g [2, 3].
It should be noted that the models still contain several limitations, including the neglect of increasing meltwater from Greenland, the effect of which was recently underscored [14]. Its effect was also studied in a special AMOCMIP [52] model intercomparison. Under a strong emission scenario half of the models transitioned to a northern AMOC shutdown after 2100. Under a medium emission scenario none of the models showed such transition. By comparing runs with and without Greenland meltwater forcing it was concluded that meltwater forcing did enhance the weakening of the AMOC but was of secondary importance compared to other effects of global warming. These results reinforce the increased likelihood of a northern AMOC shutdown that we found, where such states without an NADW cell are now also found in models forced by intermediate- and low-emission scenarios.
In addition, climate models also contain various biases affecting AMOC stability and AMOC evolution in their projections. Mixed layers are often too deep [20], compare e.g. figures 5 and 6, but the convection collapse in the projections seems not related to the simulated mixed layer depths in historical runs. Overflow waters mix too much with overlying light water and contain incorrect water mass characteristics [53]. Much of the water mass transformation feeding into the AMOC occurs within or near boundary currents that are not well resolved [54, 55]. Also, eddies are important for exchanging water between the convective interior and boundary currents. However, because eddies re-stratify the water column [56], for the current non-ocean-eddy-resolving climate models this implies the absence of a positive feedback on a freshwater-forced convection collapse. The same models also underestimate shorter term AMOC-variability compared to observations [57] and this extends to ocean-atmosphere coupling and the North Atlantic Oscillation [58, 59], and the simulation of the cold SSTs in the North Atlantic SPG [60]. Furthermore, many models possess a salinity bias leading to a too stable AMOC [12]. Recent eddy-resolving model experiments suggest a larger impact of Greenland meltwater when eddies are present [61, 62] and an eddy-permitting model was able to maintain a stable northern AMOC shutdown for 450 years [63], and recently a northern AMOC shutdown was also found in a strongly eddying global ocean-only model [5]. On the other hand, the models appear too sensitive to aerosol forcing [64] and this could lead to the modelled AMOC being too sensitive to future emission scenarios that contain large aerosol removal. This may also explain part of the discrepancy between modelled AMOC evolution over the historical period and reconstructions [1]. By and large, we cannot be certain whether CMIP6 model biases would under- or overestimate the risk of a northern AMOC shutdown.
As far as current models suggest, we conclude that the risk of a northern AMOC shutdown is greater than previously thought [1, 48], at least when concerning the recent CMIP6 model ensemble. A larger sensitivity of CMIP6 than CMIP5 models concerning the AMOC response to global warming was also inferred from a previous heat transport analysis, even when corrected for the larger climate sensitivity in CMIP6 [18]. In the CMIP6 ensemble a northern AMOC shutdown by 2300 occurs in 67% of all model-runs in an SSP585 scenario; 30% of all model-runs in an SSP245 and 21%, in an SSP126 scenario. Such numbers do no longer comply with the low-likelihood-high-impact event that is used to discuss an abrupt AMOC collapse in AR6 [1] and this assessment needs to be revised in AR7.
We acknowledge the World Climate Research Programme’s Working Group on Coupled Modelling, which is responsible for CMIP, and we thank the climate modelling groups for producing and making available their model output. For CMIP the U.S. Department of Energy’s Program for Climate Model Diagnosis and Intercomparison provides coordinating support and led development of software infrastructure in partnership with the Global Organization for Earth System Science Portals. We acknowledge the World Climate Research Programme, which, through its Working Group on Coupled Modelling, coordinated and promoted CMIP6. We thank the climate modelling groups for producing and making available their model output, the Earth System Grid Federation (ESGF) for archiving the data and providing access, and the multiple funding agencies who support CMIP6 and ESGF. The CMIP6 data was accessed and analysed using the UK super-data-cluster JASMIN and Netherlands super-computer-cluster SURFsara.
S D and J R A received funding from OptimESM and SD from TipESM. ‘TipESM ‘Exploring Tipping Points and Their Impacts Using Earth System Models’ is funded by the European Union, Grant Agreement No. 101137673.’ OptimESM ‘Optimal High Resolution Earth System Models for Exploring Future Climate Change’ is funded by the European Union, Grant Agreement No. 101081193. S D and J M received funding from ISOTIPIC. ‘ISOTIPIC’ Interacting ice Sheet and Ocean Tipping—Indicators, Processes, Impacts and Challenges’ is funded by the National Environmental Research Council, UK, under Grant No. NE/Y503320/1.
The CMIP6 data used in this study is freely available at https://esgf-node.llnl.gov/search/cmip6/. The observation-based data is available on the EN4, Copernicus and Argo webpages in the references list.