Rising greenhouse gases have driven an imbalance between sunlight absorbed by the planet and infrared radiative emission to space, leading to an accumulation of energy and warming climate (Arias et al 2021). The planetary heating rate has grown since the 1970s (von Schuckmann et al 2023), indicating an acceleration of climate change (Minière et al 2023). This global net energy imbalance has continued to increase since 2000 based on satellite and ocean data, mostly due to a reduction in reflected sunlight (Goode et al 2021, Loeb et al 2021, Stephens et al 2022, Fernández and Georgiev 2023, Hansen et al 2025) that is linked to cloud and aerosol changes as well as reduced sea ice coverage (Raghuraman et al 2021, Hodnebrog et al 2024, Loeb et al 2024). Determining the extent to which energy budget changes are driven by aerosol cloud-microphysical effects, indirect effects of radiative forcings on atmospheric stability and circulation, cloud feedbacks to sea surface temperature (SST) patterns or internal climate variability are vital for near term predictions (Goessling et al 2024). Record levels of the net imbalance and global surface temperatures in 2023 (Blunden and Boyer 2024) accentuate the need to advance understanding of linkages between Earth’s energy imbalance, ocean heating and surface warming (Schwartz 2007, Gregory et al 2024, Kuhlbrodt et al 2024).
In this letter, reanalysis data is combined with satellite observations to assess the spatial signal of the growing energy imbalance and to develop a conceptual picture of how it is driving ocean heating since 1985, up to the most recent record warming of the 2023/24 El Niño event. Details of the datasets are introduced within the narrative of the paper, which first outlines global changes in Earth’s energy budget (section 2), investigates the spatial structure of changes (section 3), develops a simple energy budget approach to understand ocean warming (section 4) and discusses the role of energy budget changes in explaining the unprecedented levels of Earth’s net energy imbalance and ocean surface temperature in 2023 (section 5).
Earth’s net energy imbalance (N) displays a substantial variability in deseasonalised global means of  2 Wm−2 since 1985 (figure 1(a)). Observations are from the Clouds and the Earth’s Radiant Energy System (CERES) series of instruments operating since March 2000 (Loeb et al 2018) and the DEEP-C v5 reconstruction 1985–2020 that combines CERES with Earth Radiation Budget Satellite Wide Field of View v3 measurements, atmospheric reanalyses and climate modelling (Allan et al 2014, Liu et al 2020). CERES radiative fluxes were derived from satellite measured radiances using scene dependent angular dependence models (Loeb et al 2018) and multiple instruments observed the globe onboard the Terra, Aqua and NOAA-20 polar orbiting platforms. Since the CERES data are unable to measure N to better accuracy than ∼4 Wm−2, they are calibrated using 2005–2015 ocean heating data (Wong et al 2020) and assumptions about heating of other components of the climate system (Loeb et al 2012, 2018). The CERES (EBAF Ed4.2) data uncertainty of ±0.2 Wm−2 primarily relates to 0–2000 m ocean heating trends from Argo floating buoys that are used to anchor the satellite observations (Loeb et al 2024). However, the stability of the CERES instruments means that they are capable of accurately tracking changes in global and regional top of atmosphere radiative fluxes over time. Therefore, the CERES EBAF dataset combines the absolute accuracy of ocean observations with the temporal stability and regional coverage of the satellite measurements. CERES global means are here computed using geodetic weights as a function of latitude to more accurately calculate area weighting by considering the Earth as an oblate spheroid (Loeb et al 2018). Annual averages are constructed by weighting the contribution of each month by its number of days. DEEP-C uses an earlier version (Ed4.1) of the CERES data from March 2000; prior to this, a larger uncertainty of ±0.61 Wm−2 primarily relates to temporal interpolation over data record gaps in 1993 and 1999. Trend uncertainties are determined by instrument stability, estimated to be
  0.1 Wm−2/decade for CERES (Loeb et al 2024) and ∼0.2 Wm−2/decade for DEEP-C before 2000 (Liu et al 2017). Changes in Earth’s net energy imbalance from CERES are independent of estimates from direct measurements of changes in ocean heating, so statistical agreement between these observing systems, showing a decadal increase in Earth’s energy imbalance of 0.5±0.47 Wm−2/decade (5%–95% confidence interval) from mid-2005 to mid-2019 provides confidence in their accuracy (Loeb et al 2021).
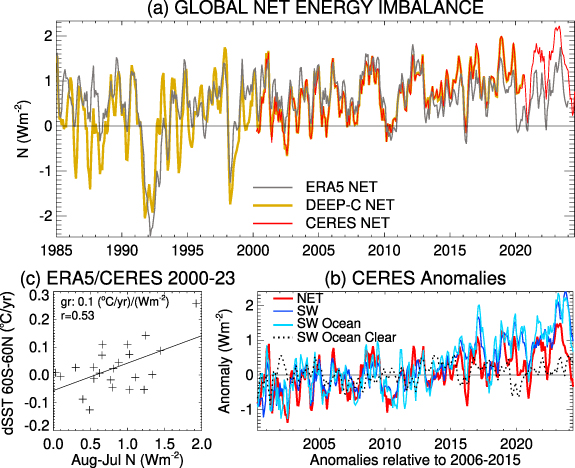
Figure 1. (a) Top of atmosphere net energy imbalance (N) 1985–2024 from CERES observations, DEEP-C reconstruction and ERA5 (seasonally adjusted relative to 2006–2015 climatology) and (b) CERES deseasonalised anomalies in global mean N and absorbed shortwave radiation (global, ocean and clear ocean) with 3 month boxcar smoothing applied; (c) relationship between annual (calendar year) rise in 60∘S–60∘N sea surface temperature (SST) and August to July average N for 2000-2023.
Download figure:
Standard image High-resolution image
The largest minima in Earth’s net imbalance (during 1991–1993) is explained by greater reflection of sunlight from the Mt. Pinatubo volcanic aerosol; lesser minima relate to mature El Niño events (1998, 2011, 2016 and 2024) where excess heat is lost from the temporarily warmer tropical east Pacific Ocean and eventually radiated out to space (Trenberth et al 2015, Loeb et al 2024). The reverse is true during cold La Niña events in which heat is more efficiently uptaken by the ocean (1999/2000, 2009/10, 2020-2022). Estimates from the ECMWF 5th generation reanalysis (ERA5; Hersbach et al 2020) reproduce the interannual variability in Earth’s energy imbalance (figure 1(a)) but does not reproduce the large increase in N since 2013 (Liu et al 2020). ERA5 combines conventional and satellite observations with a high resolution atmosphere modeling system via 4 dimensional-variational (4D-Var) data assimilation with realistic time-varying radiative forcings and SST and sea ice prescribed; deficiencies in the physical parametrizations and changes in the observing system can therefore introduce spurious regional and global changes over time. Although the DEEP-C data currently ends in 2020, the diverging estimates of net imbalance between CERES and ERA5 can be investigated up until the present.
The CERES net energy imbalance displays a remarkable increase from 0.83 Wm−2 in 2006–2020 to 1.92 Wm−2 in August 2022 to July 2023 (table 1), consistent with previous analysis and symptomatic of an acceleration in climate change (Minière et al 2023, Goessling et al 2024, Kuhlbrodt et al 2024, Loeb et al 2024, Merchant et al 2025). Much of this increase in net imbalance is explained by increased absorbed shortwave radiation over the ocean and related to cloud, given the increase is not apparent for clear-sky absorbed shortwave radiation (figure 1(b)). The divergence between the net and shortwave anomalies during 2023 signifies the increase in outgoing longwave radiation relating to the rapid ocean warming in the eastern equatorial Pacific (table 1); this offset the elevated absorption of sunlight contributing about two thirds of the decline in seasonally adjusted N from above 2 Wm−2 in April 2023 to less than 0.5 Wm−2 in June 2024 (figure 1(a)). Earth’s net energy imbalance tends to decline once the warming from El Niño is fully realised and this heat is lost through ocean evaporation and eventual infrared heat loss to space (Allan et al 2014, Trenberth et al 2015, Cheng et al 2019, Loeb et al 2024); this effect was, however, less apparent in the strong 2016 warm event (figure 1(a)), when reduced stratocumulus cloud cover and increased ocean absorption of sunlight (Loeb et al 2020) appeared to counteract this cooling mechanism. The early 2024 minima in Earth’s net imbalance nevertheless remains elevated compared with similar minima following El Niño events in early 2016, 2010 and 1998 (figure 1(a)).
Table 1. Planetary heating components 2006–2020 from an observations-based inventory (von Schuckmann et al 2023) and for August 2022 to July 2023 combining the CERES observed top of atmosphere energy imbalance increase with the inventory estimate. For the August 2022 to July 2023 period (columns 3 and 4), the mean N is approximated by adding the CERES observed change in N between 2006 to 2020 and August 2022 to July 2023 (+1.09 Wm−2) to the climatological Total N obtained from the inventory method for 2006 to 2020 (column 2). In the proportional method (column 3) the atmosphere, land, cryosphere and ocean heating components are estimated by assuming that their proportion of the total during 2006 to 2020 remains the same in this later period (e.g. heating and melting of the cryosphere remains as 3.7% of the total). A further estimate (column 4) is made by using additional data to approximate atmosphere, land and cryosphere heating (see main text for details). These alternative estimates are subtracted from the mean N to approximate total ocean heating. Associated surface skin temperature trends (2006 to 2020) and changes (2023 minus 2022) for the global land and 60∘S–60∘N ice-free oceans are displayed in the bottom three rows (SST is assumed as ice in ERA5 and ice cover cells are set to −1.8
  in both datasets). Atmospheric heat accumulation from ERA5 (columns 2 and 4) and the CERES change in global time-mean net imbalance August 2022 to July 2023 minus 2006 to 2020 (column 3) are in parentheses.
| Heating (Wm−2) | 2006 to 2020 | 2022 to 2023 | 2022 to 2023 |
|---|---|---|---|
| Component | observed | proportional | estimated |
| Atmosphere | 0.014±0.003a (0.017) | 0.034 | 0.120 (0.146) |
| Land | 0.039±0.004a | 0.095 | 0.200 |
| Cryosphere | 0.028±0.008a | 0.068 | 0.040 |
| Ocean | 0.671±0.3a | 1.638 | 1.486 |
| Total N | 0.756±0.2a | 1.846 | 1.846 |
| CERES N | 0.834±0.18 | 1.924 (+1.09) | 1.924 |
| Temperature Trend | 2006 to 2020 | 2023–2022 | |
| or Change (∘C yr−1) | observed trend | observed change | |
| Land skin (ERA5) | +0.047 | +0.464 | |
| Ocean skin 60∘S–60∘N (ERA5) | +0.024 | +0.257 | |
| Ocean skin 60∘S–60∘N (CCI) | +0.025 | +0.273 | |
avon Schuckmann et al (2023)
The heat accumulation resulting from Earth’s net energy imbalance physically determines the total ocean warming. Annual ice-free ocean (60∘S–60∘N) surface warming from one calendar year to the next (δSST) based on ERA5 skin temperature displays a positive relationship with CERES mean net imbalance from August to July in the following calendar year, over the 2000-2023 period (figure 1(c)). The linear relationship implies 0.1  of additional warming per Wm−2 increase in N (±0.03
  per Wm−2 uncertainty based on the ordinary least squares fit standard deviation). This is a simplistic estimate since there is uncertainty in changes in N as well as δSST. An uncertainty in N changes of 0.1 Wm−2 is estimated from the root mean squared differences in the Aqua minus Terra satellite CERES instrument SSF1deg-Ed4.1 annual anomalies 2002–2020. An uncertainty in annual SST difference of 0.02
  is based on the root mean squared
  difference between ERA5 and the European Space Agency Climate Change Initiative (CCI) blended, daily, gap-filled satellite-based climate data record at ∼5 km resolution (Embury et al 2024). Applying a linear least-squares fit accounting for these estimated uncertainties in both N and
  increases the gradient of the linear fit to 0.17±0.02
  per Wm−2. Given that this relationship is used for illustrative purposes, we assume a gradient of 0.1
  per Wm−2 based on the simple fit applies as a rough estimate.
Annual mean N for July to June the following year or for August to July the following year displays the strongest correlation (r = 0.53) with the change in January to December SST from the first calendar year to the next (e.g. July 2015 to June 2016 N anomaly coincides with the mean 2016 minus 2015 SST change). This is robust to the choice of data and details of the method: a similar relationship is found using (1) the CCI satellite-based estimate or (2) using a 2 year period to calculate N (e.g. January 2022 to December 2023 mean N is related to 2023 minus 2022 annual mean ocean surface warming) with a linear fit, 0.11±0.04  per Wm−2, r = 0.49 (uncertainty is the standard deviation of the least squares fit). These diagnosed relationships are useful in interpreting how ocean warming is related to changes in the global energy balance, which itself is influenced by multiple factors that are now discussed.
The increases in global energy imbalance and surface warming are controlled by radiative forcing and climate responses (e.g., Andrews et al 2022). Global aerosol radiative forcing is known to have peaked (Quaas et al 2022, Hansen et al 2025) and to be in decline since 2000, increasing the direct instantaneous radiative forcing by ∼0.17 Wm−2/decade (Subba et al 2020) and leading to a 0.1–0.3 Wm−2/decade increase in effective radiative forcing, a metric that incorporates additional atmospheric adjustments including cloud characteristics (Hodnebrog et al 2024). Ship fuel regulations phasing in up to around 2020 are also expected to have amplified these changes, primarily through aerosol-cloud interactions (Diamond et al 2023, Jordan and Henry 2024, Quaglia and Visioni 2024, Yuan et al 2024). While increases in total instantaneous radiative forcing of 0.3–0.4 Wm−2/decade (2003–2018) are also dominated by greenhouse gas increases, including an accelerating rise in methane (Kramer et al 2021), the direct suppression in outgoing longwave radiation is nearly offset by increases in response to the warming resulting from the radiative forcing (Raghuraman et al 2021). Shortwave radiative fluxes are also influenced by greenhouse gas forcing through their indirect effect on atmospheric stability, SST patterns and cloud adjustments (Andrews et al 2022).
Additional minor influences on Earth’s energy budget stem from increases in the solar constant as part of the 11 year natural cycle (Hansen et al 2025, Loeb et al 2024), the Hunga Tonga undersea volcanic eruption that led to competing effects from increases in stratospheric water vapour (heating) and aerosol (cooling) (Millán et al 2022, Jenkins et al 2023, Schoeberl et al 2023, 2024, Stocker et al 2024) plus a slight cooling from increased wildfire emissions (Yu et al 2023). These multi-faceted influences of radiative forcings along with resultant climate responses contribute to the observed changes in Earth’s energy imbalance. The precise contributions to the increasing global net imbalance remains difficult to establish and so further analysis combining the observations and reanalysis datasets are conducted.
While the mean CERES net energy imbalance doubles from 0.6 Wm−2 in 2001–2014 to 1.2 Wm−2 in 2015–2023, ERA5’s N remains static at about 0.7 Wm−2 (figure 1(a)) as previously reported (Liu et al 2020). Since ERA5 is able to capture the observed monthly and interannual variability in Earth’s energy imbalance and also realistically simulates meteorological regimes including clouds due to its comprehensive application of data assimilation (Hersbach et al 2020), the divergence between CERES and ERA5 N after the 2010s potentially provides additional insight into the physical causes of the increasing net energy imbalance. The next section therefore combines the CERES and ERA5 data to investigates the spatial structure of energy budget changes to elucidate the likely causes.
The spatial signature of the observed increases in Earth’s net energy imbalance are quantified for regional and multiannual mean changes from 2000–2014 to 2015–2023 (figure 2(a)). Increases over many ocean regions are primarily explained by comparable enhancement of absorbed shortwave radiation (not shown), consistent with figure 1(d). The top of atmosphere net downward energy flux also increased over Europe, as captured by ERA5 (figure 1(b)), implying a continuation of a downward trend in cloud cover up to 2015, attributed in previous studies to circulation responses to declining aerosols (Dong et al 2022, Grosvenor and Carslaw 2023) and linked with strong warming (Philipona et al 2009). Increases  3 Wm−2 over the south east Atlantic and north east Pacific (the Namibian and Californian stratocumulus cloud deck regions respectively) have previously been linked with reduced cloud cover and brightness (Loeb et al 2020, Fernández and Georgiev 2023). Li et al (2024) attributed decreases in reflected shortwave radiation for 30–50∘N and 0–50∘S to aerosol and cloud cover changes. More positive net downward flux anomalies over the high latitude Southern Ocean are also explained by greater absorption of sunlight, symptomatic of reduced Antarctic sea ice cover since 2016 that reached record low levels in the satellite record in 2023 (Gilbert and Holmes 2024, Kuhlbrodt et al 2024).
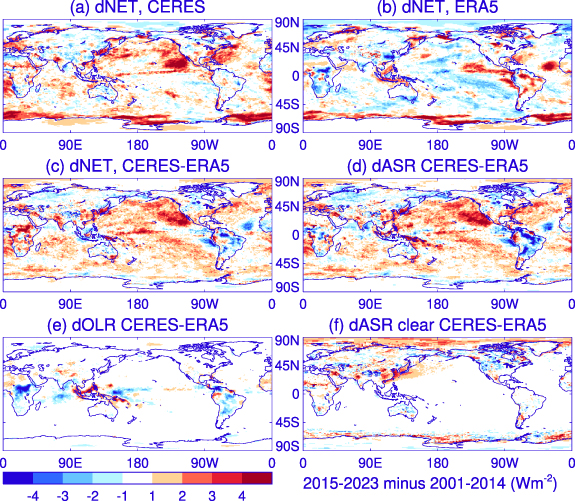
Figure 2. Global changes in top of atmosphere radiation budget 2015–2023 minus 2000–2014 for (a) CERES net downward flux (dNET), (b) ERA5 dNET and the divergence between CERES minus ERA5 differences in decadal changes in (c) dNET, (d) absorbed shortwave radiation (dASR), (e) outgoing longwave radiation (dOLR) and (f) clear-sky absorbed shortwave radiation (dASR clear).
Download figure:
Standard image High-resolution image
Many of the observed positive changes in net flux over the ocean are also present in the CERES minus ERA5 difference in the decadal changes (figure 2(c)), particularly over the Californian and Namibian stratocumulus regions but also the mid-Indian ocean. Although there have been improvements in cloud representation in ERA5, deficiencies exist in previous versions of the reanalysis (e.g. ERA40), including poorly simulated stratocumulus cloud radiative properties (Allan et al 2004). There are indications that ERA5 underestimates marine stratocumulus cloud cover (Eastman et al 2022) and deficiencies in the representation of low altitude cloud may explain why ERA5 is unable to realistically capture the observed cloud-related reduction in reflected sunlight over these regions. The evaluation of cloud cover represented by ERA5 in future studies is therefore merited.
Increased net heating over the Eastern Seaboard of North America and over Europe (figure 2(a)) are captured by ERA5 (figure 2(b)) so are not evident in the CERES-ERA5 difference (figure 2(c)) but positive differences over the tropical eastern Pacific (figures 2(c) and (d)) are explained by greater absorption of sunlight in ERA5 during 2000–2014 not seen in CERES. Large CERES-ERA5 differences in absorbed sunlight changes over the western Pacific (figure 2(d)) are also mirrored as opposite sign anomalies in outgoing longwave radiation (figure 2(e)) and are therefore likely to be linked to unrealistic geographical changes in deep convective cloud simulated by ERA5. Similarly, an increase in absorbed sunlight in ERA5 relative to CERES over equatorial Africa and South America (figure 2(d)), with opposite sign differences in outgoing longwave (figure 2(e)), indicates inaccurate changes in continental deep cloud cover in ERA5.
A decrease in top of atmosphere net downward flux over the Arctic in ERA5 (figure 2(b)) explains the positive CERES−ERA5 differences in net flux changes that are also seen in the all-sky and clear-sky absorbed sunlight differences (figures 2(d) and (f)), so likely related to inaccurate changes in Arctic ice coverage in ERA5, which is known to contain a warm bias here, particularly before 2014 (Tian et al 2024). Discrepancies of either sign over the high latitude Southern Ocean (figures 2(c), (d) and (f)) also reflect inaccuracies in the spatial structure of Antarctic sea ice changes in ERA5 with the large observed increase in net downward flux and absorbed sunlight over the Weddell and Ross Seas, relating to recent decline in sea ice coverage (Gilbert and Holmes 2024) that are underestimated by ERA5; previous studies have also highlighted a deficiency in representing Antarctic sea ice change by atmosphere-only climate model simulations that prescribe sea ice boundary conditions (Raghuraman et al 2021).
Decreases in CERES minus ERA5 net flux changes over Eurasia are evident for clear and cloudy sky absorbed sunlight (figures 2(c), (d) and (f)), suggesting inaccuracies in surface albedo, though aerosol could also play a role. Although water vapour increases over high northern latitudes and also increases clear-sky absorbed sunlight, these changes are strongly constrained by temperature, and previous analysis has shown broadly consistent latitudinal trends in integrated moisture for climate models, ERA5 and ocean observations since the 1980s (Allan et al 2022). It is noteworthy that CERES observes an increase in clear-sky absorbed sunlight relative to ERA5 over the eastern coastal regions of China (figure 2(f)) and this could indicate a larger reduction in aerosol emission in this region (Samset et al 2019) relative to the emissions assumed in ERA5, which are prescribed based on a climate change projection scenario (Hersbach et al 2020, Goessling et al 2024).
Strikingly, the larger, more widespread discrepancies in absorbed sunlight changes over the global oceans (figure 2(d)) are not present for clear-sky differences (figure 2(f)) indicating that the primary driver of the divergence in net flux between CERES and ERA5 relates to cloud cover and brightness, consistent with figure 1(b) and prior analysis (Loeb et al 2024). Recent analysis has identified a decline in global cloud cover in total and low cloud cover in observations and ERA5 that are concurrent with increased absorption of sunlight (Goessling et al 2024). While high altitude cloud induces counteracting shortwave and longwave effects on the net imbalance, low cloud changes most strongly influence reflected sunlight. Yet, it is not clear why ERA5 is unable to represent the decreases in reflected sunlight by marine cloud, nor whether these observed changes are being driven by (1) cloud responses to ocean warming and its geographical patterns, (2) the effects of aerosol changes on cloud cover and brightness, or (3) the effects of radiative forcings from greenhouse gases and aerosols on the thermal structure of the atmosphere and atmospheric circulation (Loeb et al 2020, Kramer et al 2021, Raghuraman et al 2021, Goessling et al 2024, Hodnebrog et al 2024, Jordan and Henry 2024). A further question is how the energy budget changes in the 2000s associated with these driving factors, contribute to the observed ocean warming that reached record levels in 2023 (Kuhlbrodt et al 2024).
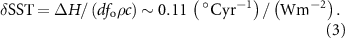
Global surface warming is strongly determined by the energy balance of the upper ocean layers (e.g. Allison et al 2020). During the period 2006–2020, a near-global (60∘S–60∘N) ice-free ocean surface warming of 0.25  /decade is associated with a global net energy imbalance of 0.83 Wm−2 in CERES data (table 1), close to the recent bottom-up in situ inventory estimate of 0.76 Wm−2 (von Schuckmann et al 2023). This net energy imbalance is partitioned between atmosphere, land, cryosphere and the ocean, which uptakes 89% of the total based on von Schuckmann et al (2023) (figures 3(a) and (b)). The magnitude of ocean surface warming for a given ocean heating rate, H =
  0.67 Wm−2 (where the ocean fractional uptake,
  = 0.89), can be used to gauge an effective ocean heat capacity, δSST/H = 0.025±0.001/0.67±0.3 = 0.037±0.017
  per Wm−2 (SST trend errors based on the difference between ERA5 and CCI, uncertainty in N from table 1). The inverse (26.8±12.0 Wm−2 per
  ) is nearly double a previous estimate of 14±5.9 Wm−2 per
  (Schwartz 2007), which related global surface warming (larger than ocean surface warming) to the upper 3000 m of ocean heating (slightly less than total ocean heating) over an earlier and longer 1956–2002 time period.
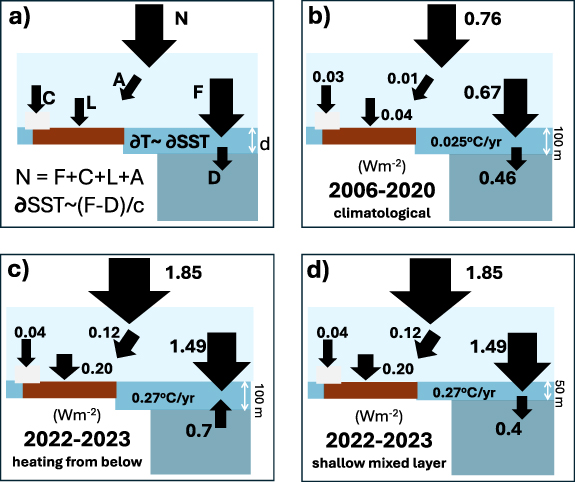
Figure 3. Schematic of Earth’s energy inventory (a) with net top of atmosphere net energy imbalance (N) partitioned between the atmosphere (A), cryosphere (C), Land (L) and heat flux into the ocean (F), some of which heats the upper effective mixed layer (depth, d) and the remainder heating deeper layers (D) with the upper mixed layer and sea surface temperature rise ( ) determined by the heat convergence,
  and heat capacity, c (equation (3)). (b) Climatological energy accumulation terms (W m−2) 2006–2020 (von Schuckmann et al 2023), SST trend and estimated D for d = 100 m and plausible, illustrative energy inventory consistent with the rapid ocean surface warming of 0.27
  from 2022 to 2023 assuming (c) a fixed effective mixed layer depth with heating from below or (d) a reduced effective mixed layer depth.
Download figure:
Standard image High-resolution image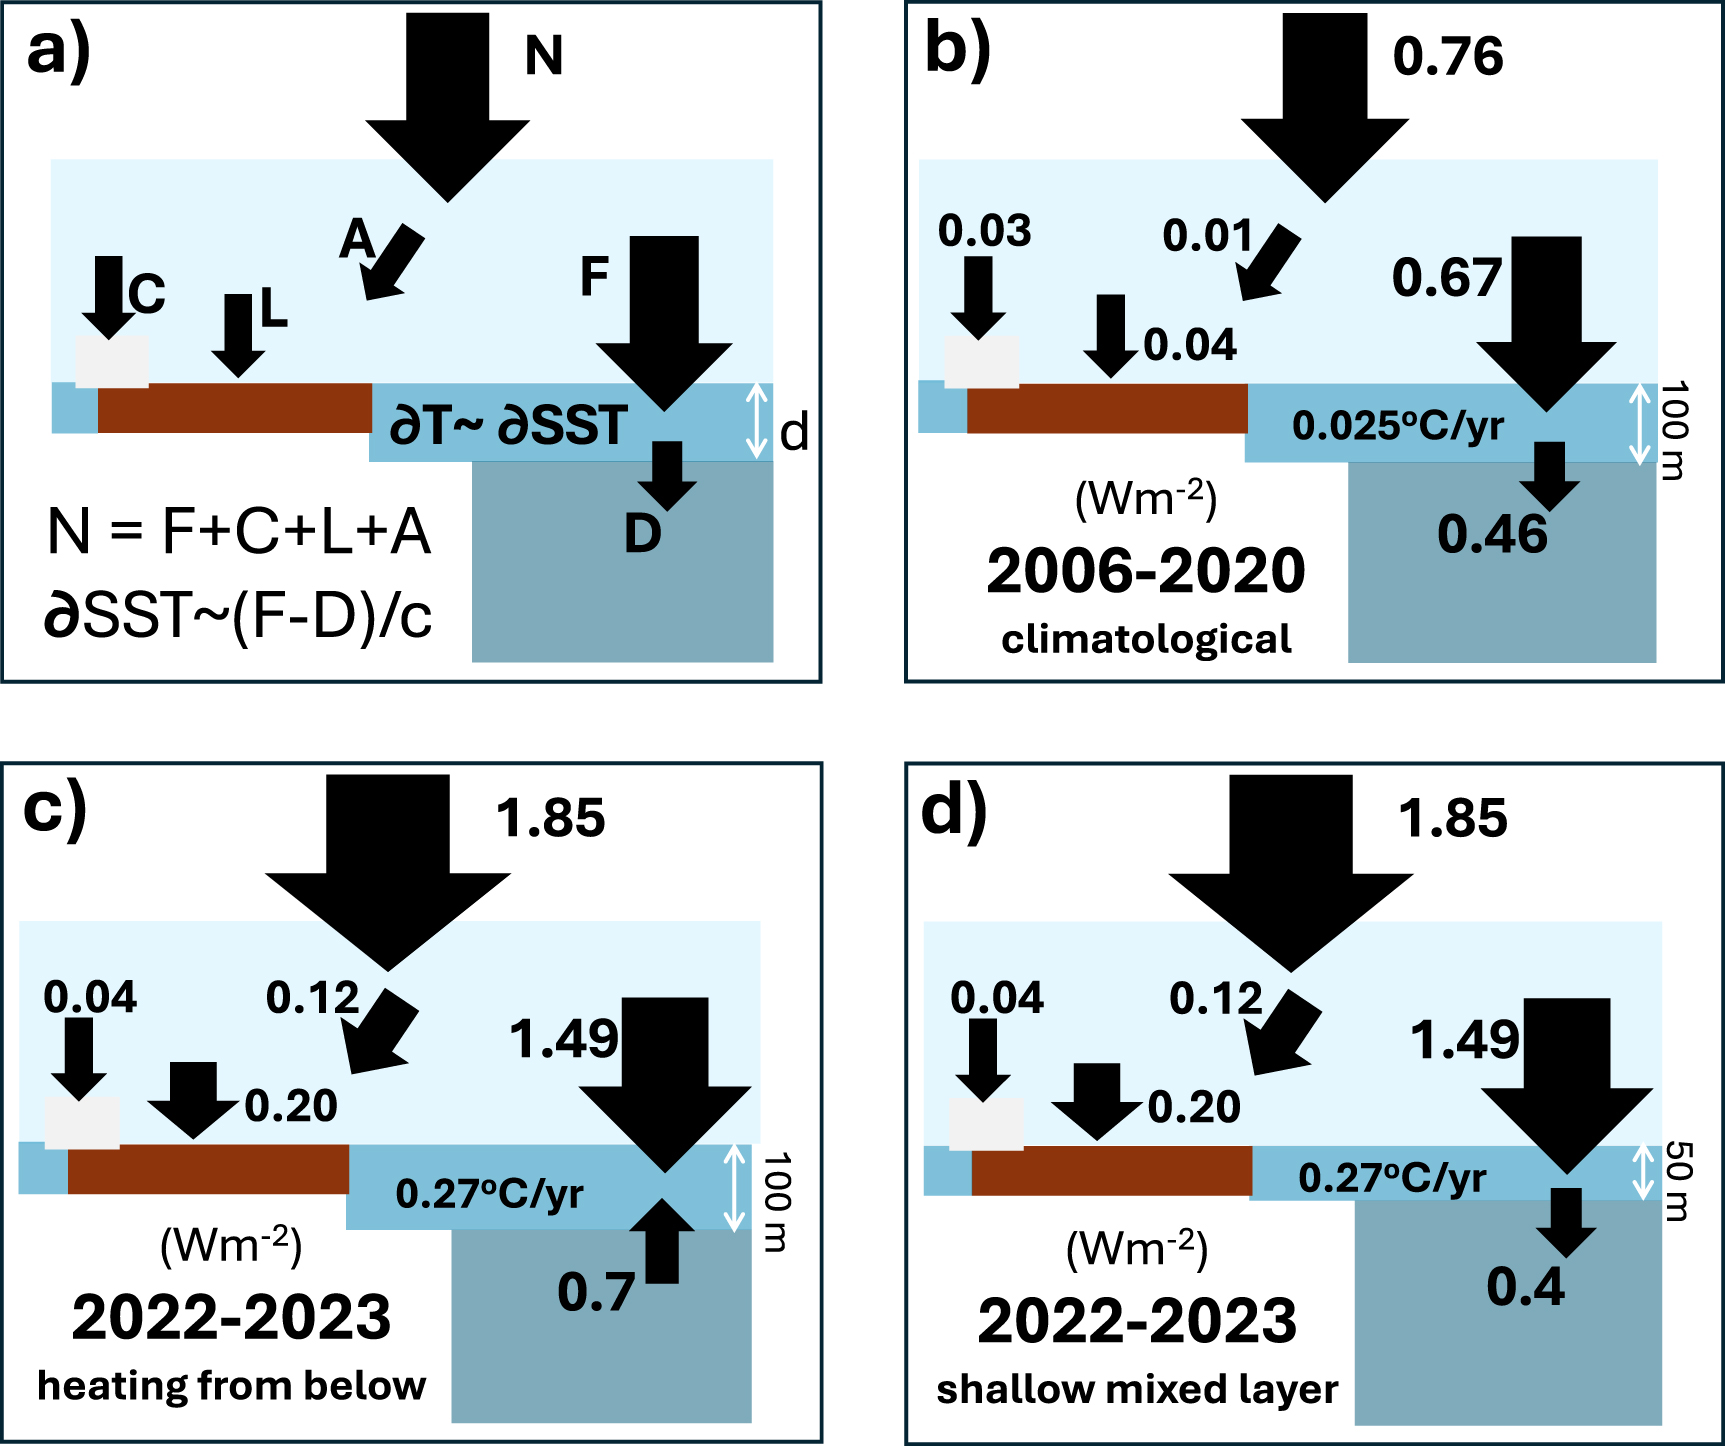
The ocean total heating, H = 0.67 Wm−2 (von Schuckmann et al 2023) is specified for the global surface area so when scaled by 60∘S–60∘N ocean area fraction of the globe ( = 0.63) this is equivalent to a uniform warming of 0.025
  (δSST, based on the CCI surface observations), spread across an effective depth (d) of ocean computed as:

where density, ρ = 1027 kg m−3 and specific heat capacity, c = 4003 Jkg−1K−1. This approximate effective depth of heating compares with an earlier estimate of 148 m (Schwartz 2007) though both estimates are subject to large uncertainties in ocean heating (table 1) and differences in the variables used to diagnose surface warming and ocean heating.
In reality, the ocean surface warming is most closely related to the ocean mixed layer, of depth 53 m as an annual 60∘S–60∘N average (as much as 67 m in August) based on an observational climatology (Johnson and Lyman 2022). Assuming additional vertical mixing over multi-annual timescales,  100 m is a reasonable upper ocean layer to consider since this displays coherence over multi-annual timescales based on global ocean reanalyses (Roberts et al 2017, Allison et al 2020). This is also justified by considering that the global annual mean extreme (95th percentile) mixed layer depth of 98 m (Johnson and Lyman 2022) may be more relevant to the mixing of heat over these time-scales.
Rearranging equation (1), the heating (per global surface area) of this 0–100 m layer can be estimated as:

Subtracting H from the total ocean heating in (von Schuckmann et al 2023) (table 1), this would imply an uptake of the remainder of the ocean heat input by deeper layers (D = 0.67−0.21 = 0.46 Wm−2) during 2006–2020 (illustrated in figure 3(b)). Comparably, over this period, the 0–300 m ocean layer absorbed 0.27 Wm−2 of heat with the remaining 0.41 Wm−2 heating deeper layers (von Schuckmann et al 2023). The extent to which ocean heating is distributed between the upper 100 m ocean and deeper layers has been implicated in explaining variations in global surface warming trends, which were suppressed during the early 2000s as a series of strong La Niña events coincided with a negative phase of the Pacific Decadal Oscillation (Kosaka and Xie 2013, Trenberth and Fasullo 2013, Allan 2017, Medhaug et al 2017) leading to enhanced heat uptake by deeper ocean layers at the expense of mixed layer heating, which is closely linked with ocean surface temperature (Allison et al 2020).
To understand the link between net energy imbalance changes and ocean heating, it is informative to consider how a rapid increase in Earth’s energy imbalance relative to slower ocean heat uptake processes operates. Assuming that uptake below the mixed layer remains approximately constant over decadal timescales ( 0.46 Wm−2, estimated from equation (1) and table 1), then a rapid increase in net energy imbalance ΔN = 1 Wm−2, will lead to an additional mixed layer ocean heating (ΔH =
  , where climatological
  = 0.89) and surface ocean warming,
This is similar to the linear fit between yearly ocean warming and global net energy imbalance changes derived from the observed interannual variability 2000–2023 (figure 1(c)). Although the observationally derived relationship is weak, with interannual changes in N explaining only 28% of the variance in  (figure 1(c)), this is nevertheless suggestive of physical consistency in the conceptual model described when applied to short-term variability. Over longer time-scales the uptake of heat by deeper ocean layers increases in response to a rising net imbalance: Merchant et al (2025) diagnose a 0.017 oC/yr increase in ocean surface warming rate per Wm–2 increase in N over 1985–2024. The main reason why this sensitivity of warming rates to changes in net imbalance is much lower than the diagnosed relationship for year to year changes is that over shorter time-scales, more of the increase in net imbalance is concentrated in the mixed layer whereas over longer time periods heating of the ocean beneath the mixed layer increases. This is different to the estimate of effective global ocean heat capacity by Schwartz (2007) since it is diagnosing how increases in N are related to an increase in the rate of ocean warming.
While more accurate calculations of the ocean energy balance and temperature changes are provided elsewhere (Minobe et al 2024), these basic calculations provide a simple framework for interpreting the changes in Earth’s energy balance and ocean heating (see also Gregory et al (2024)). There is, however, substantial uncertainty in the derived observed relationship between net imbalance and ocean surface warming rate, with substantial year to year fluctuations that do not adhere to this simple approximation. For example, changes in mixed layer depth have been shown to be important in modulating ocean warming in the Atlantic (Senapati et al 2024) while the geographical pattern of warming across contrasting ocean regions can influence the depth of ocean being heated (Kuhlbrodt et al 2024). Changes in heat flux between the ocean mixed layer and deeper levels also plays a role, particularly between La Niña and El Niño conditions (Minobe et al 2024). This is the case for the recent rapid ocean warming from 2022–2023, which is visible as the upper right symbol in figure 1(c) and shows a warming rate around 0.1 ∘C/yr greater than predicted by the linear relationship. Using the simple framework developed in this section, the 2022–2023 period is now investigated in more detail.
The period 2022 to 2023 experienced a rapid increase in ocean surface temperature (Kuhlbrodt et al 2024). This is estimated as 0.27  based on CCI SST, similar to ERA5 (table 1) and other estimates of the annual warming (Cheng et al 2024). The temperature rise in just 1 year was, remarkably, close to the warming per decade during 2006–2020 (table 1). Although internal climate variability was a strong contributor to the exceptional 2023 temperature evolution (Samset et al 2024), the rapid ocean surface warming cannot be wholly explained (less than 1% probability) by internal variability combined with steady greenhouse gas increases alone based on statistical analysis of climate model simulations (Rantanen and Laaksonen 2024).
This temperature evolution was associated with the highest annual net energy imbalance in the CERES satellite record, 1.92 Wm−2 from August 2022 to July 2023, 1.09 Wm−2 greater than the 2006–2020 mean (table 1). Since the CERES measurements provide good stability over time, the CERES increase in N is added to the most up to date climatological inventory estimate, N = 0.756 Wm−2 (von Schuckmann et al 2023) to provide the best estimate of global net imbalance for the August 2022 to July 2023 period (1.846 Wm−2, see table 1). Assuming that the oceans uptake the same proportion of the total net imbalance as during 2006 to 2020 (∼89%, table 1), this implies a net ocean heating of ∼1.64 Wm−2, nearly 1 Wm−2 greater than the 2006–2020 period (table 1). This is at the upper range of observed 0–2000 m increase in ocean heat between 2022 and 2023 of 4 to 25 ZJ (a ZJ or zettajoule is 1021 J), equivalent to 0.25−1.55 Wm−2 of annual heating, based on the total ranges (9±5 and 15±10 ZJ) from two estimates that apply differing approaches and observations (Cheng et al 2024) and assuming a climatological deep ocean (below 2000 m) heating rate of 0.06±0.03 Wm−2 (von Schuckmann et al 2023) or 0.068±0.016 Wm−2 (Johnson and Purkey 2024). Based on the energy balance relationship derived in section 4 and from observations (figure 1(c)) an increase in N of about 1 Wm−2 would imply an ocean warming of 0.1  yr−1 on top of the climatological warming rate of 0.025
  . This ∼0.12
  yr−1 warming from 2022 to 2023 is around half the observed warming, implying additional mechanisms are operating as also suggested from the fact that the observed relationship between changes in N and
  is weak (figure 1(c)). Alternatively, the ocean heating ∼1.64 Wm−2 minus climatological heat flux below the mixed layer of 0.46 Wm−2 can be applied to Eq(3), assuming a 100 m mixed layer to estimate a similar warming:
  ) multiplied by seconds per year = 0.14
  .
.
It is plausible that the partitioning of the top of atmosphere net energy imbalance between Earth system components also differed from climatology. Based on the ERA5 Vertically Integrated total energy diagnostic (Hersbach et al 2020) the atmospheric heating rate was 8.6× greater in 2022–2023 than 2006–2020; applying this factor to the inventory estimate results in a much larger proportional uptake of the total by the atmosphere in 2022/23 ( 6%) relative to 2006–2020 (1%). Additionally, the land surface skin temperature change for 2023 minus 2022 was about 10× the 2006–2020 climatology. Crudely assuming a shallower heating of the ground associated with this rapid warming, a factor of 5× is conservatively applied to the 2006–2020 heating rate to estimate a 2022–2023 land surface heat uptake of 0.2 Wm−2, around double the estimate assuming proportional heating; this is 11% of the total, around double the climatological proportion in the inventory estimate (von Schuckmann et al 2023). ERA5 global land net surface heat flux is computed to be only 0.04 Wm−2 higher in August 2022 to July 2023 compared with 2006–2020, though the realism of surface heat fluxes from reanalyses is questionable (Wild and Bosilovich 2024). Adding this additional land heating to the inventory estimate (von Schuckmann et al 2023), this suggests a heating of just 0.08 Wm−2, consistent with the proportional method but less than the estimated magnitude in column 4 of table 1. Although these are crude estimates, since land heating is a small component of the total net imbalance, an uncertainty range of ∼0.1 Wm−2 based on the two estimates in table 1 will not greatly affect the implications for reconciling ocean heating and warming (see Conclusions).
Heat used in melting ice is also likely to differ in 2022–23. Estimates of ice sheet changes, based on Gravity Recovery and Climate Experiment (GRACE) data (Watkins et al 2015, Wiese et al 2022) from 2022 to 2023 (ice loss of −105 Gt: −170 Gt Greenland, +65 Gt Antarctica) are in combination about a quarter of the rate of ice loss during 2006–2020 (−446 Gt: −279 Gt Greenland; −167 Gt Antarctica). Arctic sea ice mass changes estimated from the Pan-Arctic Ice Ocean Modeling and Assimilation System (PIOMAS) system (Schweiger et al 2011), that combines observations and simulations, is −168 Gt, similar to the 2006-2020 rate (−200 Gt/yr assuming an ice density of 900  ). Antarctic winter sea ice was
  km2 below the 1981–2010 climatology (Gilbert and Holmes 2024, Kuhlbrodt et al 2024) while annual sea ice extent was ∼1
 km2 less in 2023 than 2022 (nsidc.org/arcticseaicenews) equating to ∼900 Gt loss (assuming a mean ice thickness of 1 m) compared to little loss during 2006-2020. Therefore, an estimated overall additional loss of 600 Gt from 2022 to 2023 compared to 2006–2020 (an extra 900 Gt from Antarctic sea ice less 300 Gt reduced loss from ice sheets) equivalent to an additional 0.012 Wm−2 heating for ice melt (6
 of additional melt multiplied by the latent heat of fusion of water, 3.34
 , divided by the global surface area of 5.1
 and number of seconds per year but not including heat used warming the ice which is small in comparison). This was added to the 2006–2020 inventory estimate to give 0.028+0.012 = 0.04 Wm−2, around 2% of the total, less than the climatological inventory estimate (von Schuckmann et al 2023).
Combining the estimated heating of the atmosphere, land, cryosphere and total, the ocean heating rate was computed by subtraction (N minus the atmosphere, land and cryosphere heating terms in column 4 of table 1) as ∼1.49 Wm−2, only 80% of the total net imbalance and substantially smaller than the climatological proportion (von Schuckmann et al 2023). The estimates for 2022–2023 heating are approximate and so only serve as a rough lower bound on ocean heating compared to the climatologically proportional estimate (table 1). Uncertainty in the 2022-2023 atmosphere (±0.09 Wm−2), land (±0.1 Wm−2) and cryosphere (±0.03 ) components are based on the difference between the proportional and estimated columns of table 1 while the total N is assumed to be the 2006–2020 uncertainty (±0.2 Wm−2) plus a stability uncertainty of 0.1 Wm−2 based on multiple CERES measurements so ±0.3 Wm−2. Combining these estimated uncertainties in quadrature gives an ocean heating uncertainty of ±0.33 Wm−2. Applying the lower estimated 2022 to 2023 ocean heating of 1.49±0.33 Wm−2 (table 1) to equation (3), assuming a climatological heat flux below the mixed layer of
 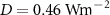 , explains less of the observed warming (
 ) multiplied by seconds per year ∼0.13
  ), only slightly less than the proportional heating method and half the observed warming. This suggests that the precise assumptions regarding heating of the minor components of the Earth system do not alter the conclusion that the simple energy balance model assuming fixed depth or heat flux below the mixed layer is unable to explain the ocean warming from 2022 to 2023.
These approximate calculations suggest that either the heat flux to deeper layers (D) was reduced (or reversed) in 2022–2023, the mixed layer depth (d) was shallower (meaning heat was distributed over a smaller volume of water), or both. An extended La Niña 2020–2022 (Li et al 2022, Wang et al 2023, Min 2024) temporarily suppressed warming rates while net energy imbalance remained high (figure 1(a)), implying enhanced heat uptake to deeper ocean layers. Upward mixing of anomalous warm water during the transition to El Niño conditions in 2023 are therefore likely to have reduced the net downward heat flux below the mixed layer or even reversed its direction leading to upward heating from below 100 m depth. Applying the observed warming rate to equation (2) and assuming this applies to a deep effective mixed layer of 0–100 m implies heating,  2.2 Wm−2 (100×0.63×0.27×1027×4003 times seconds per year), suggesting a change in sign of D such that an upward heat flux of ∼0.7 Wm−2 combines with the estimated heating from above of 1.49 Wm−2 (illustrated in figure 3(d)). This is consistent with a more comprehensive calculation of heating changes in the year leading up to the peak in El Niño (Minobe et al 2024). If a shallower climatological mixed layer of about 50 m is used (Johnson and Lyman 2022), the warming applies to half the water volume so
  1.1 Wm−2 and
  (illustration in figure 3(c). Alternatively, assuming climatologically fixed heat uptake by deeper layers (
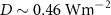 ) and applying the CCI observed
  = 0.27
  , the mixed layer depth to balance the heat budget becomes,
 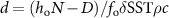 = 53 m, very close to the climatological mixed layer ocean depth (so assuming no deeper mixing as would normally be the case when accounting for the regional and seasonal extremes of mixed layer depth). Changes in ocean mixed layer depth have been identified as an important mechanism for sub-tropical SST changes in the North Atlantic (Senapati et al 2024) and merits future consideration in the wider influence on sea surface warming from year to year.
Thus, based on simple calculations, the ocean surface warming from 2022 to 2023 can be accounted for either if (1) all of the net ocean surface heating minus a climatological deeper ocean heat uptake warmed an unusually shallow upper ∼50 m ocean layer, or (2) the large increase in the net energy imbalance combined with an upward heating from greater depths leading to a rapid warming of the upper 100 m ocean. In practice, there is likely to be a combination of reduced heat flux to deeper ocean levels, or a temporary reversal of this heat flux, as well as a shallower than normal mixed layer subject to the heating. The transition from La Niña to El Niño is associated with substantial vertical movement of positive sub-surface heat anomalies to the surface of the east Pacific (Kosaka and Xie 2013, Minobe et al 2024), and so the changes or even reversal of the heat flux between the upper mixed layer and deeper levels are expected to be more important in determining global mean SST changes than alteration in global-average mixed layer depth which tends to dominate in more localised regions (Roberts et al 2017, Senapati et al 2024). Altered ocean mixed layer characteristics including heat exchanges with deeper layers are therefore required in addition to an increased global net energy imbalance, linked to greater absorbed sunlight over the cloudy ocean, to explain the substantial annual ocean warming from 2022 to 2023. A more rigorous and regionally resolved quantification based on observations and modelling is required to confirm these simple estimates and to elucidate the mechanisms involved in altering Earth’s energy imbalance, the implications of which should also be considered on longer timescales (Merchant et al 2025).
We find a growth in the Earth’s rate of heating, from 0.6±0.2 Wm−2 in 2001–2014 to 1.2±0.2 Wm−2 in 2015–2023, is dominated by increases in absorbed sunlight over the ocean and is associated with cloud effects. This increasing energy imbalance is coincident with a divergence in the amount of sunlight absorbed by the planet between CERES satellite observations and the ERA5 reanalysis after 2014. Spatial differences between ERA5 and the satellite data have allowed us to attribute the growing imbalance to increases in absorbed sunlight over most ocean regions, with the largest changes over the Californian and Namibian stratocumulus cloud decks. These new results extend our understanding of how the growth in Earth’s energy imbalance has manifested regionally and are dominated by the cloudy ocean. The observed heating is further reconciled with rising global temperatures, up to the record levels experienced in 2023 (Blunden and Boyer 2024, Kuhlbrodt et al 2024).
Although previous studies have identified subtropical low and mid-altitude cloud as important in determining decreases in reflected sunlight since around 2014 (Loeb et al 2024), the drivers of these changes remain unclear (Goessling et al 2024). The link with SST pattern changes, based on combining atmosphere-only climate models with satellite data, implies that cloud feedbacks in response to subtropical Pacific warming plays a role, particularly over the Californian stratocumulus regimes (Loeb et al 2020). However, the prevalence of the signal over much of the global oceans and particularly the north Pacific but with contrasting changes over land, identified in the present study, may suggest other mechanisms such as aerosols also play a role.
Reducing global aerosol emissions and radiative forcing since 2000 (Quaas et al 2022) have been identified as an important driver of Earth’s net energy imbalance increases, though climate model simulations underestimate the magnitude of the observed trend (Hodnebrog et al 2024). The widespread nature of the discrepancy between CERES and ERA5 reflected sunlight could plausibly indicate that declining aerosols are contributing to the larger increases in absorbed sunlight in the observations. Assuming declining aerosol pollution is driving the increase in absorbed sunlight, our analysis suggests cloud-aerosol interaction over the ocean rather than direct effects dominate this signal. This is partly supported by modelling evidence suggesting that aerosol direct reflection of sunlight has continued to increase over recent decades while the aerosol effects on cloud reflection have diminished along with emissions (Hermant et al 2024). While recent analysis suggests a decline in global cloud cover in ERA5, the reanalysis appears unable to capture the low cloud radiative effects critical in explaining the rising net energy imbalance (Goessling et al 2024).
It is further shown that while ERA5 can accurately represent changes in clear-sky absorbed sunlight over most of the oceans, this is not the case over eastern China where recent reductions in aerosol emissions (Samset et al 2019), faster than assumed in ERA5, can explain greater satellite observed absorption of sunlight for clear-sky scenes in 2015–2023 relative to 2000–2014. Previous work found aerosol emissions can strongly influence North Pacific SST through Rossby wave atmospheric circulation responses, though the simulated magnitude of these dynamical and aerosol-cloud effects are uncertain and probably underestimated (Dittus et al 2021). Reduced aerosol emission from China (Samset et al 2019, Raghuraman et al 2021), along with smaller global effects from reduced sulphur emissions following ship fuel regulations in 2020 and earlier (Hansen et al 2025, Goessling et al 2024, Quaglia and Visioni 2024, Yuan et al 2024), could plausibly reduce cloud brightness and cloud fraction over the North Pacific and more widely, though it is difficult to explain the magnitude of the increase in Earth’s energy budget from aerosol direct and indirect influences alone. Observational evidence based on the sensitivity of cloud characteristics to a volcanic aerosol plume in the subtropical North Pacific suggests that climate models may underestimate the effects of aerosols on cloud fraction (Chen et al 2024) and so the influence of aerosol reduction on cloud-mediated changes in Earth’s energy budget remains a substantial uncertainty in the magnitude of future climate change (Schwartz 2007, Arias et al 2021). In addition to aerosol effects on cloud, circulation and radiation, additional cloud responses to evolving SST patterns (Loeb et al 2020, Andrews et al 2022) are in all likelihood also required to explain the magnitude increases in Earth’s net energy imbalance.
A further goal of the present study was to reconcile the identified increases and variations in Earth’s energy imbalance with ocean surface warming. We illustrate this using a simple energy budget framework: assuming an effective upper 100 m mixed layer ocean slab warms at the same rate as the surface during 2006–2020 (0.25  ), it will absorb ∼0.21 Wm−2 of the 0.67 Wm−2 observed ocean heating rate (von Schuckmann et al 2023) with the 0.46 Wm−2 remainder heating deeper ocean layers. Ocean surface temperature is therefore determined by the subtle interplay between heat fluxes into the ocean surface and beneath the mixed layer (Allan 2017, Hedemann et al 2017). We identify a 1 Wm−2 short-term (interannual) increase in Earth’s net energy imbalance is weakly associated with an additional 0.1±0.03
  increase in near-global SST based on observed interannual variability since 2000. Applying the simple energy budget approach, this relationship can be understood by assuming that for a rapid 1 Wm−2 increase in Earth’s energy imbalance, ∼90% heats the upper 100 m ocean layer, elevating the warming rate by ∼0.1
 with no change in the heat flux to deeper layers. This does not apply over longer time frames, as heat uptake by deeper ocean layers increases and an estimate of 0.017
  per Wm−2 increase in net imbalance was diagnosed over decadal time-scales by Merchant et al (2025).
This energy balance framework along with estimates of net imbalance changes and heat uptake by the land, atmosphere and cryosphere are further exploited to reconcile the rapid warming from 2022 to 2023 with energy budget changes. Based on observational evidence and assumptions, we determine an ocean heating of ∼1.49±0.33 Wm−2 during the rapid warming period, August 2022 to July 2023. A large observed near-global ice-free ocean surface warming of 0.27  from 2022 to 2023 is found to be physically consistent with the large energy imbalance of 1.85±0.3 Wm−2 and subsequent ocean heating from August 2022 to July 2023 but only if (1) a reduced depth of mixed layer (∼50 m) is heated or (2) there is a reversal in the sign of the heat flux from the mixed layer to deeper levels. The latter explanation (2) appears more likely given that a substantial upwelling of heat from the sub-surface eastern Pacific is generally associated with the transition from La Niña to El Niño conditions (Minobe et al 2024). The elevated ocean temperatures during 2023-24 are also expected to substantially alter and increase surface heat loss through turbulent fluxes at the ocean surface, which merits further investigation. Although Earth’s energy budget peaked in 2023 and subsided up to June 2024, as record warmth ultimately led to extra thermal emission into space, it is notable that levels remained elevated relative to comparable minima following El Niño events in early 2016, 2010 and 1998.
Although there is considerable uncertainty in the approximated land, atmosphere and cryosphere heating components, since these combine to make up only ∼10% of the total Earth heating, they contribute only marginally to the uncertainty in the indirectly estimated ocean heating (total Earth heating minus atmosphere, land and cryosphere) during August 2022 to July 2023. This uncertainty is dominated by the climatological net imbalance uncertainty that is primarily related to 0–2000 m ocean temperature data (Wong et al 2020, von Schuckmann et al 2023) but also an additional stability uncertainty determined by comparing trends from multiple CERES satellite measurements (∼0.1 Wm−2/decade). The resulting ±0.33 Wm−2 ocean heating uncertainty is 22% of its magnitude (1.49 Wm−2) and so does not affect the conclusion that a reversal in the direction of heat flux beneath the mixed layer is required in addition to the large global net imbalance to explain the rapid warming from 2022 to 2023.
A more comprehensive, regionally resolved quantification based on observations and modelling is required to reconcile the simple estimates of ocean heating with observed warmingfor example, by exploiting observation-based surface flux products (Liu et al 2020) along with ocean observations and reanalyses (Minobe et al 2024). Additionally, in understanding recent increases in Earth’s energy imbalance and ocean warming, multiple drivers remain possible and indeed may be acting in conjunction, as was the case for the cause of the slower than expected global surface warming in the early 2000s (Medhaug et al 2017). Future work is needed to understand (1) the relative roles of aerosol microphysical effects on cloud cover and brightness, (2) the influence of regional changes in greenhouse gas and aerosol radiative forcing via their local and remote influence on atmospheric circulation, and (3) cloud feedback responses to SST changes and their geographical patterns (Loeb et al 2020, Dittus et al 2021, Chen et al 2024). The new evidence and methodology presented could be extended to provide ongoing diagnostics of the effective ocean heat capacity and effective ocean depth of heating to add further insight into transient climate change and the sensitivity of Earth’s climate to ongoing changes in greenhouse gas and aerosol radiative forcing (Schwartz 2007). Continuity of global Earth observing systems, including the radiation budget record, remains critical for maintaining this monitoring capability and capacity to accurately predict near term climate change.
The contribution of three reviewers and the editors are greatly appreciated. This work was funded by the National Centre for Earth Observation Grants NE/RO16518/1, NE/Y006216/1 and the Earth Observation Climate Information Service NE/X019071/1. ERA5 data was extracted from https://cds.climate.copernicus.eu/; CERES observations (EBAF Ed4.2: https://doi.org/10.5067/TERRA-AQUA-NOAA20/CERES/EBAF-TOA_L3B004.2) were extracted from the NASA Langley DAAC ceres-tool.larc.nasa.gov with geodetic weights from ceres.larc.nasa.gov/documents/GZWdata/zone_weights_lou.txt; CCI SST is available from climate.esa.int/en/data/ or with extraction tools from surftemp.net; version 5 DEEP-C data from https://doi.org/10.17864/1947.000347 were used; GRACE data is from podaac.jpl.nasa.gov/dataset/TELLUS_GRAC-GRFO_MASCON_CRI_GRID_RL06.1_V3 and PIOMAS data from psc.apl.washington.edu/research/projects/arctic-sea-icevolume-anomaly/data/; GOSML ocean mixed layer climatology data was extracted from www.pmel.noaa.gov/gosml; processing and plotting was conducted using IDL including Met Office software developed and maintained by Jonathan Gregory.
All data that support the findings of this study are included within the article (and any supplementary files).