Historically, the introduction of daylight saving time (DST), was motivated by the potential of saving energy required by artificial lighting needs during working hours and has been adopted by over 1.6 billion people worldwide (Kotchen and Grant 2011). DST is however highly disputed as, for example, the ongoing discussion on its abolishment within the European Union shows (European Parliament 2021). Hourly time shifts are known to have impacts on many aspects including crime (Doleac and Sanders 2015), car accidents (Fritz et al 2020), health (Jin and Ziebarth 2020), wildfires (Kountouris 2020) or performance of students (Herber et al 2017). Besides these wide-ranging effects, the study of effects of DST on energy demand is important, as approximately 27% of all energy-related global CO2 emissions come from buildings (International Energy Agency 2022) and rapid energy demand reductions are required to mitigate climate change (IPCC 2021). Therefore, careful policy evaluation of measures that impact energy demand in buildings is necessary. As climatic conditions drive energy demand in buildings, climate change effects must be included in these evaluations to assess the current and future impact on energy demand reduction in buildings.
Buildings’ heating and cooling demand is driven by factors such as their geometry, construction properties, weather conditions or occupancy patterns. With climate change, the increase in mean temperature and the frequency and intensity of heat waves is expected to affect the cooling demand of buildings (Zhang et al 2022). In many places, this increase in cooling demand is not expected to be fully offset by a reduction in heating energy use (Boyce et al 2022). Considering climate change is however decisive, as a substantial future uptake of active cooling devices (including in temperate climates) and consequent increase in energy demand are anticipated worldwide. Air conditioning is typically present in office buildings, which have higher cooling requirements compared to residential buildings as they are generally built with larger glazing areas and have normally higher internal gains from occupants and equipment use. Different solutions have been proposed to reduce cooling needs in buildings in a sustainable way, employing for example passive cooling methods or efficient district cooling (Orehounig et al 2014, Silva et al 2022). Another common adaptation measure in many countries is changing the working routines to adapt to climatic factors, e.g. by interrupting work in the heat of the day. Shifting working hours was proposed as an effective adaptation measure to climate change, due to the potential positive effects on occupational health and heat exposure. Takakura et al (2018) propose to shift the start of the working day to earlier hours in the morning to reduce the impact of labor capacity reduction of workers due to exposure to heat stress. Or Hendel et al (2017) propose delaying bedtime. Concerning the energy demand of buildings, findings on electricity savings due to reduced lighting demand are controversial and typically overall discussed savings are well below 1% of the total electricity demand (Aries and Newsham 2008, Hill et al 2010, Mirza and Bergland 2011, Küfeoğlu et al 2021). Whereas the effect of DST on lighting energy consumption is relatively well studied, an encompassing study on its impact on buildings’ heating and cooling demand is generally lacking. The effect of DST on heating and cooling is however decisive, as typically these demands significantly exceed the lighting energy consumption. Only a few studies assessed the impact of DST on the heating and cooling demand of buildings, but they focus on the residential sector and reveal that its impact on the thermal demand of buildings remains unclear (Awad Momani et al 2009, Kotchen and Grant 2011, Krarti and Hajiah 2011, Ahuja and SenGupta 2012, Rakha et al 2018). An initial similar analysis was conducted in Rakha et al (2018), where the authors considered the electrical consumption (and not the thermal energy demand) and therefore captured the effect of a defined energy conversion technology. As a result, no clear trend was identified, and no explanation of the processes from a building physics point of view was provided. Therefore, we perform here an analysis where we focus on the thermal energy demand of buildings to separate the potential impact of using different technologies to provide heating or cooling.
1.1. Scope and unique contribution
A systematic analysis showing the impact of DST on buildings’ cooling and heating demand, particularly considering climate change, is currently missing. To explore this shortcoming, this work assesses the impact of DST on archetype office buildings (small and large offices) located across the United States. The focus on office buildings is motivated by the generally higher cooling need of offices and as demand in offices is more dictated by working hour patterns. Given the considerable impact of office cooling demand on total building CO2 emissions, and the projected increase in conditioned floorspace (Boyce et al 2022), finding ways to reduce office cooling demand is decisive. The hypothesis is explored whether changing daily working hour routines can lead to significant changes to heating and cooling loads of office buildings (see section 2.1). The results from testing this hypothesis could change the perception of how DST affects the energy consumption of buildings. To this end, the impact of DST on space heating and cooling demand of office buildings is systematically assessed. The results are interpreted from a building physics point of view, and DST effects are simulated under present and future climate conditions.
2.1. Introducing a hypothesis to explain impacts of DST on heating and cooling needs of office buildings
Shifting working hour patterns with help of DST allows taking advantage of the sunlight in the early mornings and reducing lighting energy consumption in the evening. Analogously, the hypothesis is here put forward that starting work one hour earlier could take advantage of cooler morning temperatures and enable to reduce cooling energy demand of office spaces in the afternoon when the ambient temperature is higher and the building cooling demand is typically at its peak. Figure 1 depicts conceptually how cooling and heating demand can be affected by the introduction of DST, assuming idealized energy demand profiles in locations that require both heating and cooling to maintain indoor thermal comfort in office spaces. Typical heating and cooling profiles depend on the latitude (Bergland and Mirza 2017) and geographic location of the building, as some areas experience mild temperatures, not requiring heating over the year, while other regions are strongly dominated by cooling demand. The idealized cooling and heating energy demand profile is therefore expected to differ across the United States, even though most places will require both cooling and heating over the course of a year. However, in the case e.g. of more constant temperature or if cooling is required at most times (e.g. in more tropical climates), this idealized representation does not hold. In places requiring both cooling and heating, DST is expected to reduce the building cooling demand during the afternoon peak hour (indicated area a, figure 1). The reduction in cooling demand in the afternoon is also expected to be larger than additional cooling required in the morning (area d, figure 1). Similarly, the overall heating demand is expected to increase, as this is typically lower in the afternoon than in the morning (area b and c respectively, figure 1)). To assess the impact on the overall energy demand, a combined consideration of cooling and heating is necessary. However, as cooling and heating can be provided by different building heating ventilation and air conditioning (HVAC) systems, use of different primary energy sources, and the sustainability of these sources could vary at hourly to seasonal time scales (e.g. CO2 intensity of electricity), the assessment of which demand should be reduced is non-trivial (Goldstein et al 2020).
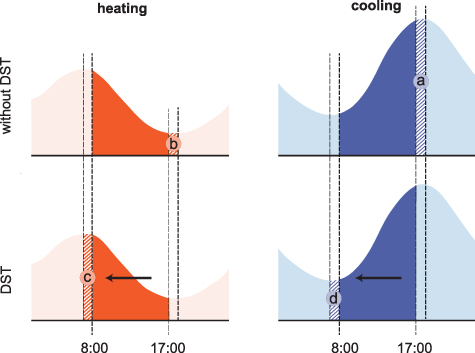
Figure 1. Conceptual representation showing the shift in working hours ahead by one hour with introducing daylight saving time (DST), compared to standard time (without DST) for a typical heating and cooling energy demand profile. Visualized idealized heating and cooling demand of a building, showing both working hour patterns. The portions of cooling or heating demand only required in one of the two modes (DST or without DST) are indicated with the areas labelled ‘a–d’.
Download figure:
Standard image High-resolution image
Several important conceptual assumptions need to be introduced to achieve these outlined changes in heating and cooling demand. Idealized fixed working schedules need to be assumed to guarantee that the same comfort requirements are to be maintained only inside a defined time window, and these temperature constraints can be relaxed outside the defined office hours.
2.2. Testing the hypothesis of how DST affects office buildings’ thermal energy demand under current and future climate conditions
To test the presented conceptual model for varying buildings’ thermal energy demand by introducing DST, the energy performance of two archetype office buildings (i.e. a small and a large office) developed by the Office of Energy Efficiency and Renewable Energy (Deru et al 2011, EERE 2022), is simulated across 15 cities (see figure 2) in different climate zones in the United States, using the building performance simulation tool EnergyPlus (Crawley et al 2001). EnergyPlus is commonly used in urban building energy modelling to model heating, cooling, ventilation, lighting or water use in buildings and was first released in 2001 (Casini 2022). The building models are simulated in detail, and the thermal energy delivery to the building is extracted from the output data. The technologies providing this thermal energy and the primary energy consumption are not considered in this study, as the principles described in figure 1 used to test the proposed hypothesis relate to the building envelope and thermal energy to maintain thermal comfort in the conditioned spaces. These archetypal reference office building models were simulated using the default building occupancy, internal gains and HVAC schedules and setpoints built in these archetypes, which are the same for all 15 locations. An example of the input parameters used in these archetypes is presented in figure S2. The model input files were only adapted to account for the inclusion or removal of DST. For each location, two sets of simulations were undertaken to employ current (typical meteorological year 2020) and future climate data for the year 2050 according to the representative concentration pathway (RCP) scenarios. Climate data were obtained from Meteonorm (Remund et al 2020). The considered RCP scenarios take into account the increase of solar radiation in W m−2 as a consequence of global greenhouse gas emission accumulation in the atmosphere (IPCC 2014). The simulation results of the RCP 4.5 scenario are discussed in more detail, representing a future hotter climate within a stabilization scenario (van Vuuren et al 2011). Simulations for the RCP 2.6 and RCP 8.5 scenarios allowed testing the impact of this policy implementation across different potential climate scenarios (see detailed results in the supplementary material).
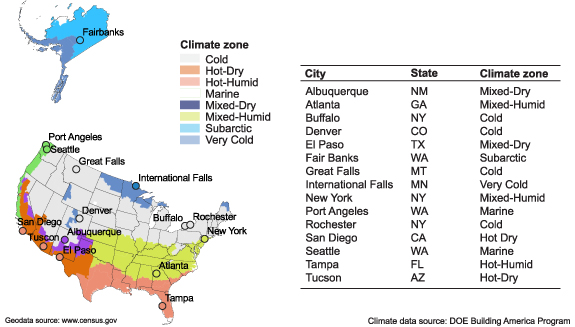
Figure 2. Overview of the simulated locations and climate zones.
Download figure:
Standard image High-resolution image
2.3. Energy simulation
The software EnergyPlus (energyplus.net) was used for simulating the buildings’ heating and cooling thermal energy demands. The archetypal building models developed by the Office of Energy Efficiency and Renewable Energy (EERE 2022) are provided as EnergyPlus model input files, which are modified to simulate the behavior of the building archetypes and their heating and cooling demand with and without daylight saving time, through the object ‘RunPeriodControl:DaylightSavingTime’ in the input file of the simulation. The building energy demand was calculated for a full year in hourly time steps. The modelling steps for simulating buildings across different cities and climate zones with EnergyPlus were automated by scripts. For the large office archetype, the thermal demand of the building was extracted at the equipment level (e.g. from the ‘Chiller Evaporator Cooling Rate’ and ‘Boiler Heating Rate’ result variables, summing all the contributions). For the small office archetype, the thermal energy was quantified at the delivery of the thermal energy, summing the contribution of all the heating and cooling coils of the HVAC system (e.g. from the variables ‘Air System Cooling Coil Total Cooling Energy’, and ‘Air System Heating Coil Total Cooling Energy’).
2.4. Reference buildings
The Office of Energy Efficiency & Renewable Energy provides different (large, medium, small) office building simulation models across different climates and cities in the United States (EERE 2022). The buildings follow the American Society of Heating, Refrigerating and Air- Conditioning Engineers standard 90.1. From the provided building models, all case study cities are used except the international cities and Honolulu for the small and large office buildings. The remaining 15 case studies are highly suitable for the presented analysis to explore the impact of the regional climate. In the present study, we employed the ‘Small Office’ and ‘Large Office’ archetypes to test the hypothesis on the impact of DST on energy consumption. The provided buildings directly characterize a large part of the commercial U.S. building stock (EERE 2022). Figure S1 shows the building geometry of the simulated small and large office buildings. The total floor area for the large office is 46ʹ320 m2, and for the small office, the floor area is 511 m2. More detailed building characteristics (U-values etc) can be found online (EERE 2022).
2.5. Working schedules and DST hours
The number of working hours, as well as the typical start and end of working hours in the day, is a result of preferences, regulations and culture and therefore country-specific. The simplifying assumption was made in this study that all working hours are generally either 8:00–18.00 (standard time) or 7:00–17:00 (daylight saving time) across all case study regions to support the hypothesis. Nevertheless, as this study employed archetypes openly available (EERE 2022), default schedules for occupancy available in these sourced models, such as lighting, HVAC operation, and so on, were used. For example, in these default schedules, the occupancy varies throughout the day, and the HVAC system is active between 6:00 and 19:00 for the small building archetype, and between 6:00 and 22:00 for the large one. The simulated DST period starts on 31 March and ends on 27 October and weekends are included in the analysis. Fixed working schedules are assumed, which means that the maximum theoretical impact on cooling and heating is simulated. The current policies on DST differ across the different case studies. In 2018, the ‘Sunshine Protection Act’ (House Bill 1013) for example moved Florida to DST over the full year. For this study, all energy simulations were performed independently of current regulations.
2.6. Climate scenario data
Future climate scenarios according to the RCP are obtained from Meteonorm Version 8.0 (Remund et al 2020). For all simulations, typical meteorological year (TMY) data are used. TMY data are a collation of a set of meteorological data, where for each month, data have been selected for each month from a historical year where the respective month was considered most typical. The scenario TMY files are generated from ten global climate models based on CMIP5 (WCRP 2020). Full methodological details on how localized TMYs are obtained are provided in the Meteonorm handbook (Meteonorm et al 2020). When assigning present and future weather data to the different locations of the prototype building models, the geographically closest weather station available in Meteonorm is selected for each station. For all case study locations, this spatial matching is unambiguous, except for Port Angeles, where the weather station in Quillayute (WS) is considered the closest weather station.
Averaged cooling and heating demand of all days in the DST time period (31 March–27 October) in 2020 show typical demand profiles in most case studies, with peak cooling demand in the late afternoon and peak heating demand in the morning hours (figure 3). All simulated case studies require both heating and cooling, even though the cooling needs are small for example for Port Angeles and only small heating demands were simulated for San Diego or Tampa (see table S1). These simulation results show similar daily heating and cooling profiles, changing in relation to the DST implementation, to the ones presented in the conceptual model in figure 1. This was found in both office building types and all RCP scenarios, confirming that the assumed impact of DST on cooling and heating of office buildings is generally expected in reality. A variation in heating and cooling demand profiles, and therefore policy impact, was also expected to occur in relation to the geographical location and climatic exposition of the buildings, which was also observed in the results. When comparing the profiles with and without DST, a shift in demand is observed. Considering the calculated differences in figure 3, the anticipated demand in figure 1 is confirmed: introducing DST leads to higher cooling demand in the morning and a larger reduction in cooling demand in the late afternoon. For heating, the increase in the morning predominates the reduction in the afternoon. Detailed annual heating and cooling results are provided in tables S1–S8.
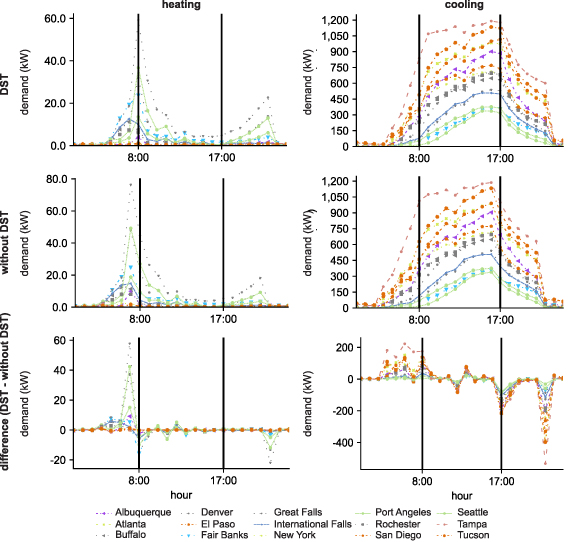
Figure 3. Hourly simulated cooling and heating demand for large offices. Averaged cooling and heating demand of all days in the DST time period of the year 2020 for each case study with and without DST. These profiles confirm the general pattern of peak cooling demand in the afternoon and peak heating demand in the morning and the expected effect when DST is introduced.
Download figure:
Standard image High-resolution image
The simulated impact on heating and cooling demand in the case of DST varies across the different climates and cities across the United States (figure 4). The overall observed pattern for large and small offices is similar: For most case studies, DST reduces cooling demand with maximum demand reductions of 5.9% for Port Angeles. As visualized by the marker size in figure 4, relative saving potentials tend to be larger in the case of lower overall total thermal demand during DST time. The cities with smaller cooling demand (and thus smaller markers) are therefore mostly located on the left side of the figure. At the same time, results show a general increase in heating demand across most case studies and ranges, generally in the order of 1%. Only in the case of the small office archetype located in San Diego the increase was 4.4%. A general trend is found that DST reduces cooling demand whilst increasing heating demand, as previously hypothesized. In the case of currently high cooling demand and hot climate, the potential savings in heating (as well as an increase in heating demand) is however smaller. With increasing temperature and increased frequency and intensity of heat waves due to climate change, the general simulated trend is that the DST-induced cooling savings decrease whilst the increase in heating is also smaller. The arrows in figure 4 visualize this shift in demand change for the RCP 4.5 scenario. Relative savings in cooling consumption by introducing DST are only marginally, but systematically, reduced. The absolute reduction in cooling demand under future climatic conditions remains similar (see figure S3). We find the same principle to hold across the different future climate scenarios: In case of more extreme climate scenarios such as an RCP 8.5 scenario, the outlined effects are more pronounced. Similarly, an RCP 2.6 scenario leads to a less pronounced impact when compared to an RCP 4.5 simulation (see SI for full results of the different RCP scenarios). Despite the limited relative reduction in cooling demand, the absolute cooling (as well as combined) reduction remains similar. With higher absolute cooling demands in future climate, the importance of the effect of DST is decreasing due to the smaller relative impact. Other aspects are also to be considered: in the case of electrification of heating and cooling provision, issues surrounding peak demand and electricity network capacity dimensioning (Burillo et al 2019) are also important. For completeness, all results in terms of absolute and relative heating and cooling demand change are provided in tables S1–S8 and figure S3.
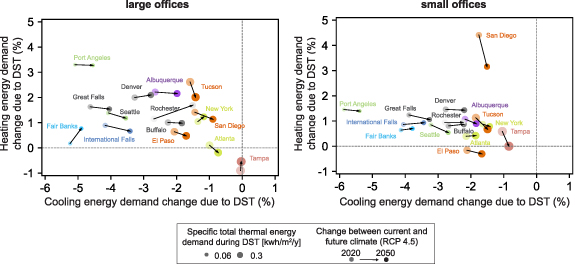
Figure 4. Present and future change in annual cooling and heating demand of two archetype office buildings in different cities in the United States, resulting from the shift in working hours due to introducing daylight saving time (DST). The change in annual cooling (x-axis) and heating (y-axis) demand is depicted for building simulations for the year 2020 and future climate under an RCP 4.5 scenario. The marker size reflects specific total heating and cooling energy demand during the DST time period. The arrow indicates the shift from the current climate to the future climate of each location. The different colors correspond to the coloring of the climate zones in figure 2.
Download figure:
Standard image High-resolution image
These results confirm the outlined conceptual mechanism described in figure 1. The presented analysis covers very diverse climates across the United States and for the majority of the analyzed case studies, a net reduction in total demand is found. Overall savings (i.e. savings in cooling combined with savings in heating) range from marginal savings of up to a maximum of 3% (for Port Angeles) for the analyzed archetypes and case studies for the RCP 4.5 scenario. The variation in the simulation results depends on the geographic location, which ultimately determines the temporal pattern and absolute cooling and heating demands of a building. It is the shape of heating and demand, which determines how DST could lead to savings in cooling and the extent of additional heating demands, which determines overall savings. In colder climates with insignificant cooling demand, increased heating needs result in overall higher energy demand (e.g. Seattle). Similarly, for very hot climates, where the cooling profile is flatter during the day, an overall smaller cooling reduction would be expected (e.g. Tampa). Or DST can result in higher heating demand in desert climates, where the ambient temperature in the morning is particularly low (Awad Momani et al 2009). This study confirms that DST can reduce late-afternoon office cooling demand and lead to overall energy savings despite a potential increase in morning heating demand. When assessing the impact of policies targeting the shift in working routines, climate change and future heating and cooling demand will play a distinctive role: a warmer climate was shown to generally reduce potential relative savings for office energy demand resulting from a shift in working hour patterns, whilst achieving similar absolute reductions. With increasing cooling demand due to climate change and the uptake of active cooling technologies, energy-saving measures are anticipated to become more important (Mutschler et al 2021). To address increasing cooling demand peaks, shifting working hours could be part of an effective demand-side management strategy to adapt to climate change.
As shown, introducing DST reduces the cooling demand of office buildings, and when heating is considered as well, despite a small increase in its demand, DST generally still leads to overall thermal energy savings. This result was found under both current climatic conditions, as well as across the different RCP climate trajectories. A maximum saving of up to 5.9% of cooling demand and a maximum increase in heating of 4.4% was simulated for the current climate. With climate change (for the RCP 4.5 scenario), the maximum saving for cooling was calculated to be 5.4%, with a maximum increase of 3.2% in heating. When observing the mean savings across all case study cities with possible future weather conditions, the relative savings in cooling demand due to DST are decreasing with a warmer future climate, whilst the absolute savings remain approximately constant. When the combined effect of DST on heating and cooling is considered, an overall energy saving is found for both office building types and across all climate scenarios studied. However, also in this case, the relative energy savings decrease with hotter climate whilst absolute energy savings remain similar (see boxplots in figure S3).
The trade-off between cooling and heating demand needs to be considered in the discussion on whether introducing DST is beneficial or not. Separate consideration of heating and cooling demand is required, as the simple calculation of net savings or demand increases considering combined thermal cooling and heating demand is problematic without taking into account the system used to provide thermal energy, and particularly the environmental impact of the primary energy used. To achieve the best ecological solution, priority must be given to the demand, which is harder to meet by sustainable means. It is expected that cooling can be more easily provided by renewable solar generation compared to heating, which may be more difficult to fulfil e.g. with photovoltaics in colder months (Goldstein et al 2020). The location can also impact this decision, as e.g. the local availability of renewable generation such as wind combined with heat pump installations could allow covering heating demands sustainably. However, if reducing heating demand is most sustainable, abandoning DST will likely reduce overall CO2 emissions.
The presented systematic assessment of the impact of DST on cooling and heating in buildings is only a starting point for further analysis. The interplay between residential and office demand, how the thermal energy demand is met or the resulting greenhouse gas emissions are important extensions to this analysis. Also, the role of passive cooling and improved building automation or changes in working mode e.g. due to the behavioral change due to pandemics may impact the presented analysis. What this study however clearly shows is that in the discussion surrounding DST, policymakers should revisit the original policy intention of saving energy by considering energy demand for space heating and cooling whilst considering climate change. The presented findings are furthermore relevant for adaptations to working hour patterns, as the shift in working hours could be achieved with alternative policies not relying on an actual change of clocks.
We thank Fazel Khayatian and Ricardo da Silva for taking part in early discussions.
All original building models are available for download from the Office of Energy Efficiency & Renewable Energy (EERE 2022). Processing scripts and updated building models are available upon reasonable request from SE.
The data that support the findings of this study are available upon reasonable request from the authors.
Conceptualization: S E, R M, M F; Methodology: S E, R M, M F, K O; Investigation: S E, R M, M F, K O; Visualization: S E, M F; Project administration: S E; Writing—original draft: S E, R M, M F, K O; Writing—review & editing: S E, R M, M F, K O
Authors declare that they have no competing interests.