Summary: Three people died at Burning Man in 2026. This was about a quarter of what the crude national rate would predict (~12 deaths). Calculating the age-standardized death rate, we’d expect to see an average of 4.9 deaths. At this rate, seeing 3 deaths is not abnormal. However, Burning Man’s near zero death rate over its existence is abnormal, and likely due to selection bias of healthier attendees and other confounding demographic factors.
The Burning Man event this year (2026) had three confirmed deaths. It made a few headlines as this was the highest recorded number. For an event that has mostly seen no deaths during its 3+ decade existence, this was abnormally high. But I’m curious, compared to the rates we see in the general population, was observing three deaths abnormal? Let’s dive into the numbers and find out for ourselves.
The Black Rock City Census 2025 Population Report has a great demographic breakdown of the 2025 Burning Man population. Of course, we’re comparing 2026 deaths with 2025 data, but we’ll go ahead and say that the attendee makeup is about the same between both years.1
Here are some of the standout data points:
Over 70% are returning attendees
75% are ethnically white
80% had a bachelor’s degree or more
The two largest income groups continued to increase in participation, with the second largest income group ($100,000 to $299,999 yearly) representing over a third of attendees.
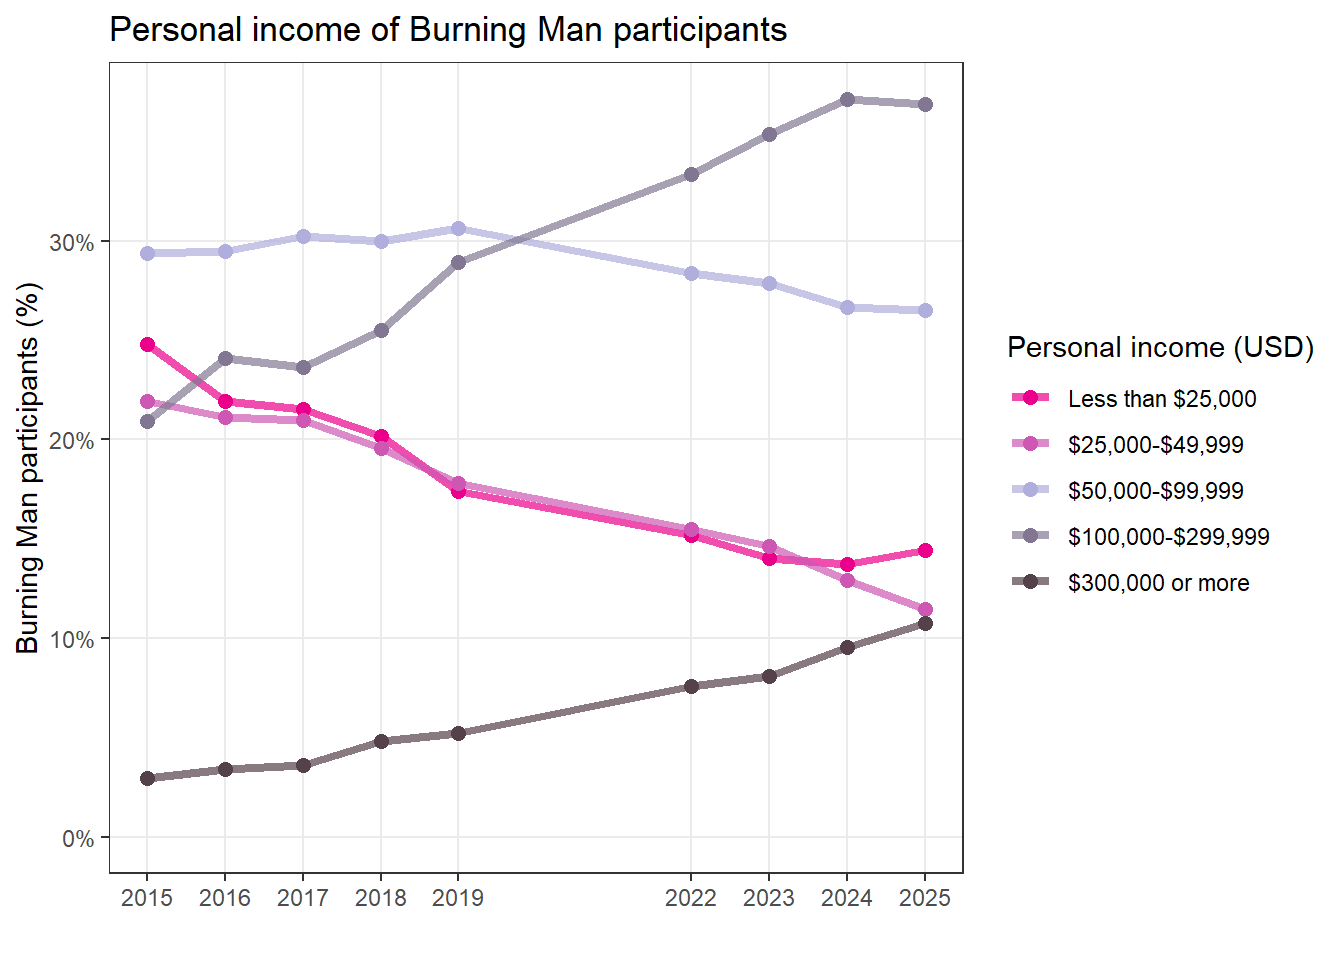
These slices of Burning Man attendees represent a unique population, not indicative of your average US population. I took the Burning Man age distribution and overlaid that with that of the general US population:
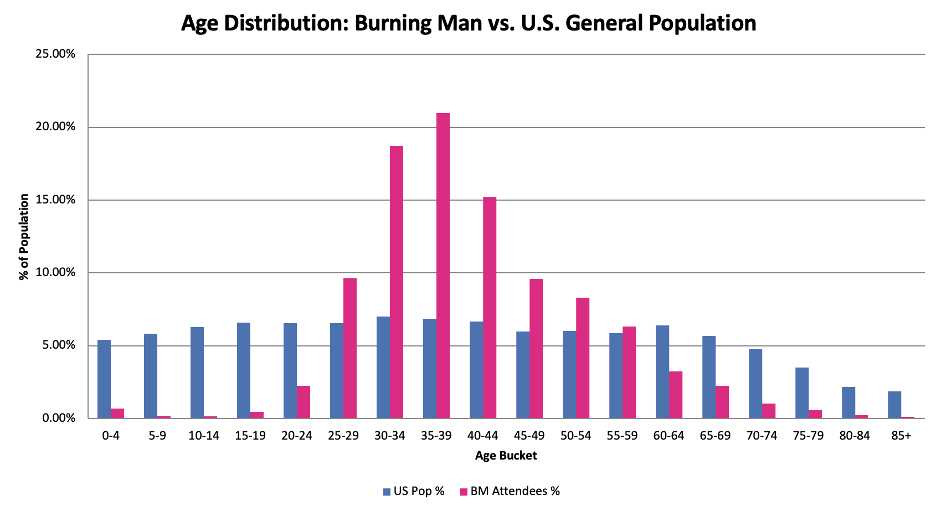
The Burning Man population is significantly younger than the oldest in the US population, where death rates are much higher. Keep this chart in mind going forward.
Let’s do the simplest comparison we can. The crude all-cause mortality rate in the general US population was 909.3 deaths per 100,000 people, per year.2 And at Burning Man, we observed 3 deaths per approximately 70,000 people in 1 week.
If we scale 909.3 deaths over 100,000 person-years to 70,000 people-weeks (70,000 people * 1 week), we get 12.2 deaths.3 That is, if we randomly select 70,000 people from the US population and observe them for 1 week, we’d expect to see 12.2 deaths on average.4
Before, 3 deaths seemed abnormally high, but now we’re saying that 12.2 deaths, over 4x what we observed, is expected. What gives?
You’ll recall that the Burning Man population is quite unique. The attendees are younger, more educated, and higher earners than the general US population. That might explain why we see such a big difference in expected vs observed rates.
In an ideal world, we would account for age, income, sex, race, education, and all other demographic factors. We would find a reference population that looks as close to the Burning Man population, calculate how many deaths we’d expect to see, and compare that to what we observed at the event.
Let’s look at how some of these factors affect mortality rates.
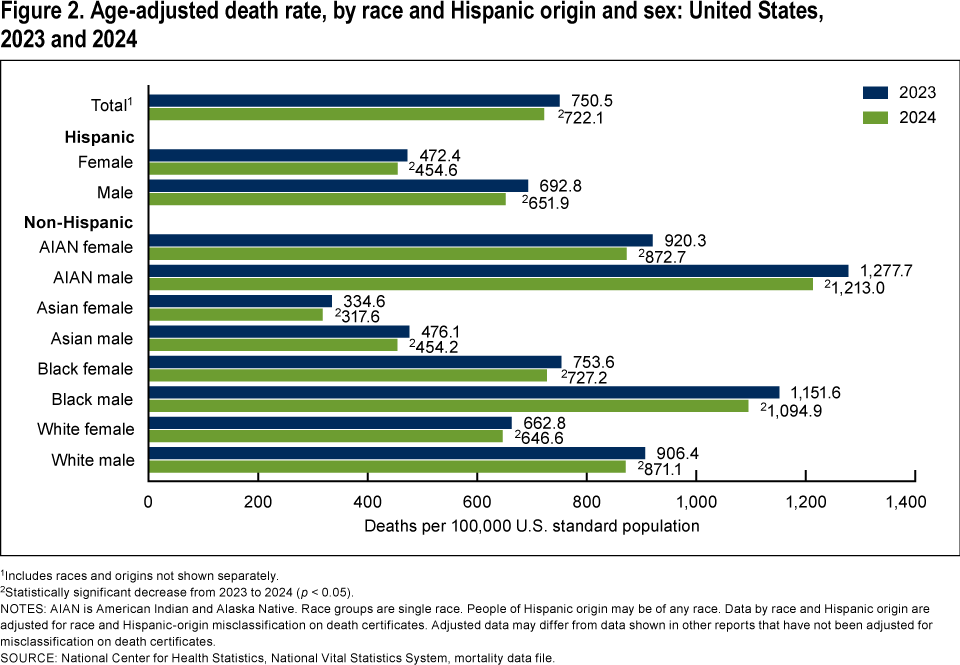
By race and sex, certain races have a higher death rate. Men also seem to die at a higher rate.
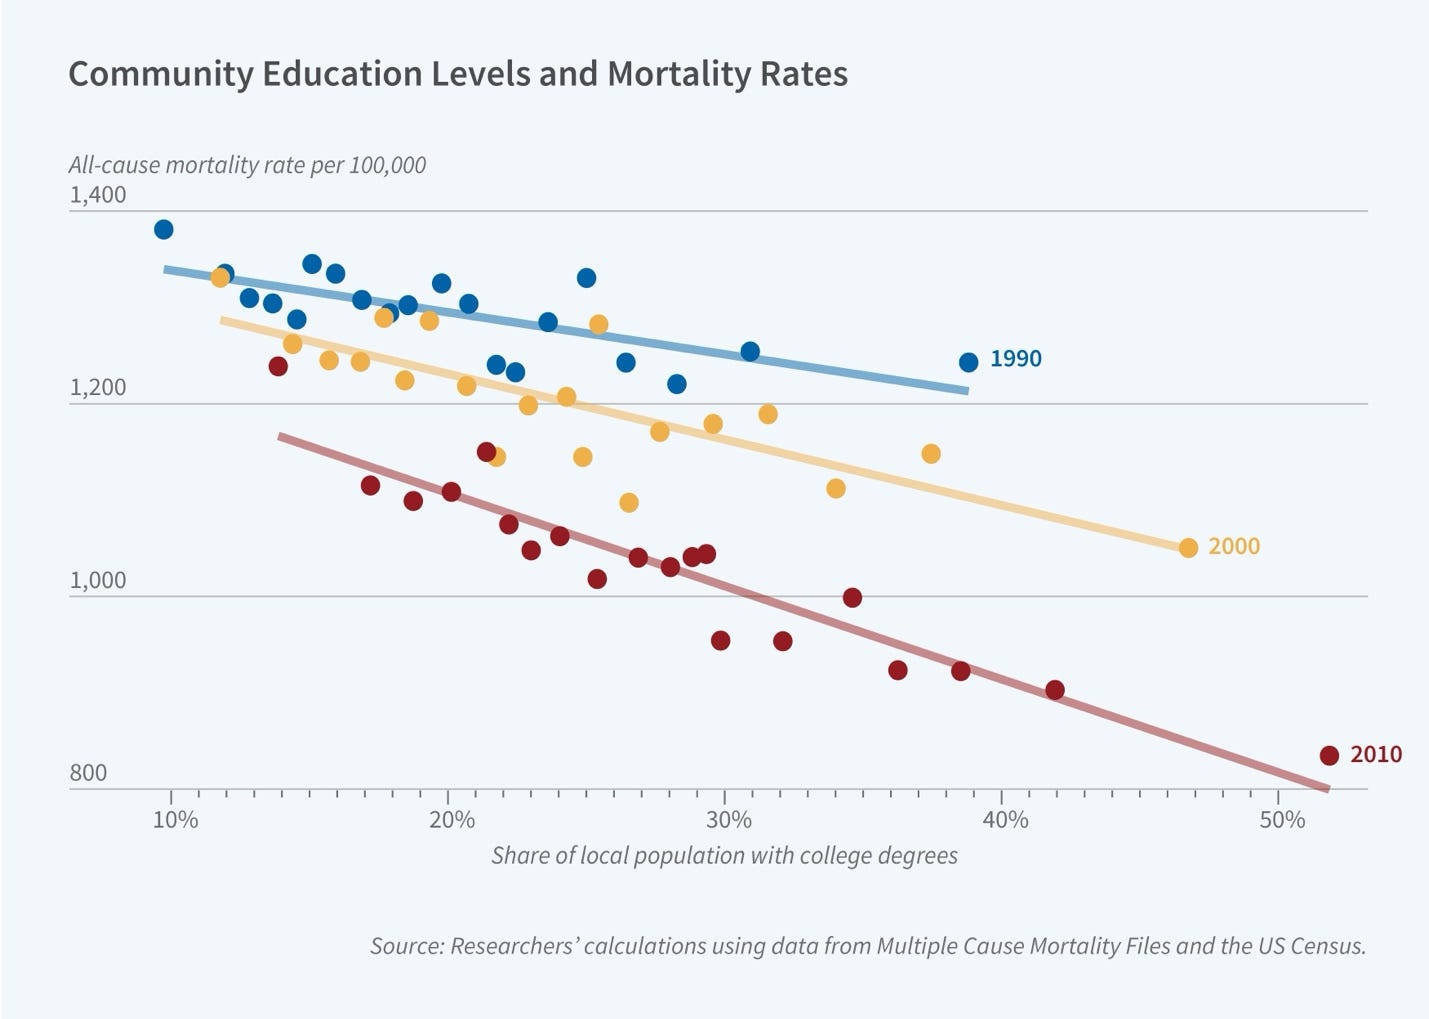
Higher educated people had lower death rates.
And the death rates go up exponentially, the older you are.
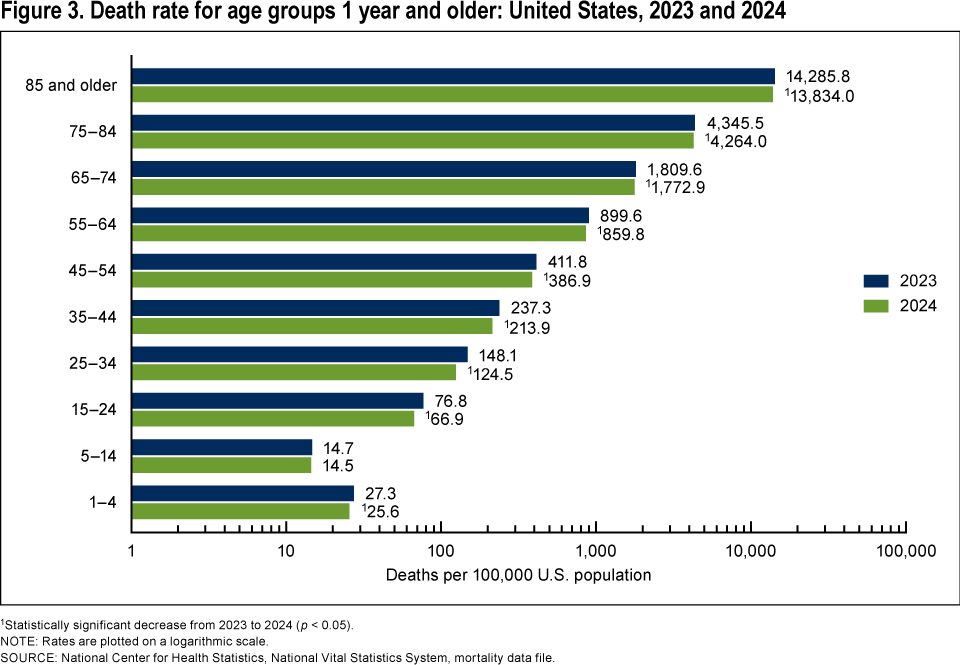
Given this, we can find a better estimate for the death rate that accounts for these factors. That process is called standardization. Instead of applying one single number like 909.3 deaths per 100,000 person-years, we can break it down.
To standardize by age, we can use the age specific death rates above. We apply each specific death rate (e.g., 4264 deaths for the 75-84 age group in the chart above) to the number of Burning Man attendees within that age bracket. Doing so, we’d estimate observing 4.9 deaths on average.
Before, we had estimated we should see 12.2 deaths at a Burning Man event, if we were to randomly sample the US population. Now we’re saying 4.9. The big difference between these estimates is that we accounted for age. The Burning Man population skews younger where death rates are lower.
But why did we only look at age? We just saw income, race, sex, etc. has an effect on the death rate. The short answer is, it’s hard, if not impossible to get distributions of the population combining all these variables. We looked at age specifically because it has a huge effect size. Look at the scales in charts above. The age specific death rates are the only ones on a log scale, where the difference between different brackets is well over 10x. Including other factors like race, gender, etc. would be more accurate, but it’s unlikely our estimate would move much from our calculated 4.9 deaths. Plus, our goal is not to keep modifying our method so that our calculations fit what we observed.
We can now ask, how abnormal is observing 3 deaths at Burning Man, given our (age-standardized) estimated death rate of 4.9? To model this, we use a Poisson distribution. It gives us the probability of seeing a given number of deaths in a specific amount of people-time (70,000 people-weeks) at the average death rate we calculated.
There is a 27% chance that we would observe 3 deaths or less, given an average rate of 4.9 deaths. This is also known as a p-value.5 6Why isn’t our p-value greater? Seems like 27% is quite low. By scientific standards, this isn’t abnormal at all. Observing 3 deaths is completely within reason.
However, the relative uncertainty of our point data is quite large at about 58% (1/sqrt(3)). This is the size of the error. If we were talking about death rates in the thousands, we might have an error of 3% or less. But the reality is that at such low counts, our data is considered quite “fuzzy”.
The p-value is even lower if we use the average of all deaths in Burning Man’s existence, which is near zero, instead of our single data point of 3 deaths this year. That is, it is indeed abnormal to observe near 0 deaths every year, given our calculated death rate of 4.9.
You might wonder if further standardizing for race, income, sex, etc. would keep pushing our estimate down toward what we actually observe. It’s plausible it would move it a bit further, but not by much. Age is doing nearly all of the work already, and the other factors have far smaller effect sizes. The more likely explanation for the remaining gap is something no demographic slicing can capture. Burning Man selects for healthier people who are willing and able to spend a week in the desert heat, regardless of their age, race, or income bracket.