100% local · zero telemetry · real-time everything
Real-time control plane for Claude Code.
A local-first dashboard that tracks every Claude Code session, agent, and tool call as it happens - and now spawns new ones for you. Sessions, kanban, analytics, workflows, MCP, plugin marketplace, and a 12-tab Config Explorer for everything Claude Code knows about.
Get started Read the wiki View on GitHub
Real-time hooks ingestion Stream-json output Conversation mode One-shot headless Resume sessions MCP server (25 tools) Plugin marketplace VS Code extension WebSocket push SQLite (WAL) OpenAPI 3.0 Mermaid diagrams
Real-time hooks ingestion Stream-json output Conversation mode One-shot headless Resume sessions MCP server (25 tools) Plugin marketplace VS Code extension WebSocket push SQLite (WAL) OpenAPI 3.0 Mermaid diagrams
Compaction-aware tokens Per-model cost tracking Subagent hierarchy D3 Sankey workflows Run claude in-browser 12-tab Config Explorer Browser push notifications i18n (en / zh / vi) Activity feed Kanban board Update notifier Local-first, zero telemetry
Compaction-aware tokens Per-model cost tracking Subagent hierarchy D3 Sankey workflows Run claude in-browser 12-tab Config Explorer Browser push notifications i18n (en / zh / vi) Activity feed Kanban board Update notifier Local-first, zero telemetry
Spawn Claude in one click Resume any session instantly Watch tool calls live Track cost per turn Replay full session history 60-second install Edit skills with backups Push notify on Stop Hooks fire in <5ms Single binary, single port Inspect every plugin Works fully offline Spawn Claude in one click Resume any session instantly Watch tool calls live Track cost per turn Replay full session history 60-second install Edit skills with backups Push notify on Stop Hooks fire in <5ms Single binary, single port Inspect every plugin Works fully offline
localhost:4820 - Analytics
The philosophy
Why local-first?
Your Claude Code data stays where it belongs - on your machine. No accounts to sign up for, no cloud service to trust, no telemetry quietly leaking back. Just a fast dashboard that watches what's already happening on your laptop.
🛡️
Zero telemetry
No accounts, no analytics, no third-party calls. The MCP server binds to localhost. Web Push needs your explicit opt-in. What you do here stays here.
⚡
Instant feedback
Hooks fire to the local server in milliseconds. WebSocket push updates the UI before you've taken your finger off the keyboard. No polling, no spinners.
📦
Yours forever
Everything's a SQLite file in ~/.dashboard/ and JSONL transcripts in
~/.claude/. Backup with cp, sync with whatever you already
use, take it offline.
🎛️
Hooks-native
Built around Claude Code's own hook system. The dashboard never wraps, proxies, or monkey-patches your CLI. Your normal workflow continues even if the dashboard is down - hooks always exit zero.
What's inside
Everything you need, on your machine.
Hooks-driven session capture, deep analytics, in-browser Claude spawning, full configuration inspector, and a typed local MCP server with 25 tools.
⚡
Real-time dashboard
Six-tile overview, live agent cards with collapsible subagent hierarchy, recent activity feed, and a composite Health tab - all updated via WebSocket push, no polling.
▶
Run Claude in-browser
Spawn claude subprocesses with a chat-style streaming UI. Conversation
or one-shot mode. Resume any past session in one click. Slash + @-file
autocomplete, live token meter, thinking-effort dial, and model picker.
🧰
Claude Config Explorer
12 tabs covering skills, subagents, slash commands, output styles, plugins, marketplaces, MCP servers, hooks, settings, memory, keybindings, statusline. Edit text-file artifacts with timestamped backups.
📊
Workflows visualization
D3-powered orchestration DAG, tool execution Sankey, collaboration network, error propagation map, concurrency timeline, complexity scatter, compaction impact - 11 datasets with rich i18n tooltips.
💰
Cost & token tracking
Per-model cost estimation with configurable pricing rules, compaction-aware token accounting that preserves totals across context compressions, and an LRU-cached JSONL extractor.
🔌
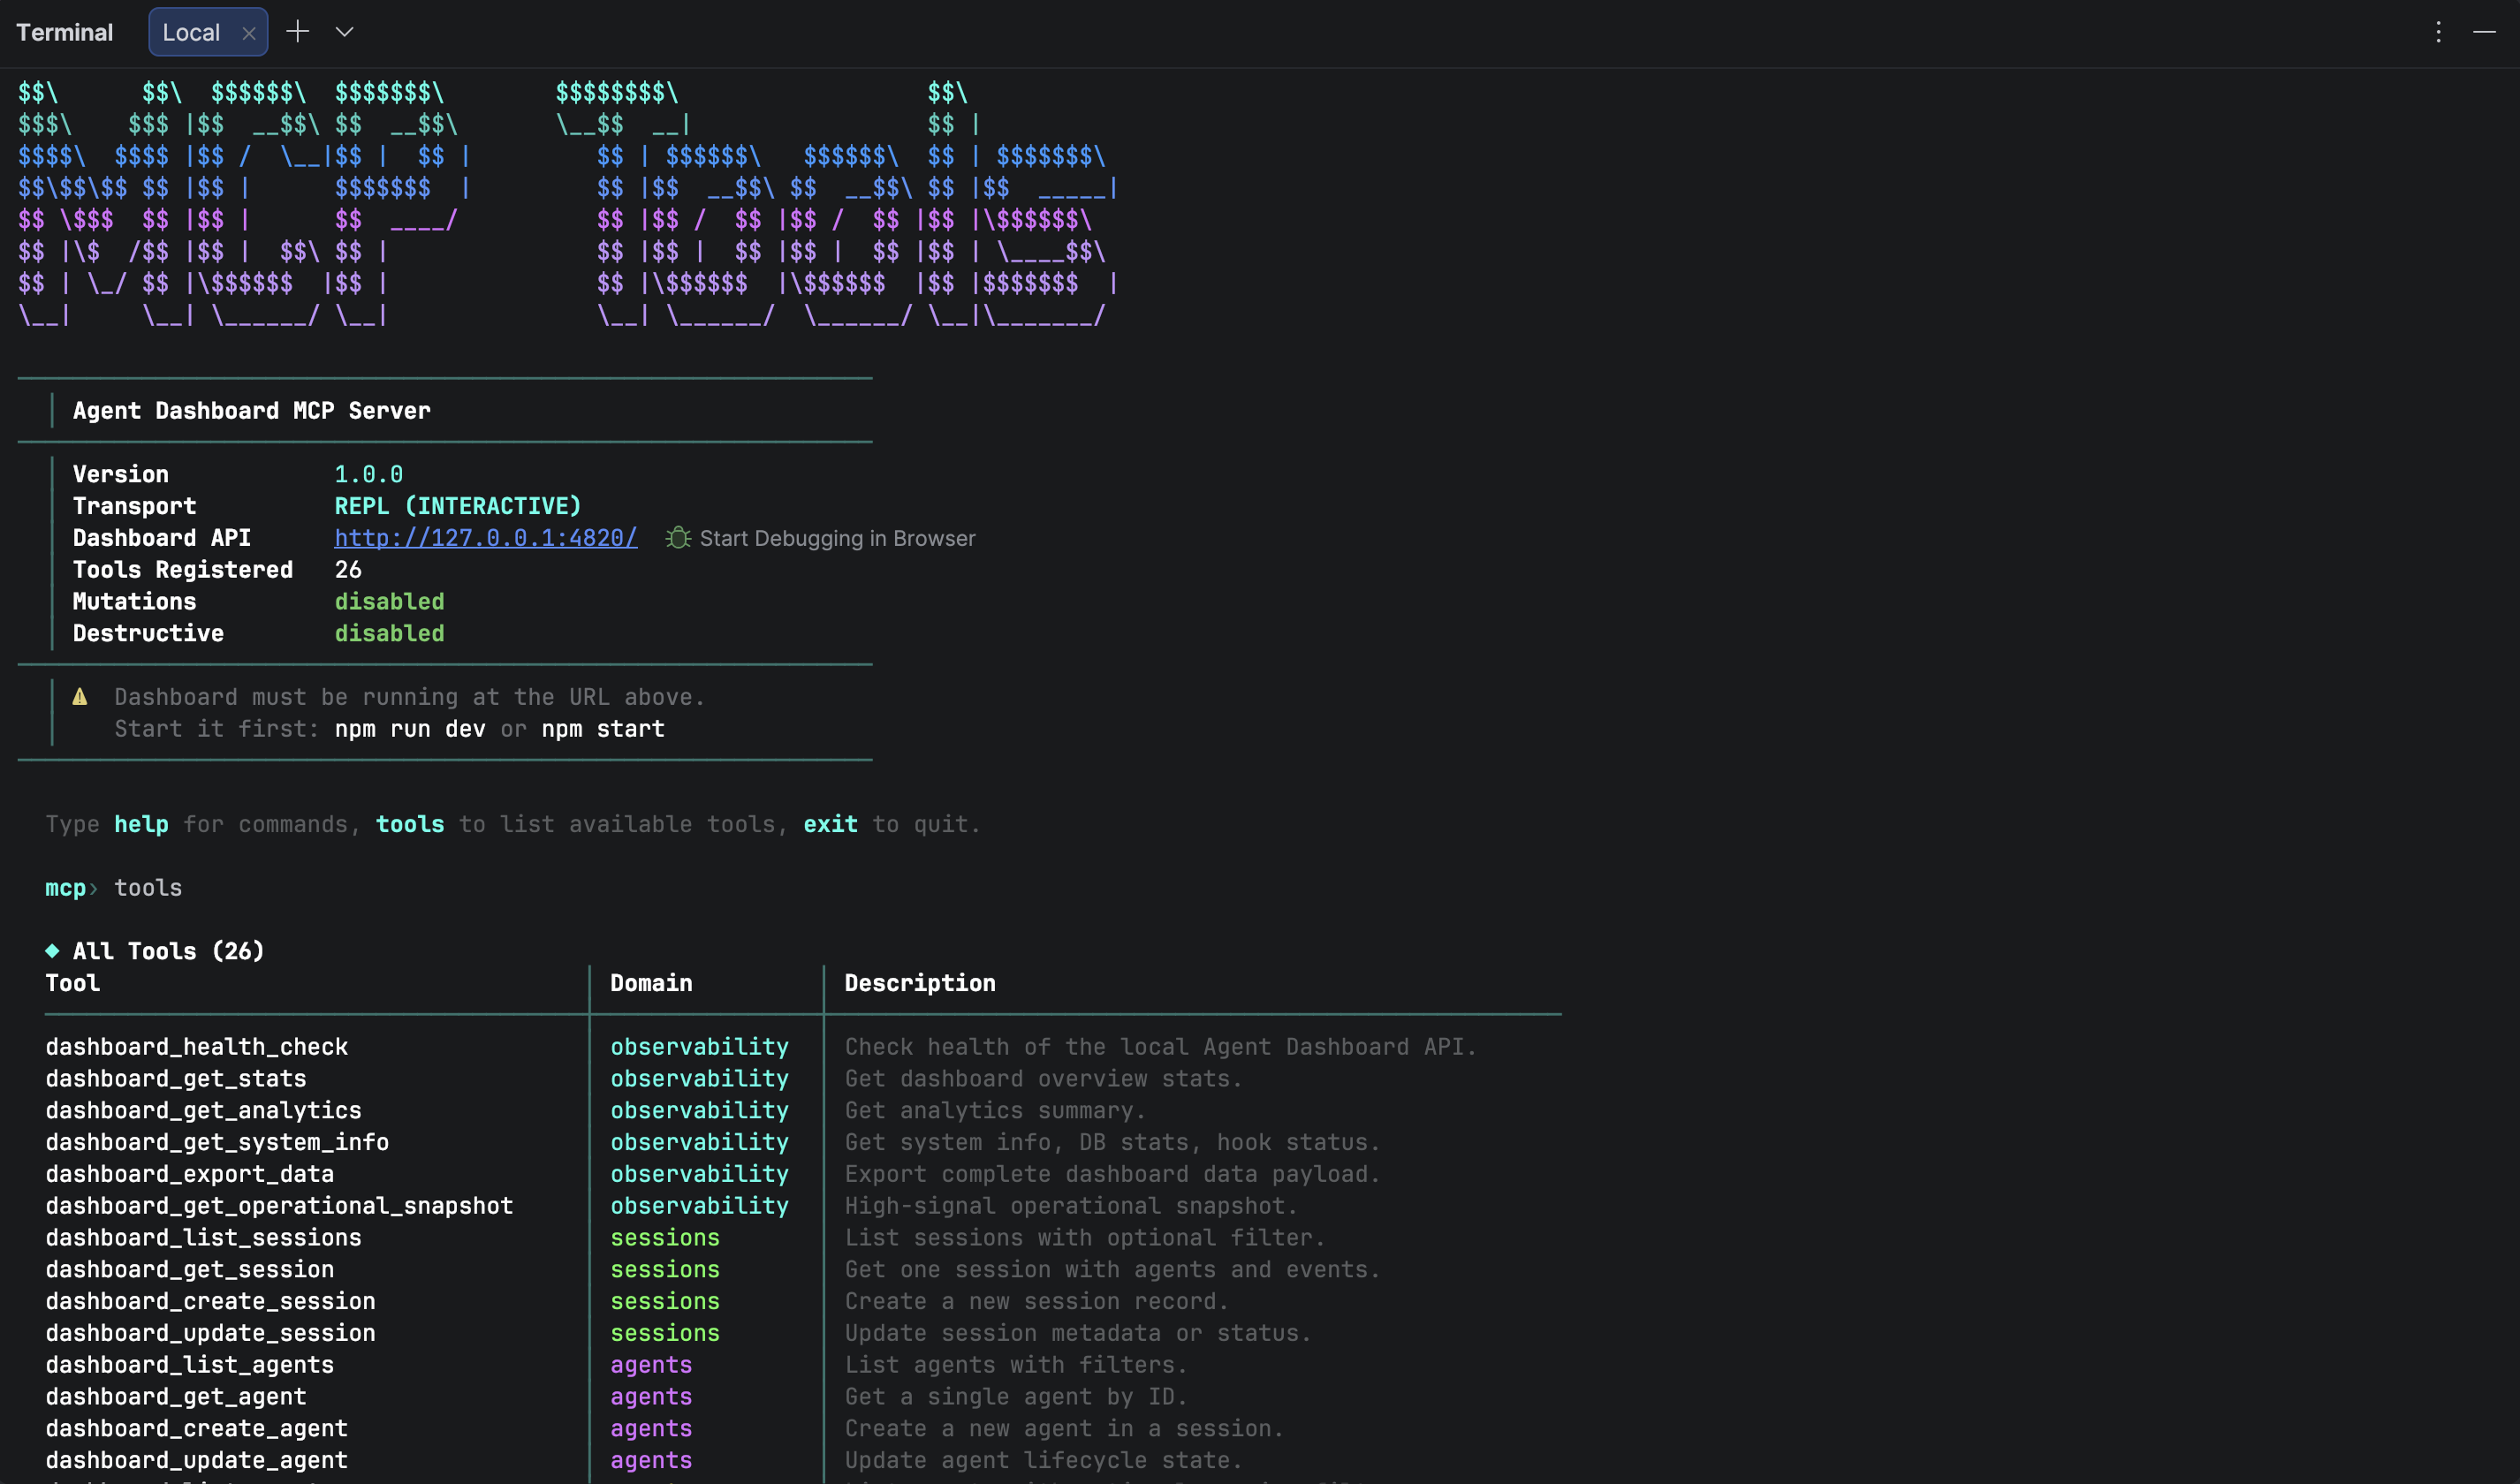
Local MCP server
25 typed tools across 6 domains. Three transport modes (stdio, HTTP+SSE, interactive REPL). Strict input schemas, retry/backoff, localhost-only API enforcement, and tiered safety gates.
🪝
Hooks-driven capture
Auto-installs into ~/.claude/settings.json. SessionStart, PreToolUse,
PostToolUse, Stop, SubagentStop, Notification - every event lands in SQLite within
milliseconds.
📦
Plugin marketplace
Official plugin marketplace with 5 plugins: ccam-analytics, ccam-productivity, ccam-devtools, ccam-insights, ccam-dashboard. 18 skills, 4 agents, 3 CLI tools, 2 hook configs.
🌐
Multi-language UI
English, Chinese, and Vietnamese - coverage extends end-to-end through every chart tooltip, Settings flow, Workflow narrative, Config Explorer tab, and Run page.
📋
Kanban board
Agents and sessions in toggleable views. Working / Waiting / Completed / Error / Abandoned columns with card cost, model, and current tool at a glance. WebSocket-scoped updates avoid unnecessary refetches.
📡
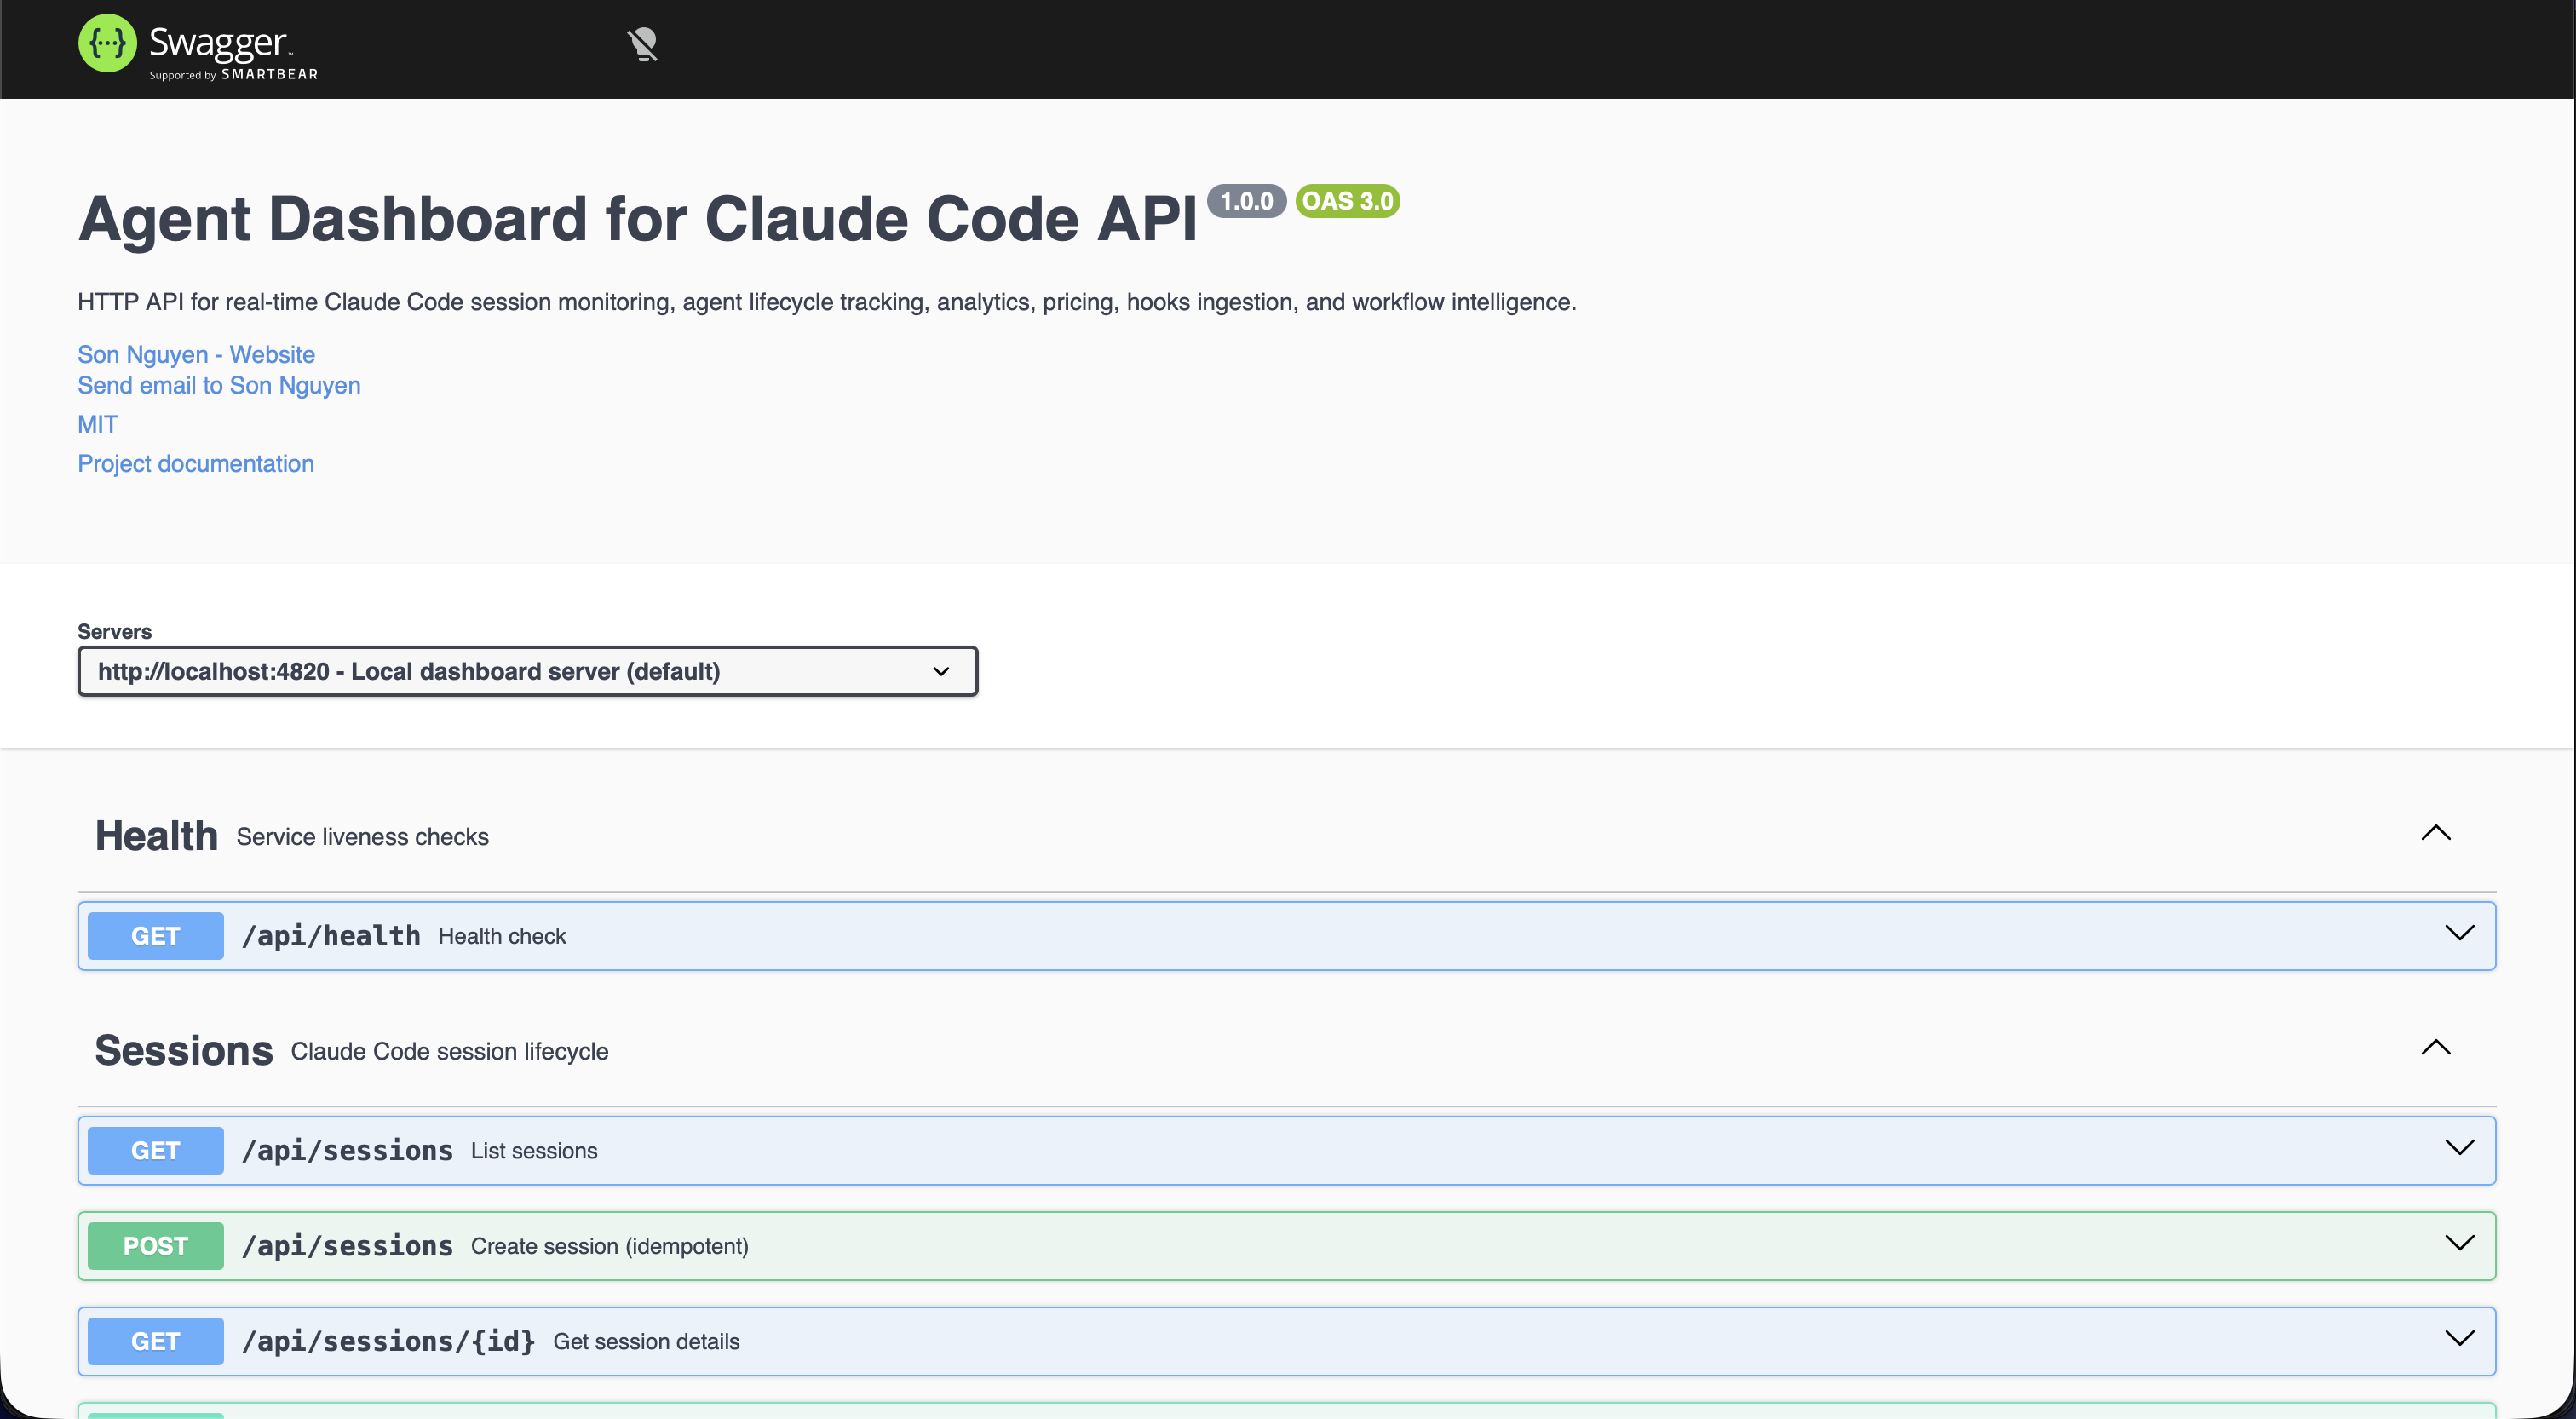
Swagger API docs
Full OpenAPI 3.0 spec with interactive Swagger UI. Try-it-out controls for every endpoint, request/response schemas, and collapsible endpoint groups - all served locally alongside the dashboard.
🧩
VS Code extension
Full dashboard sidebar inside VS Code. Monitor active sessions, view agents, and track tool calls without leaving your editor. Ships as a VSIX with zero external dependencies.
In action
See it for yourself.
Every page of the dashboard, from real-time monitoring to config editing, API docs, and even the VS Code extension. Click any screenshot to expand.
 ⤢
⤢
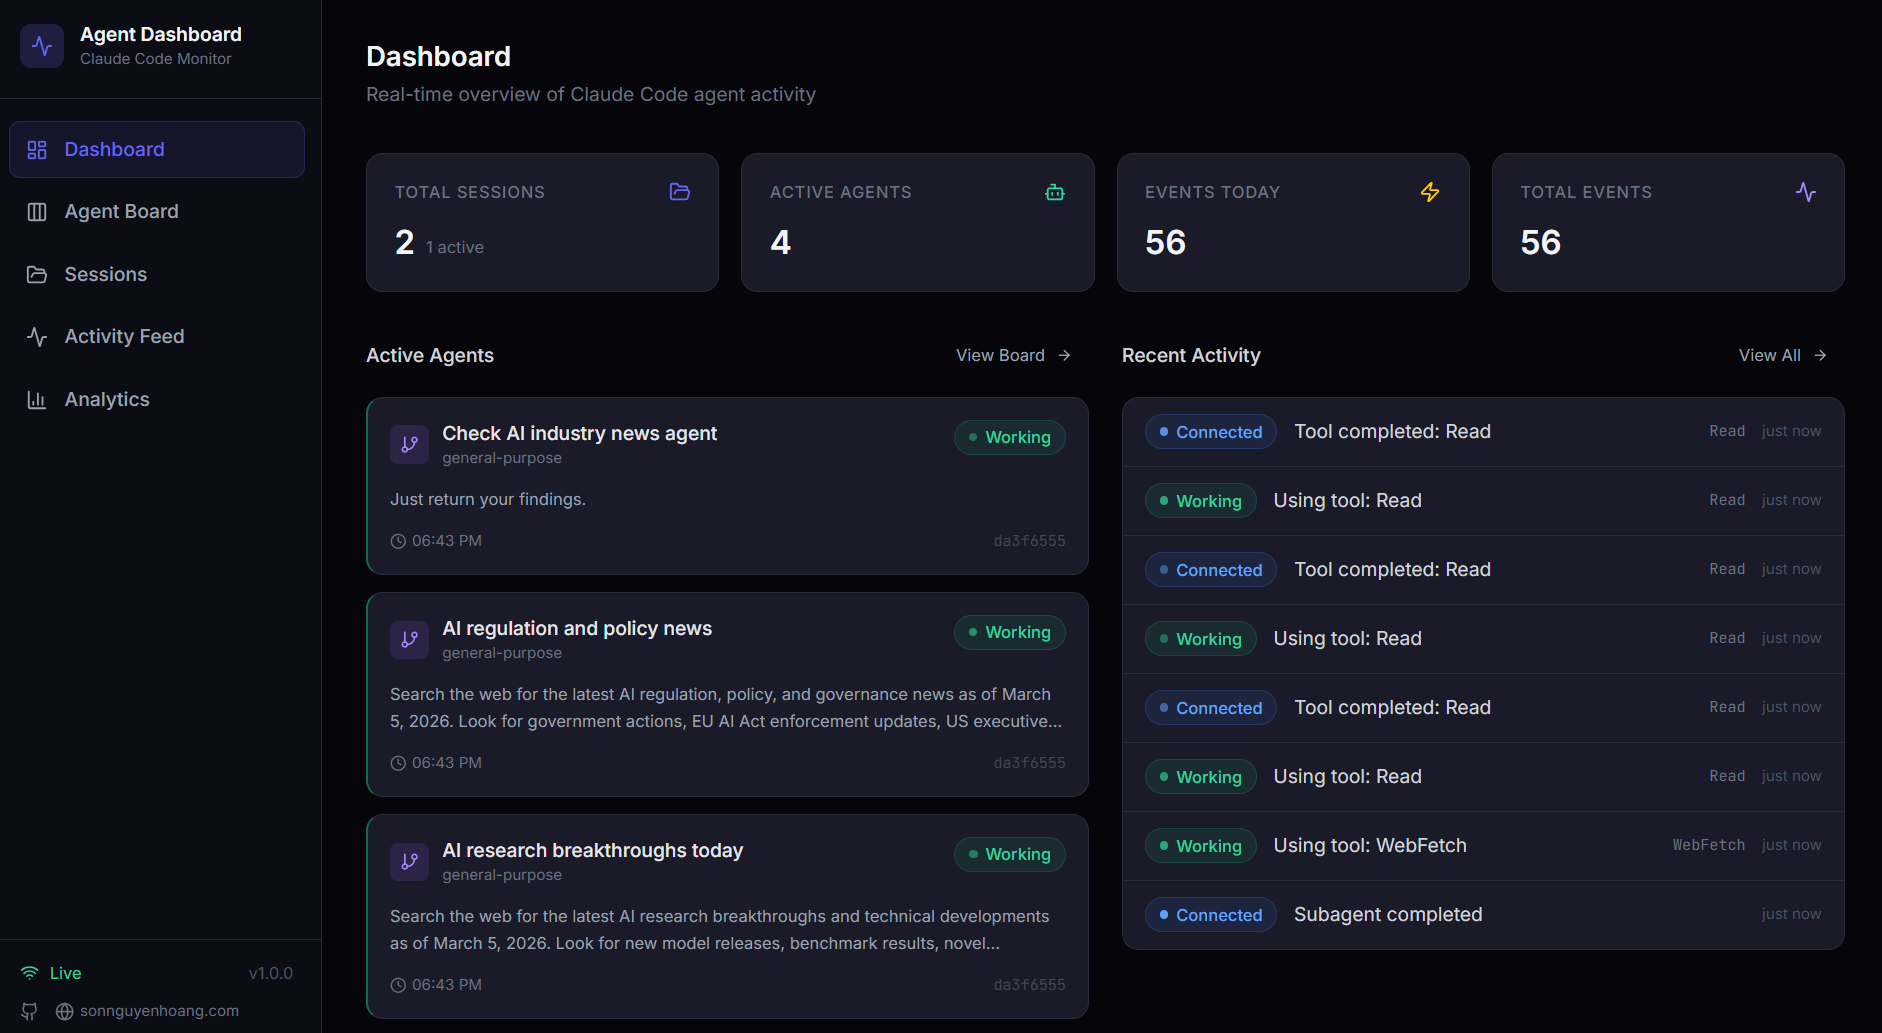
Dashboard · Monitor
Overview stats, active agent cards, and recent activity feed
 ⤢
⤢
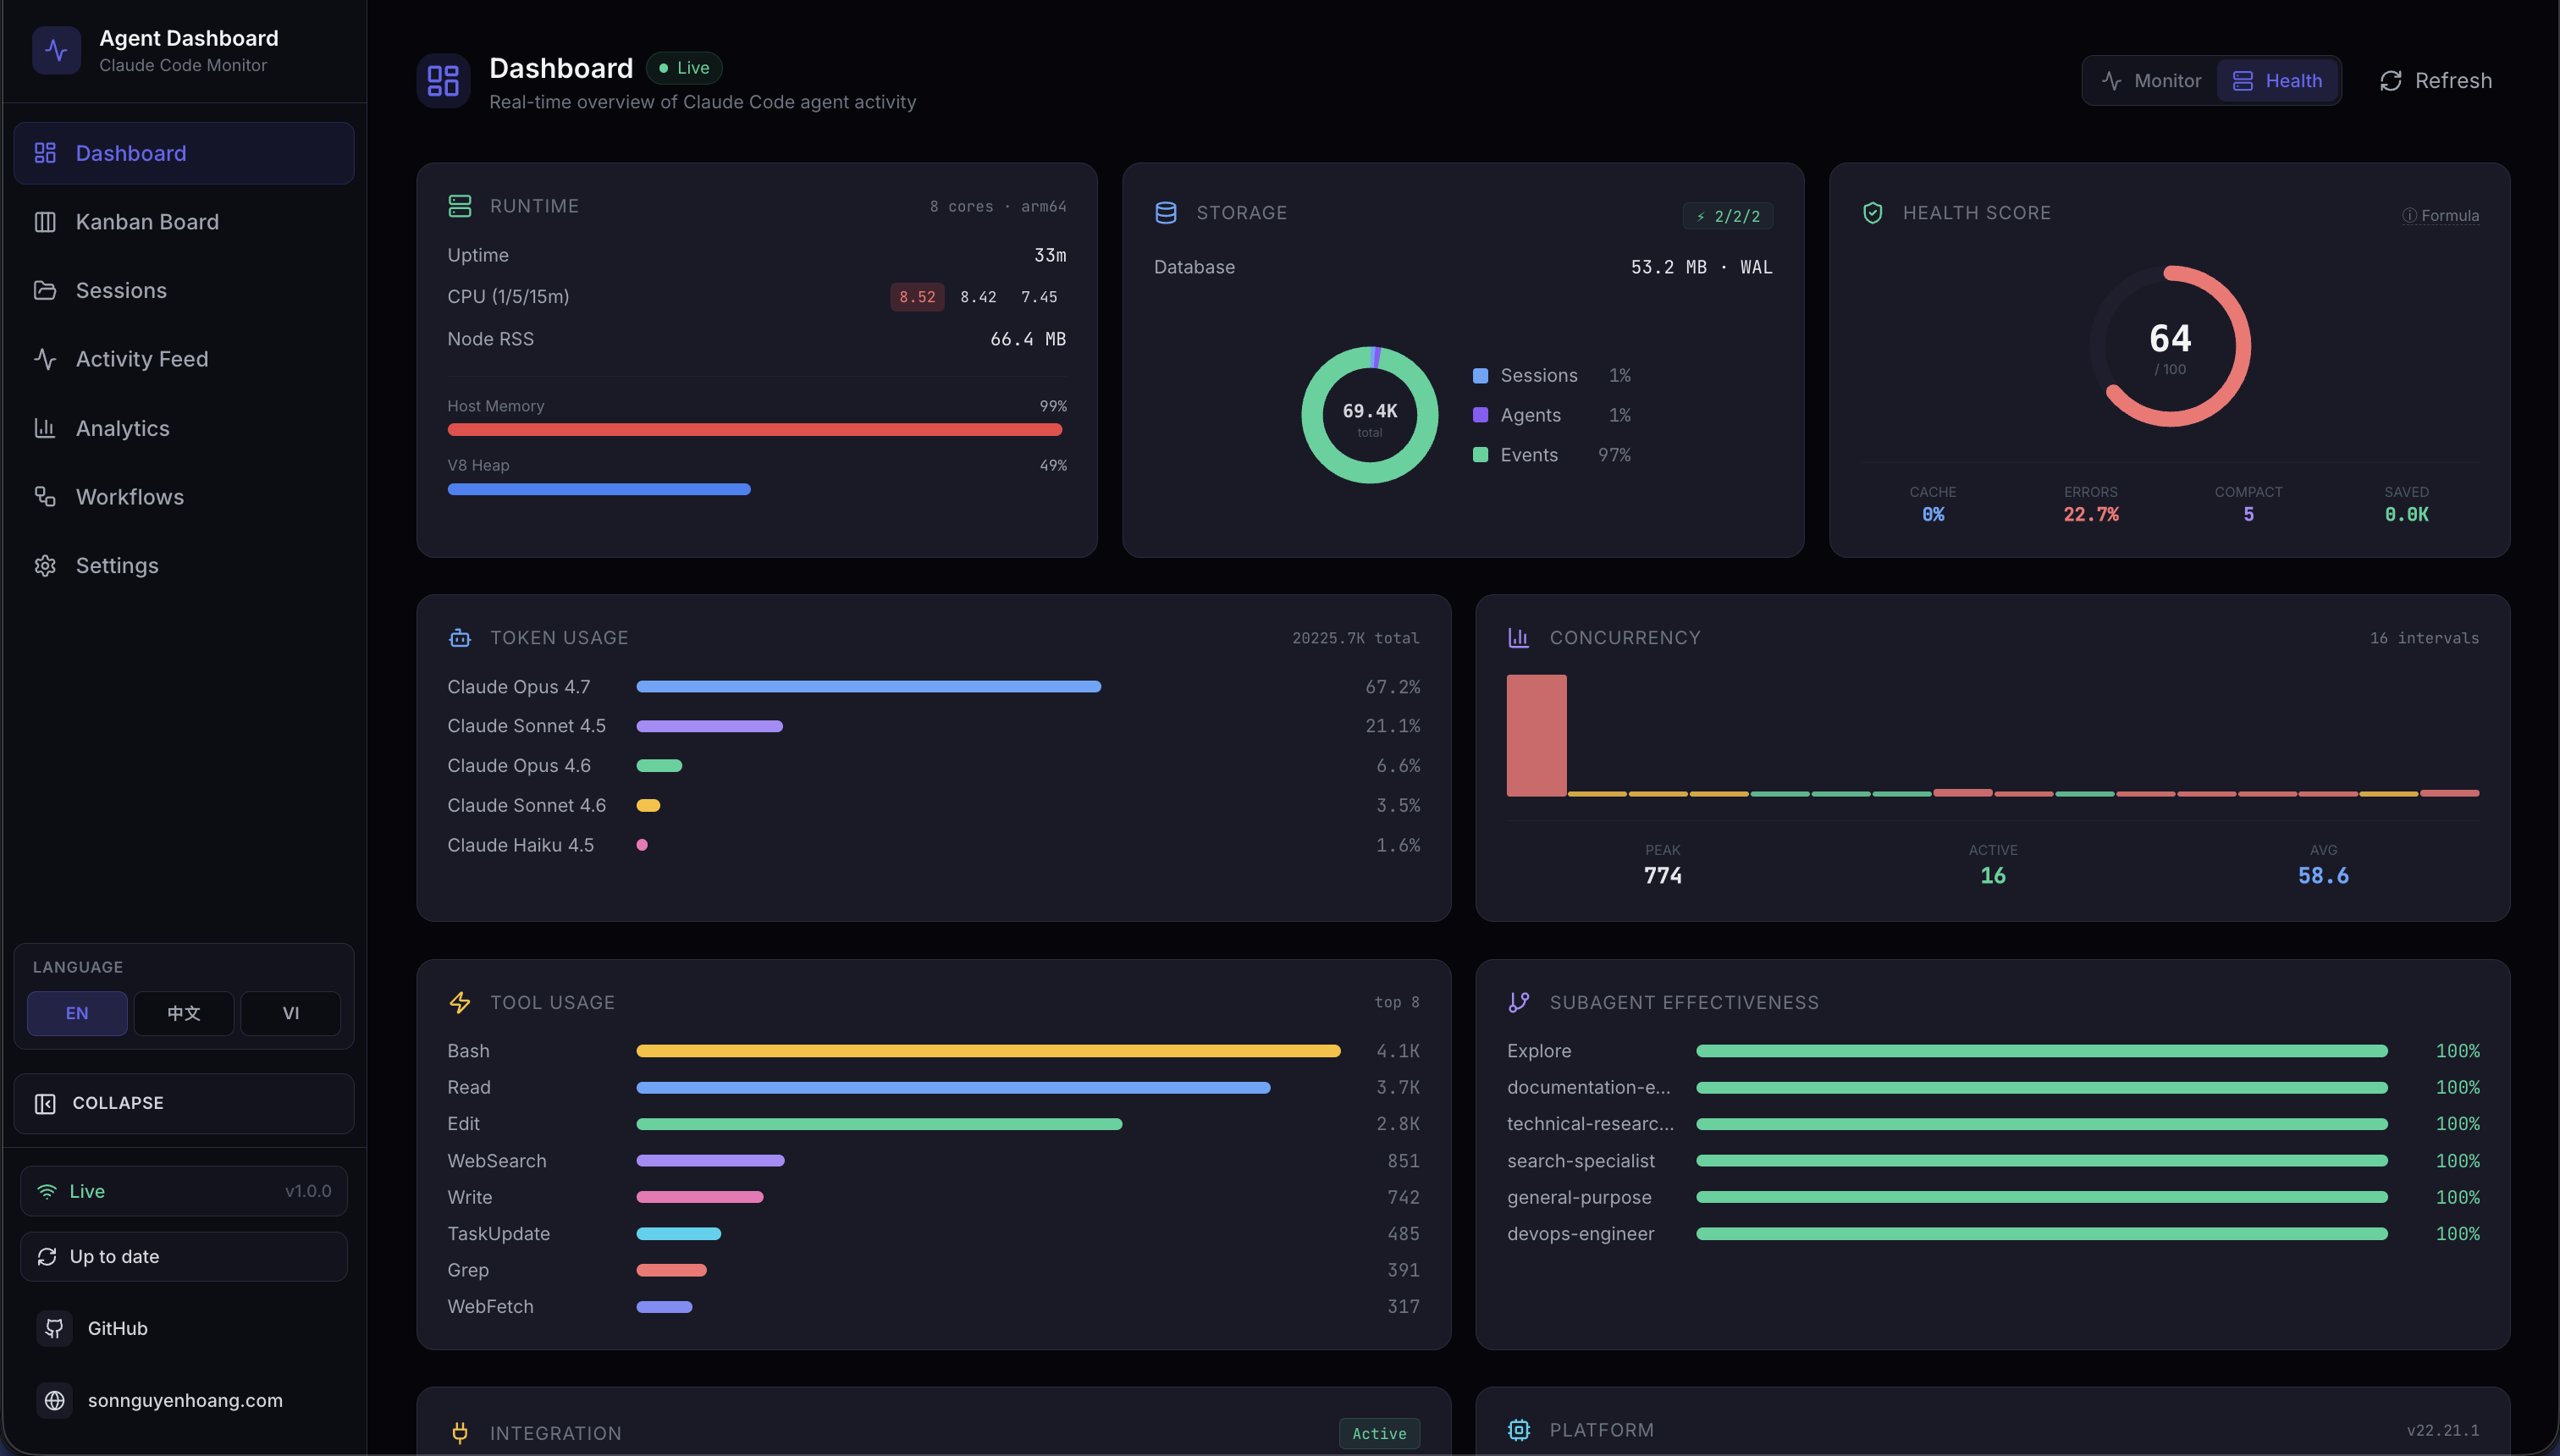
Dashboard · Health
Composite health score, storage donut, cache/error/success gauges
⤢
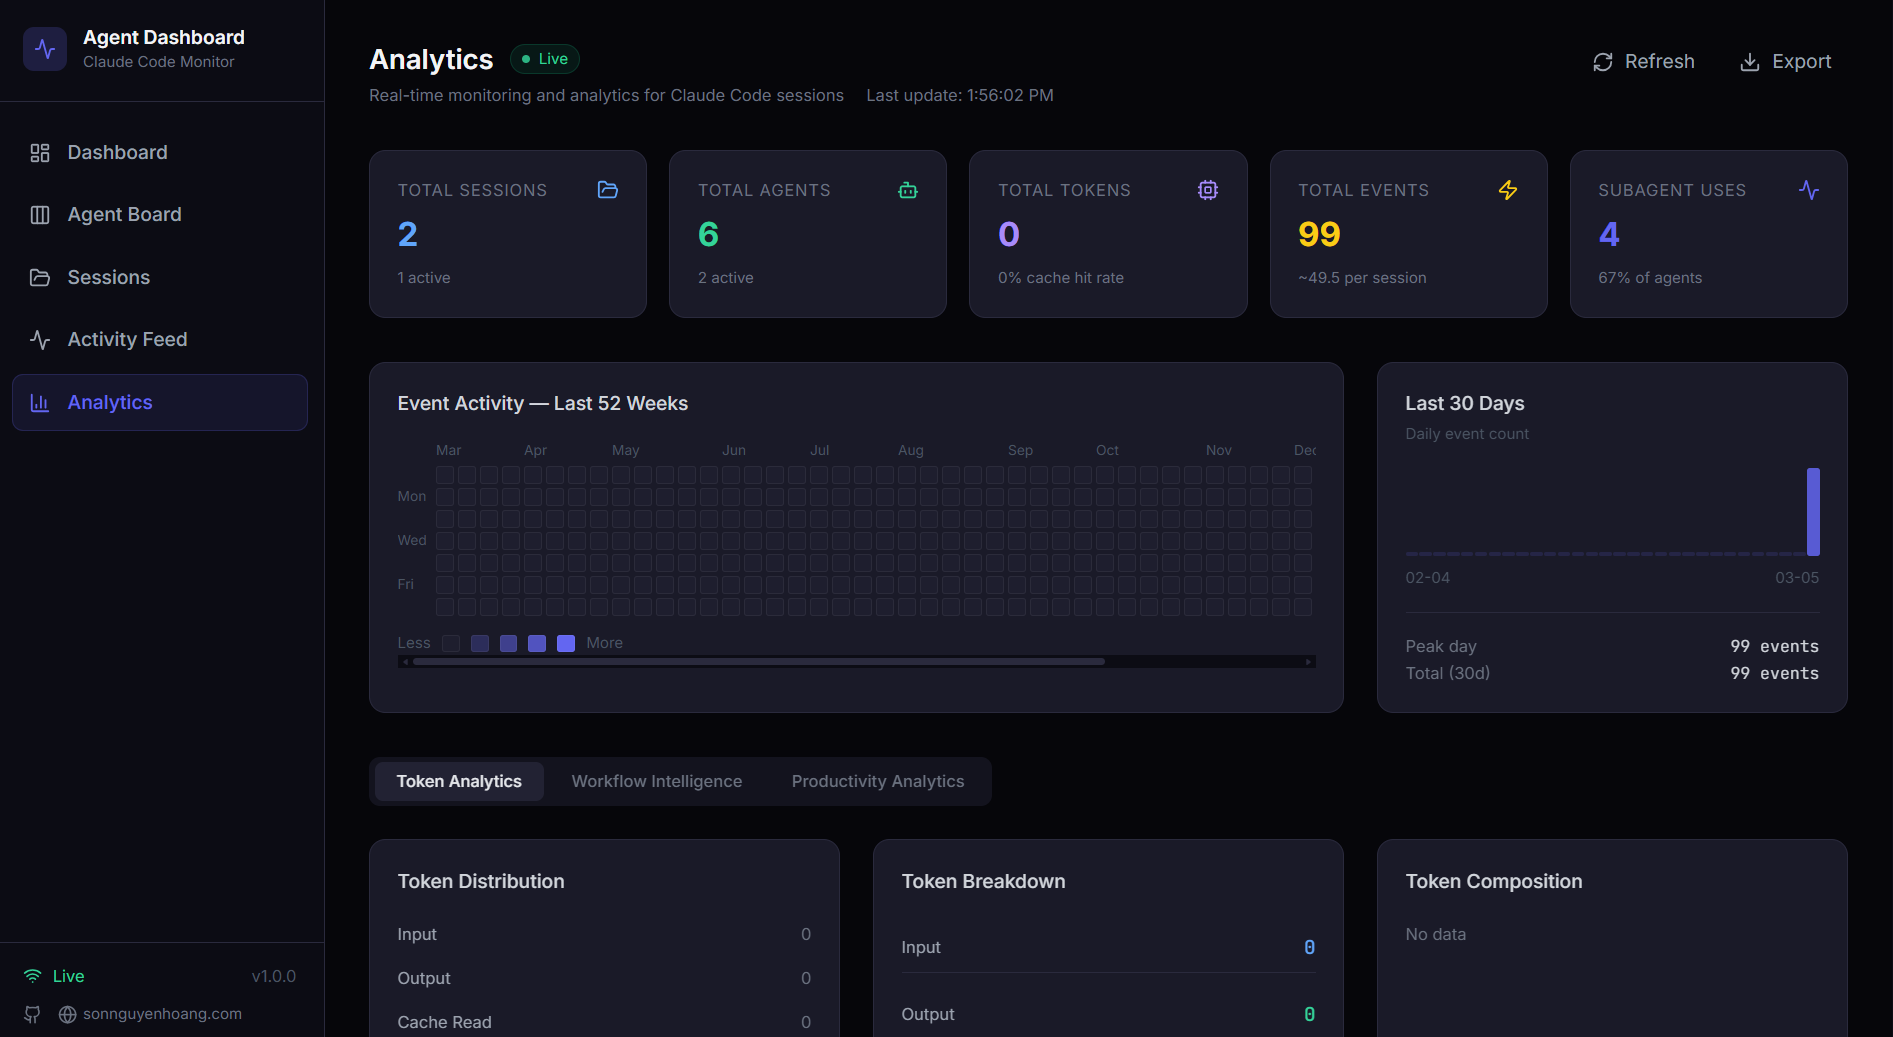
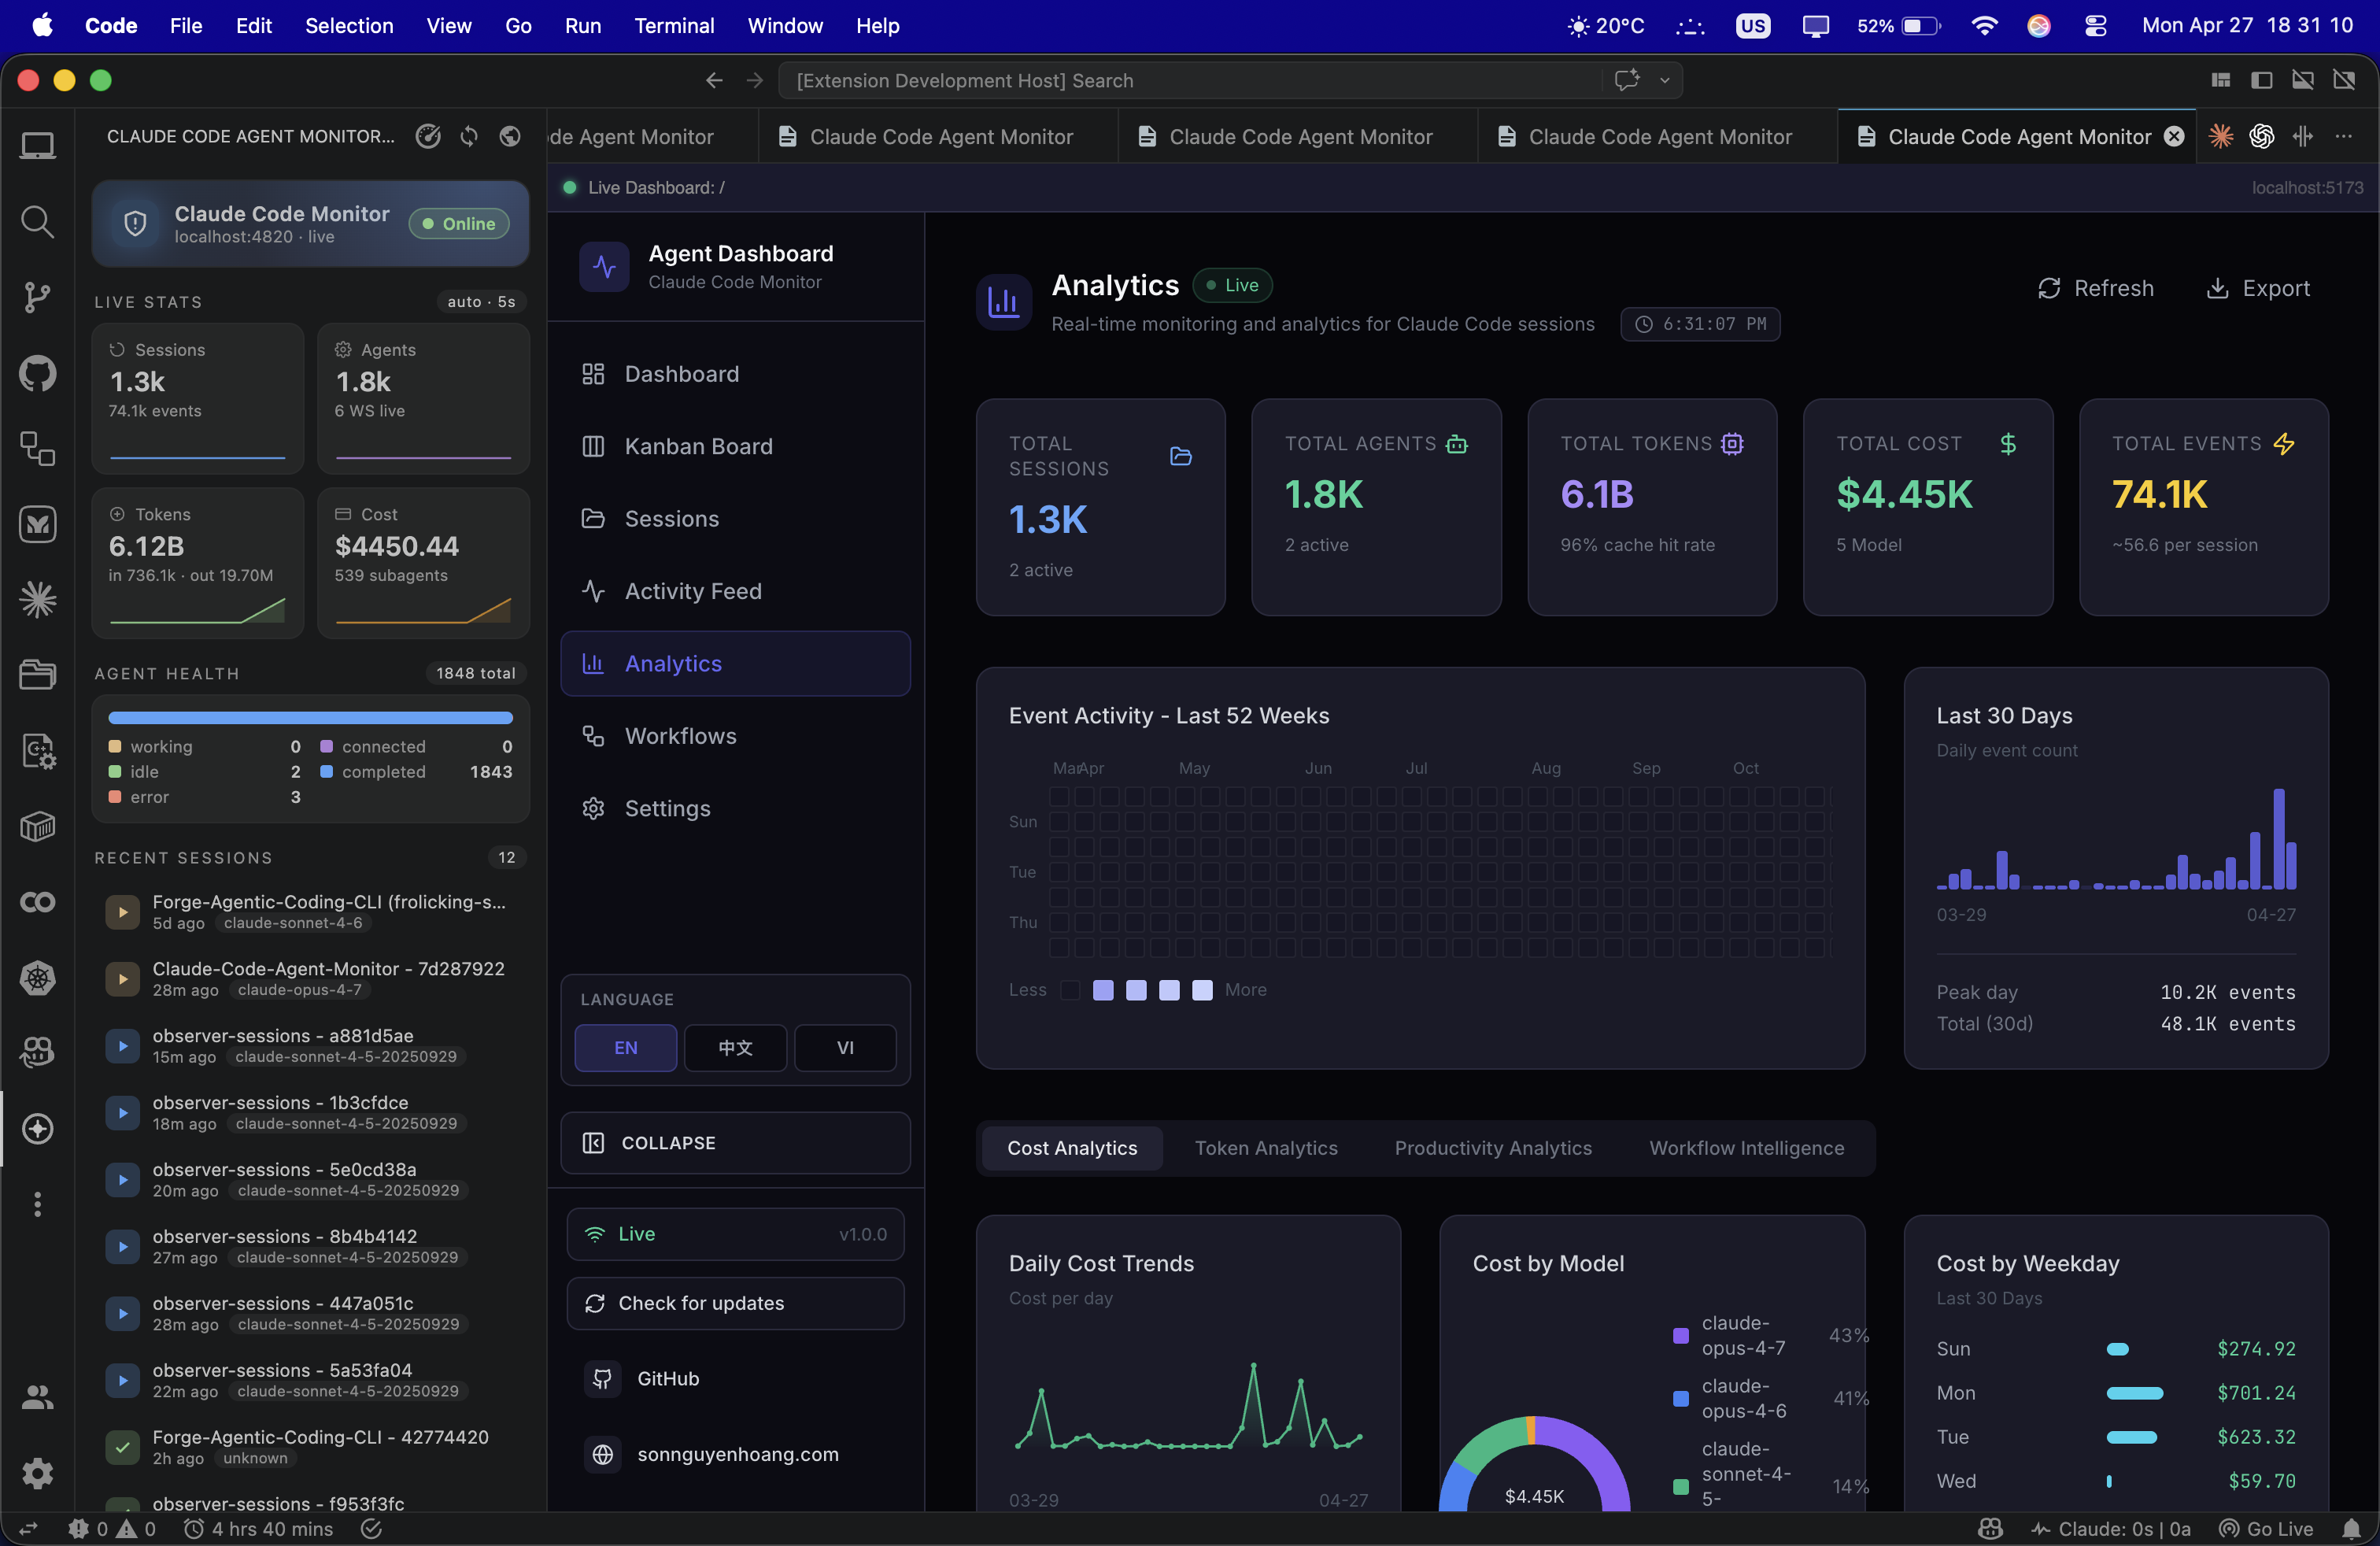
Analytics
Token usage, tool frequency, activity heatmap, session trends
 ⤢
⤢
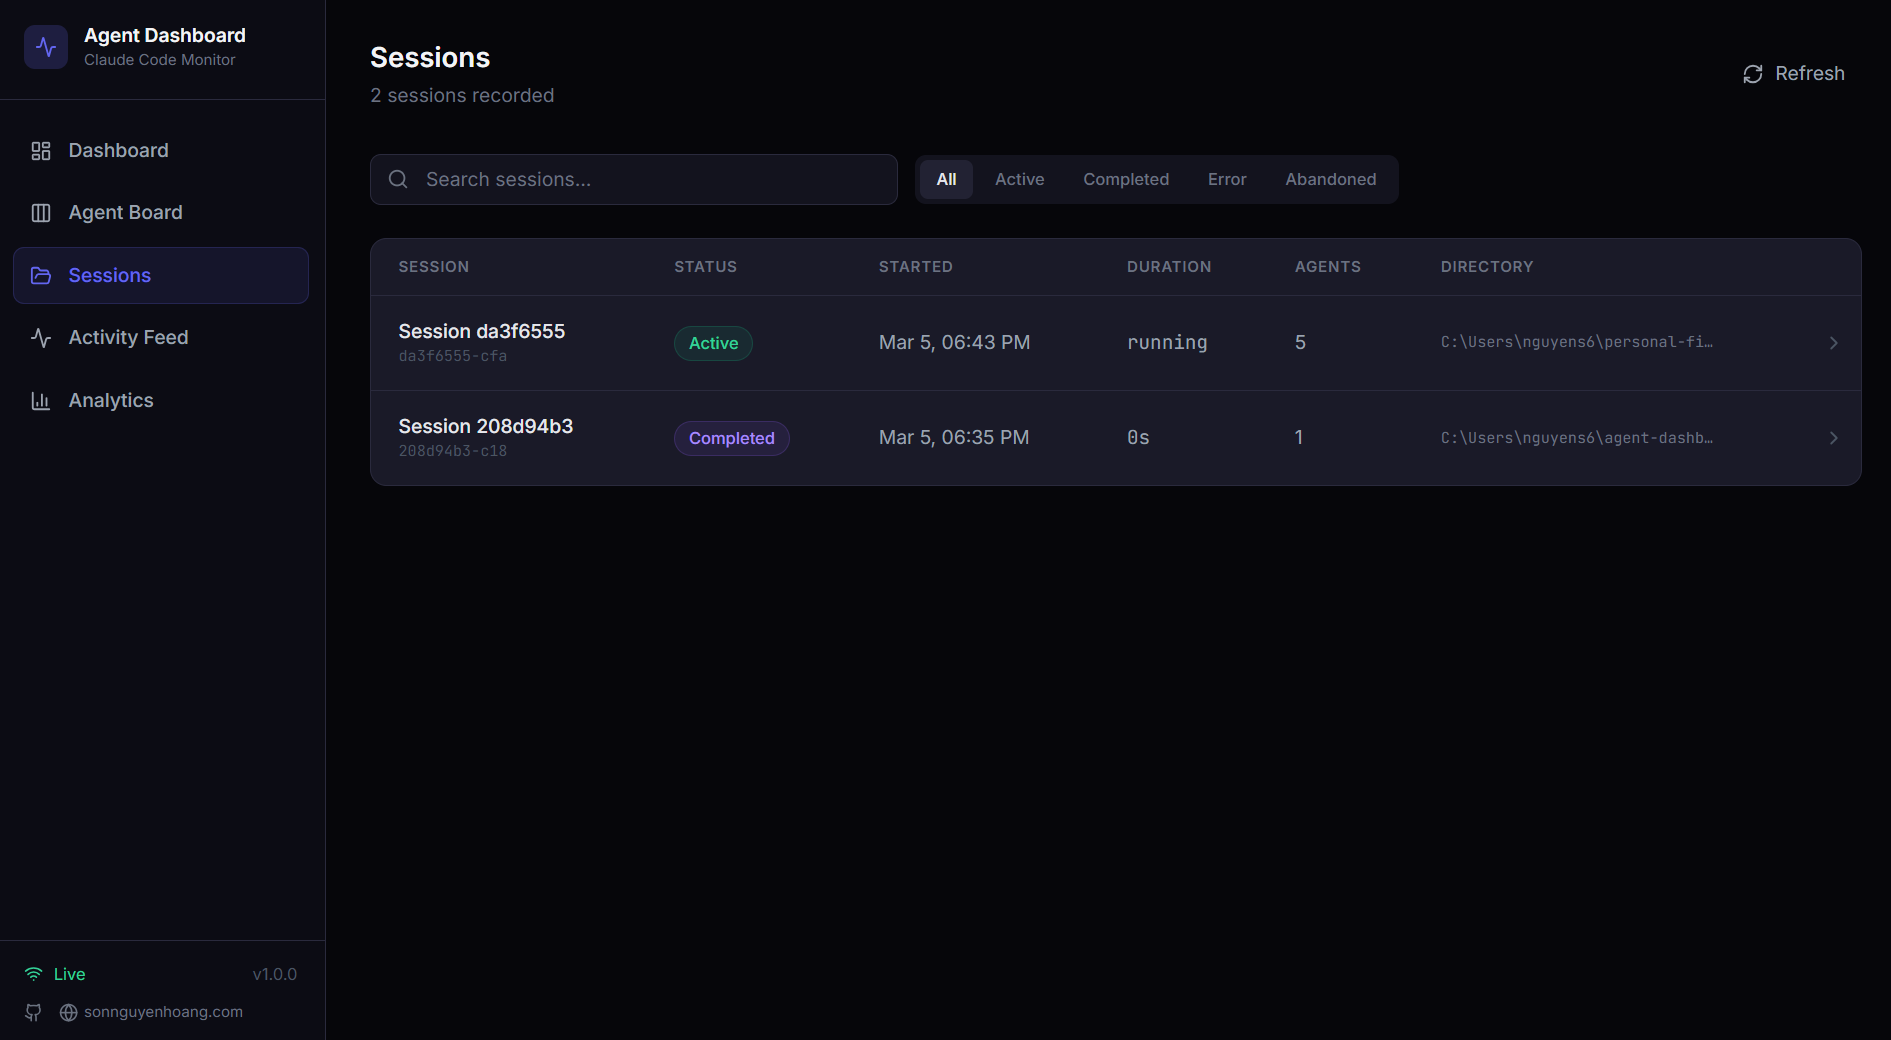
Sessions
Searchable, filterable, server-paginated table of recorded sessions
 ⤢
⤢
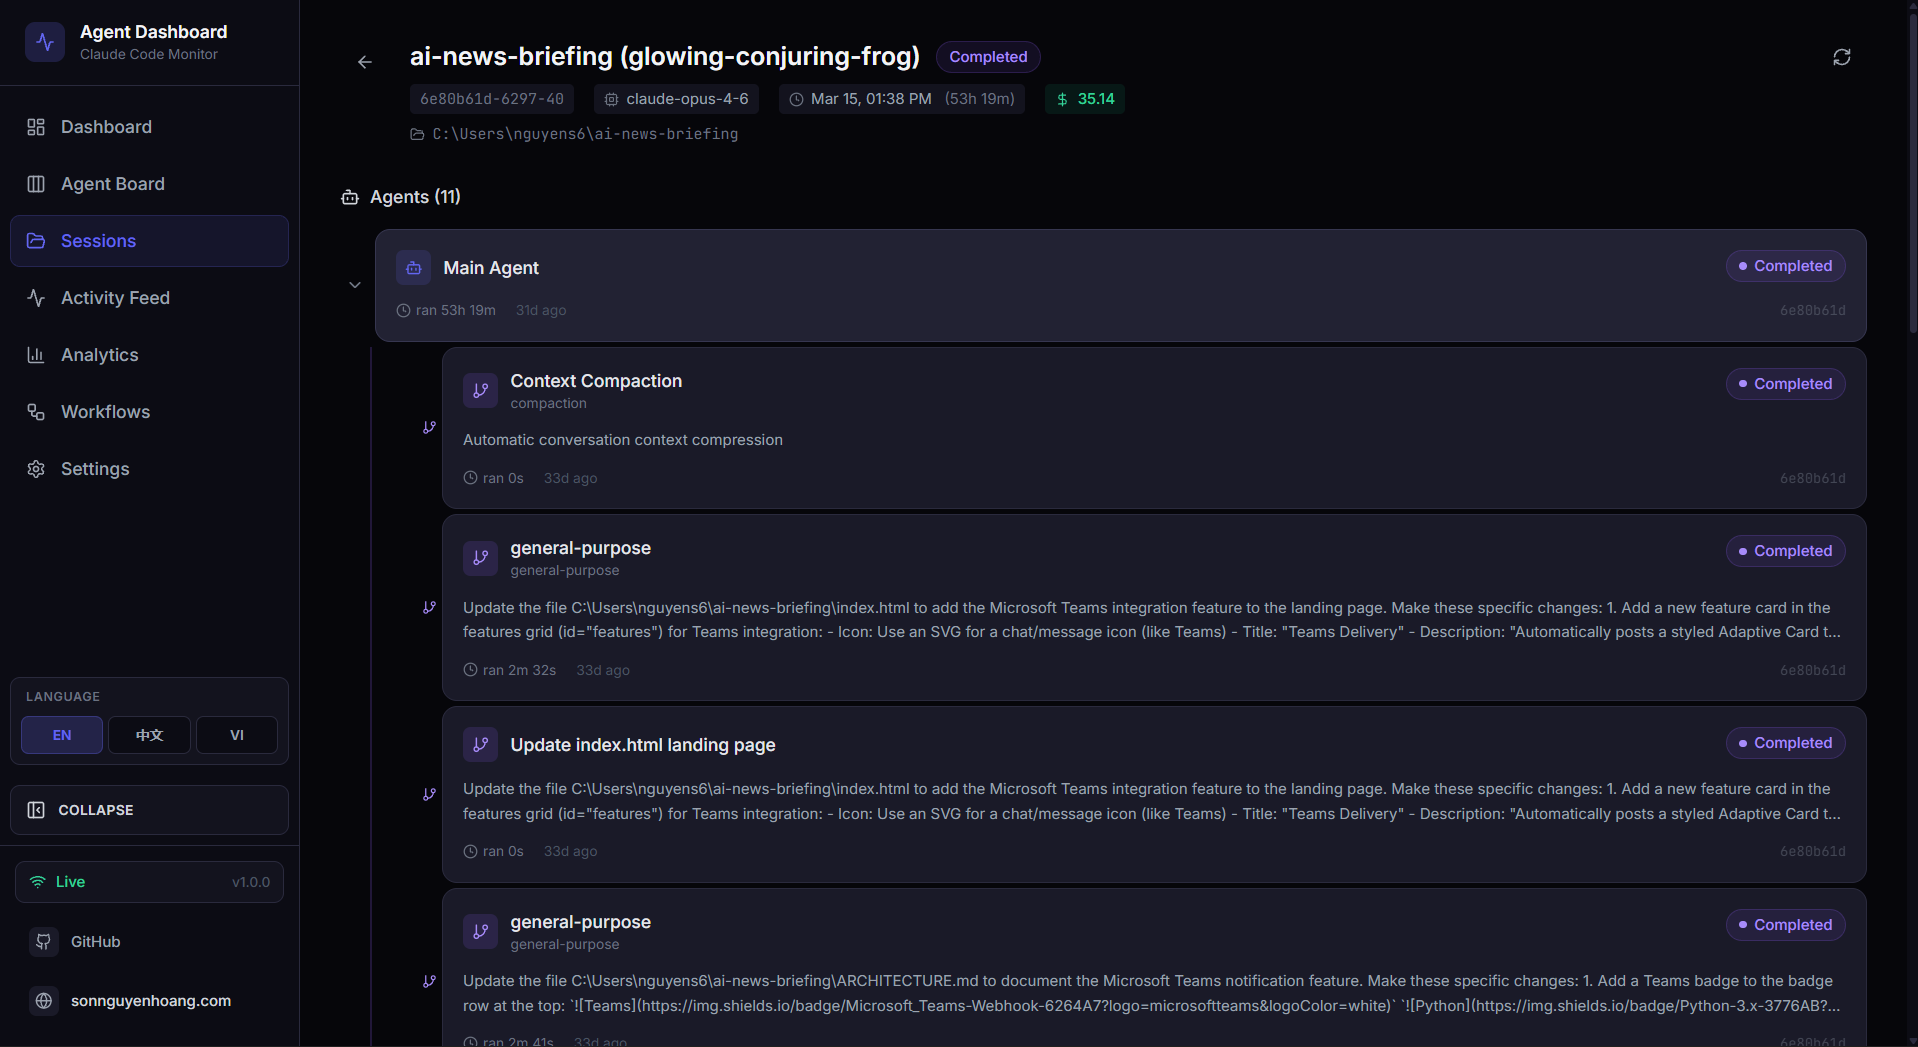
Session Detail
Full session overview with metadata, cost, model, and tool breakdown
 ⤢
⤢
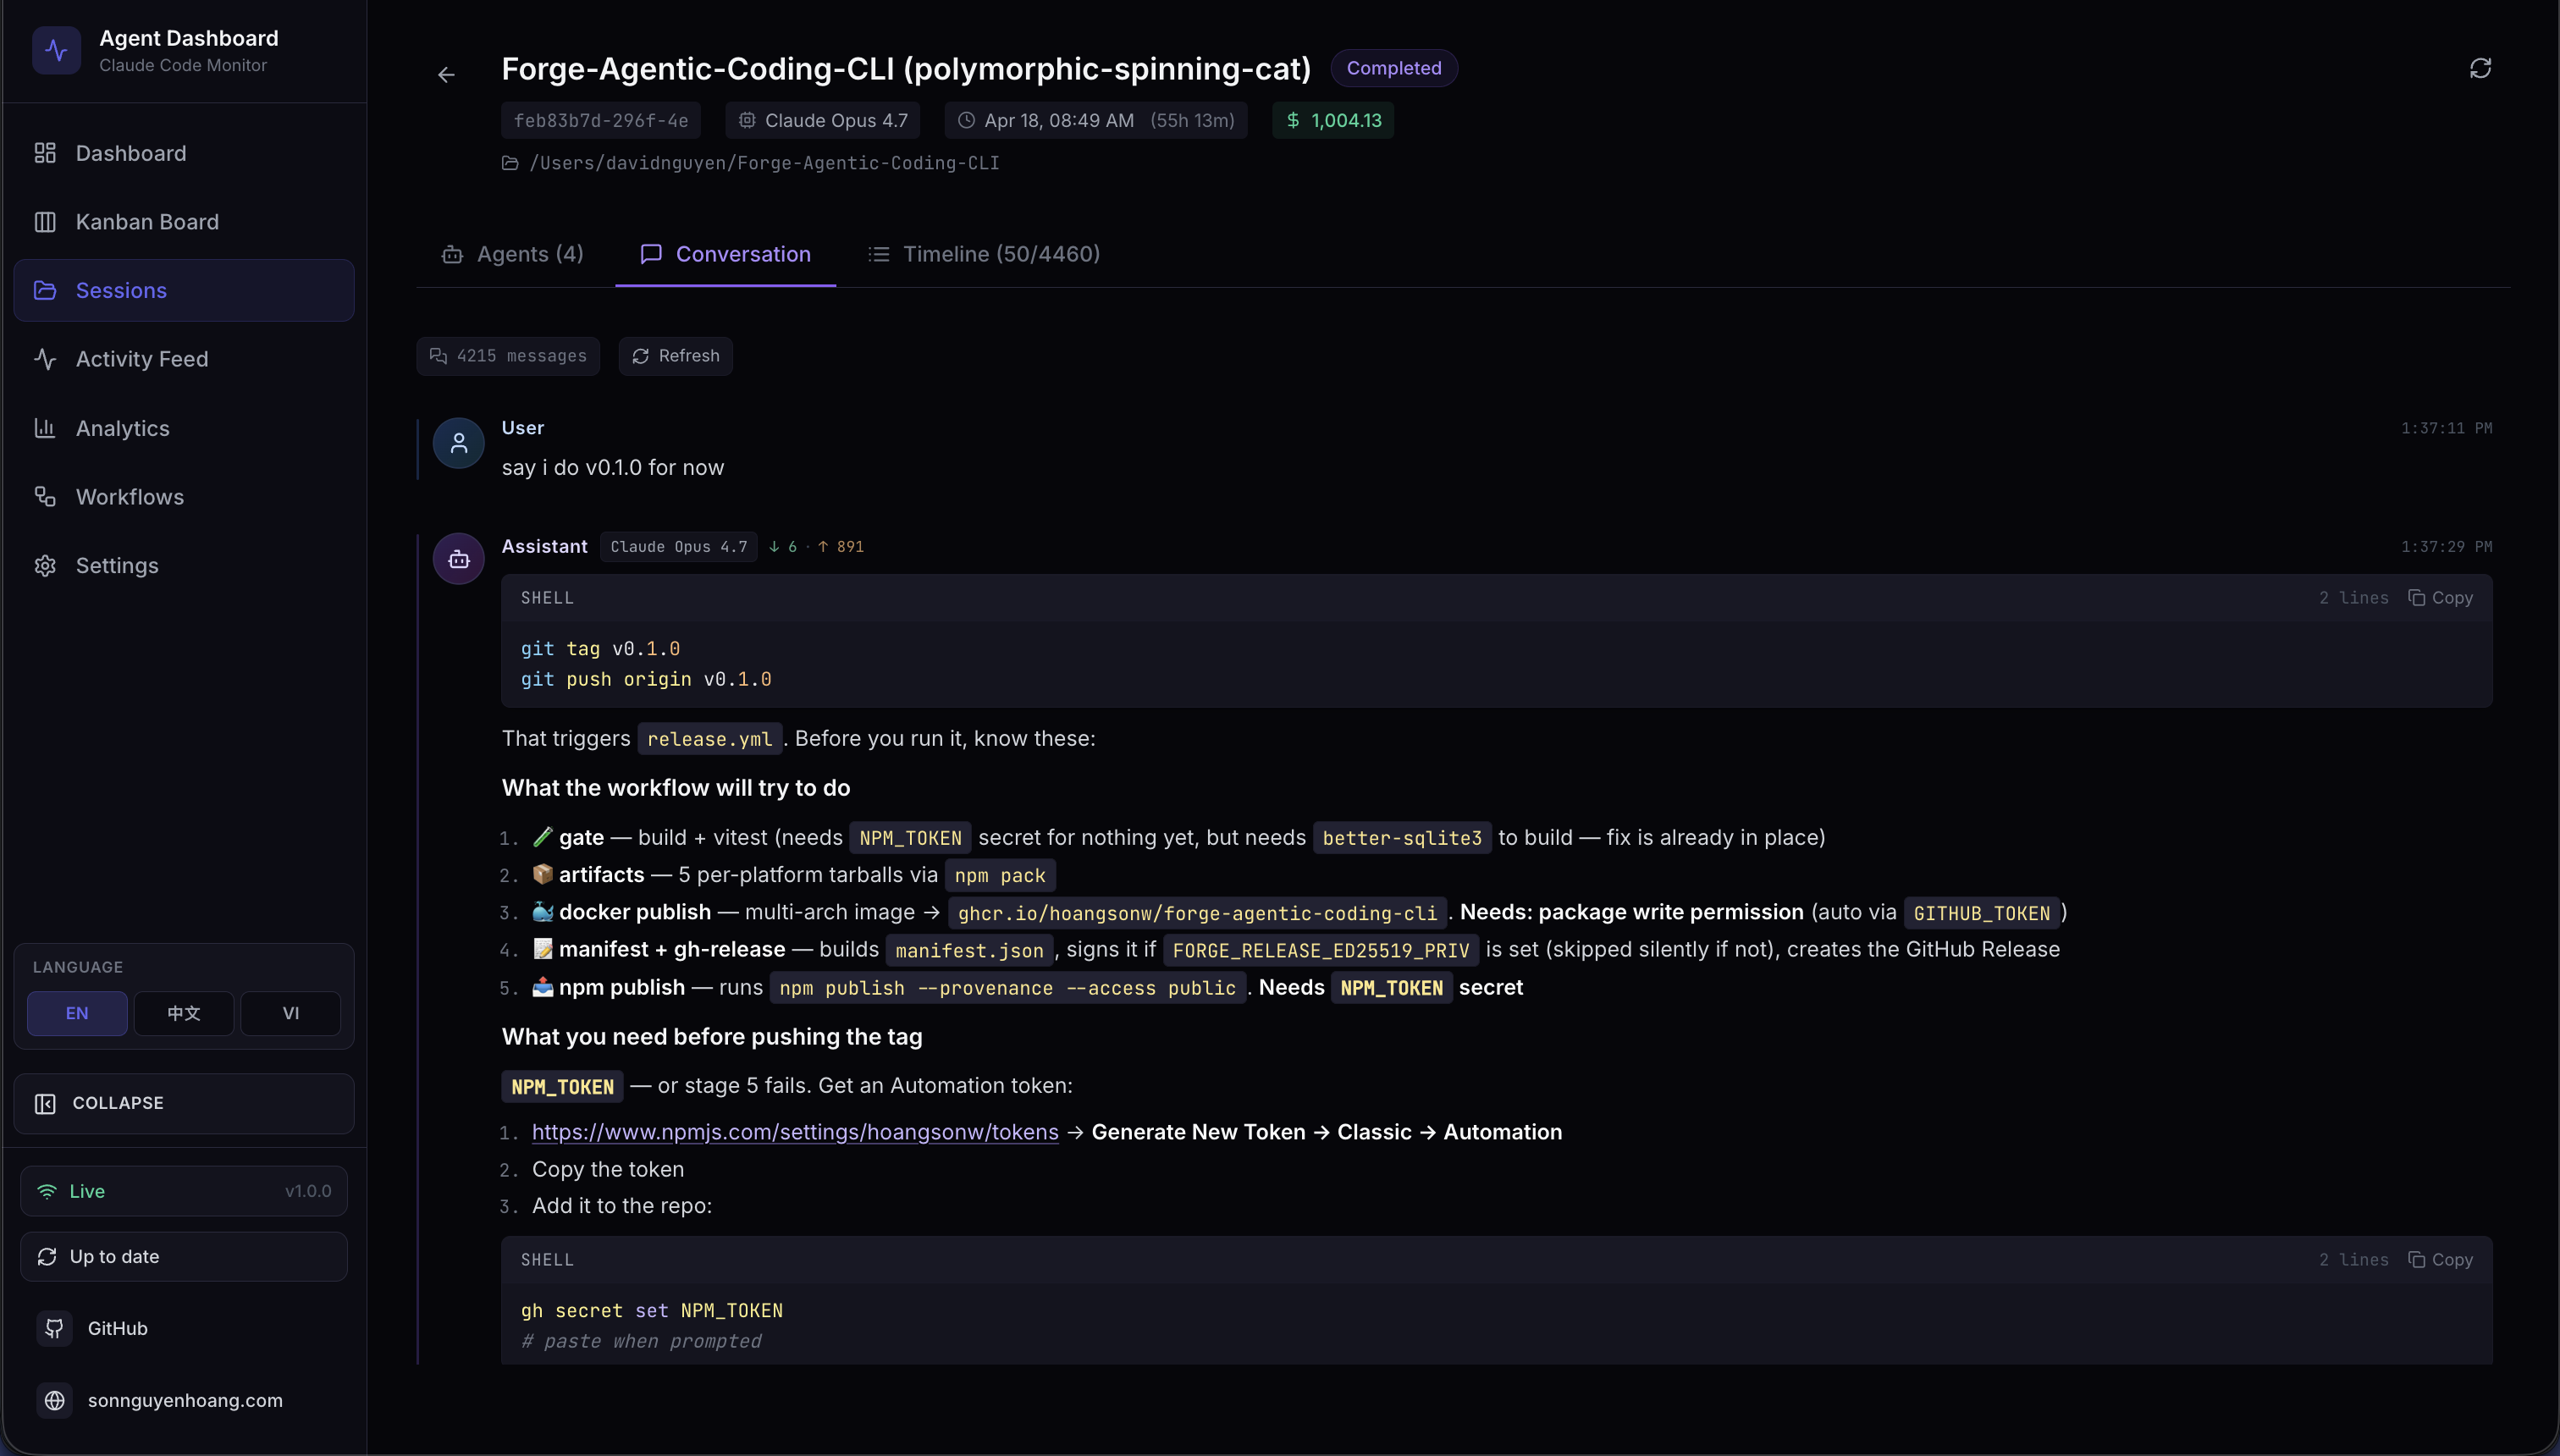
Session · Conversation
Live transcript with markdown, syntax-highlighted code, and styled tool calls
 ⤢
⤢
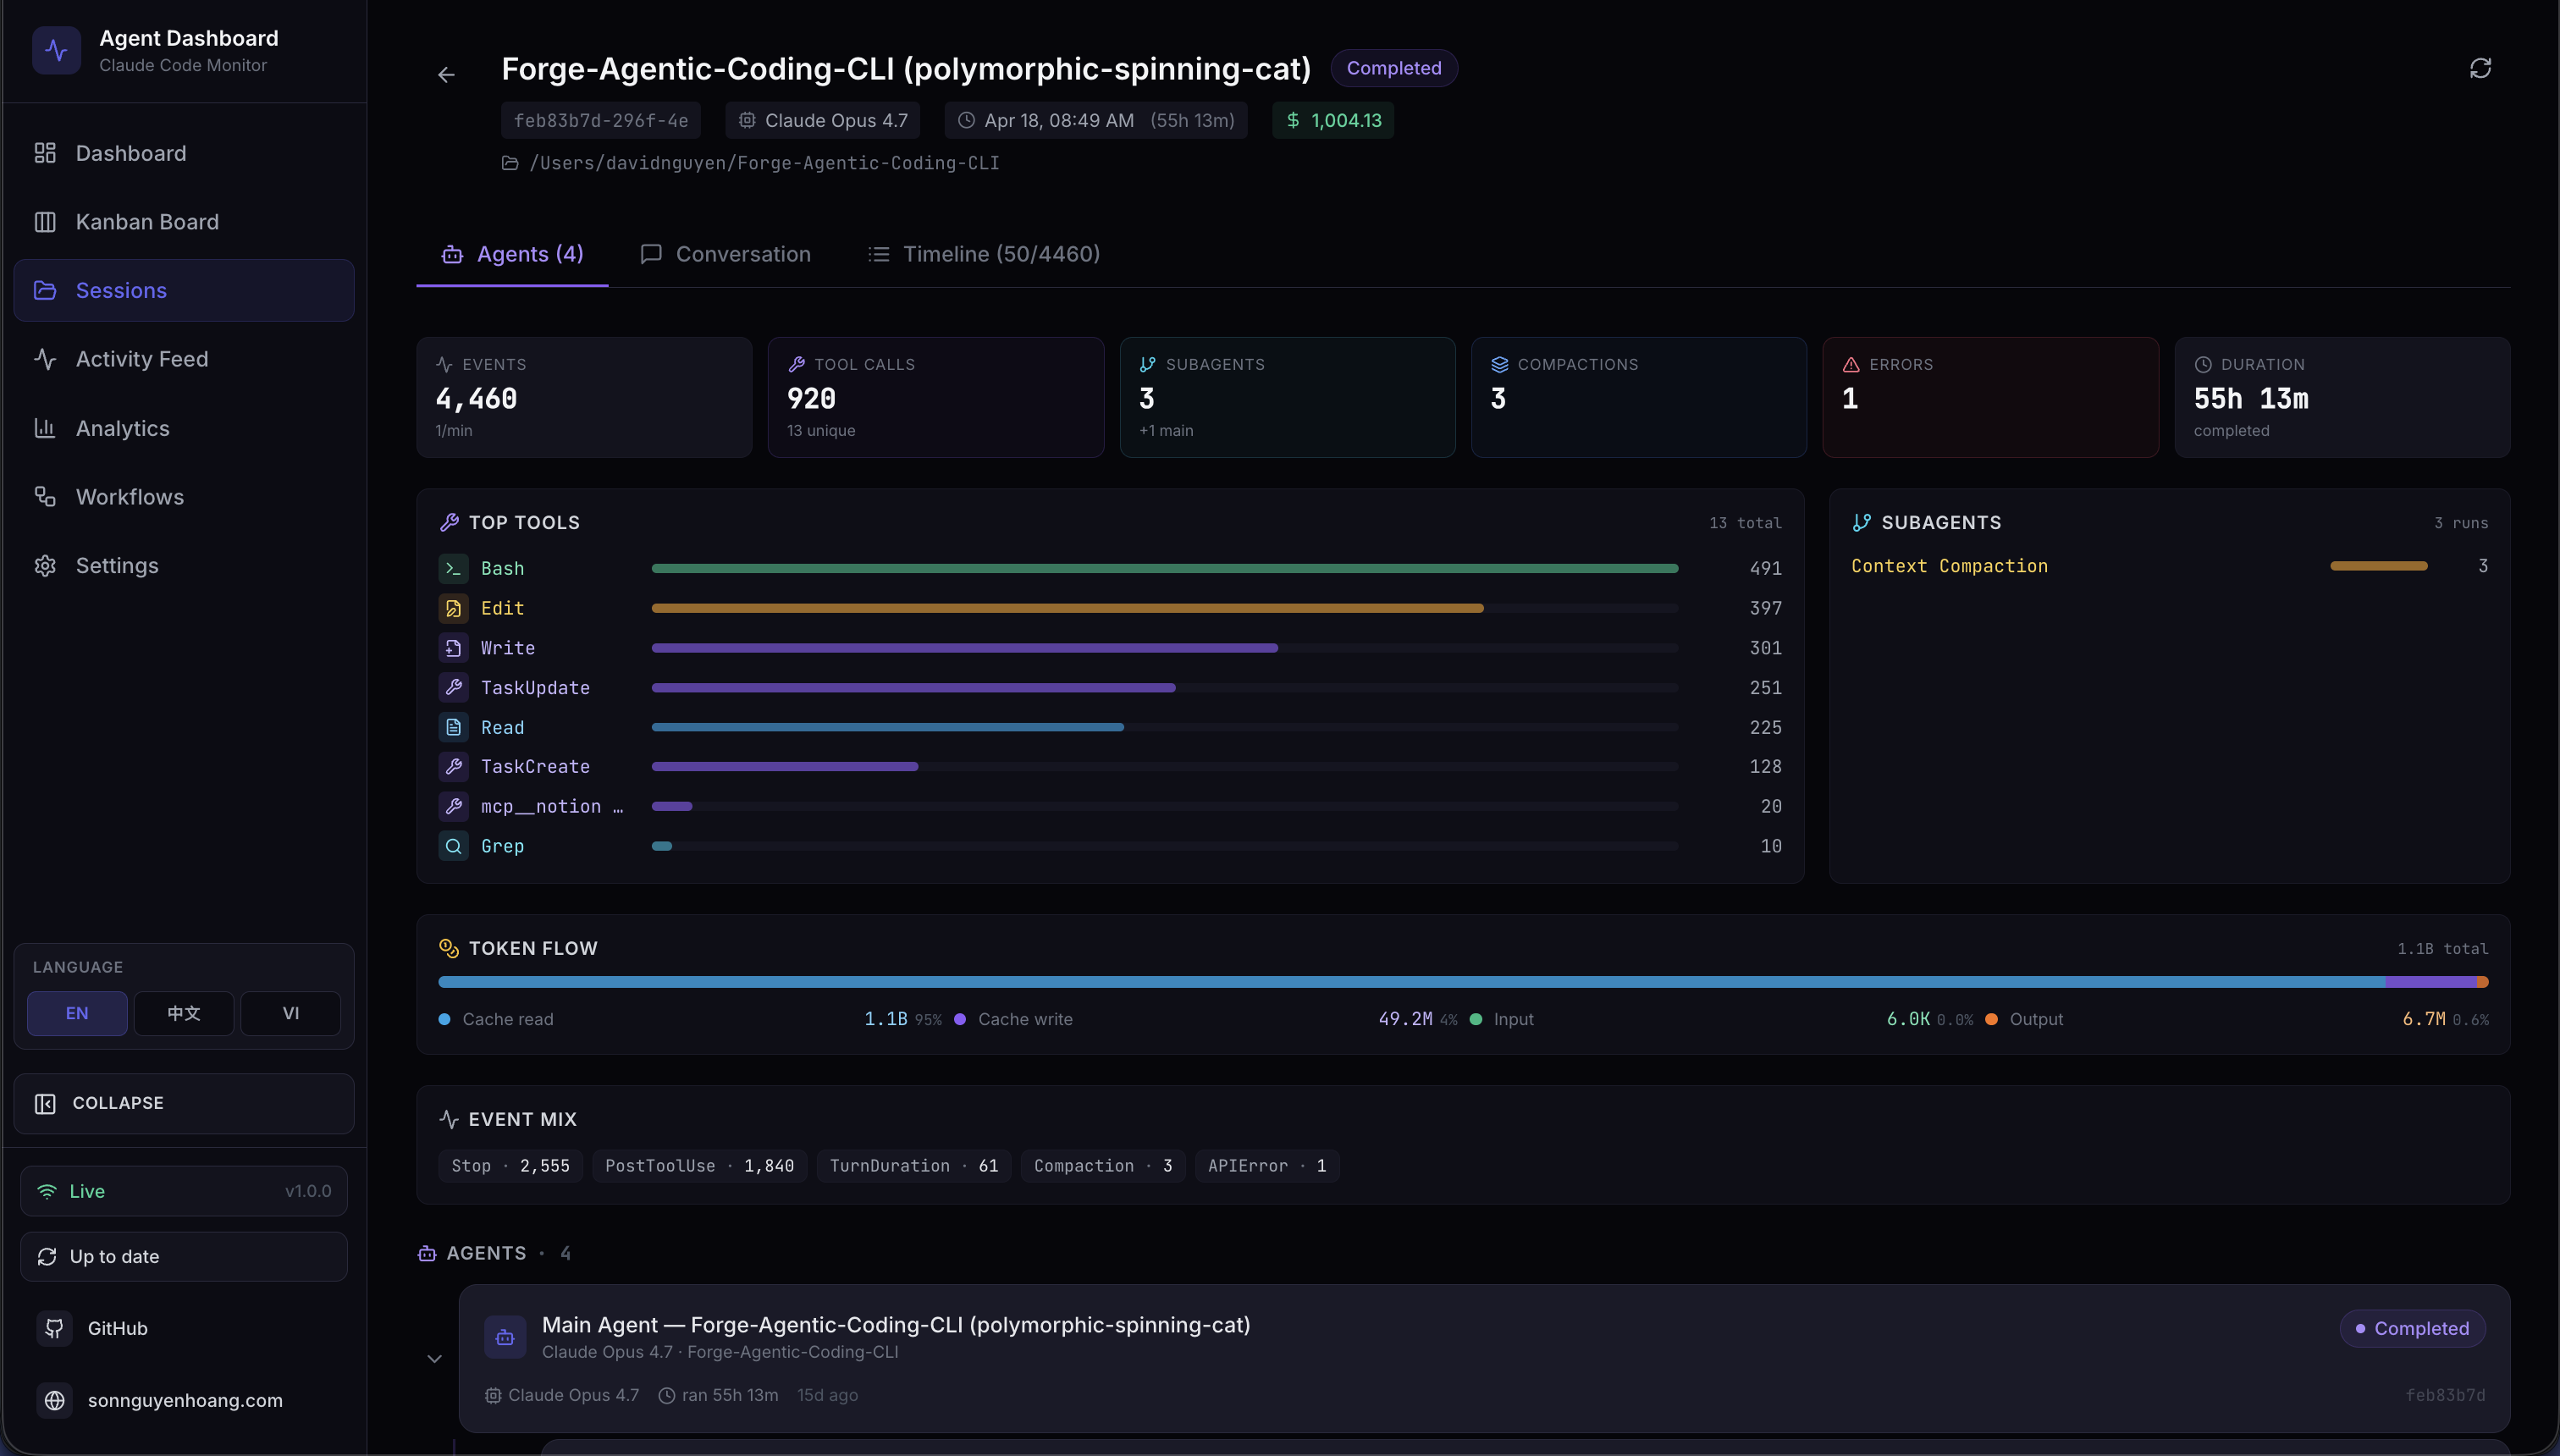
Session · Agents
Overview tiles, subagent breakdown, and hierarchy tree
 ⤢
⤢
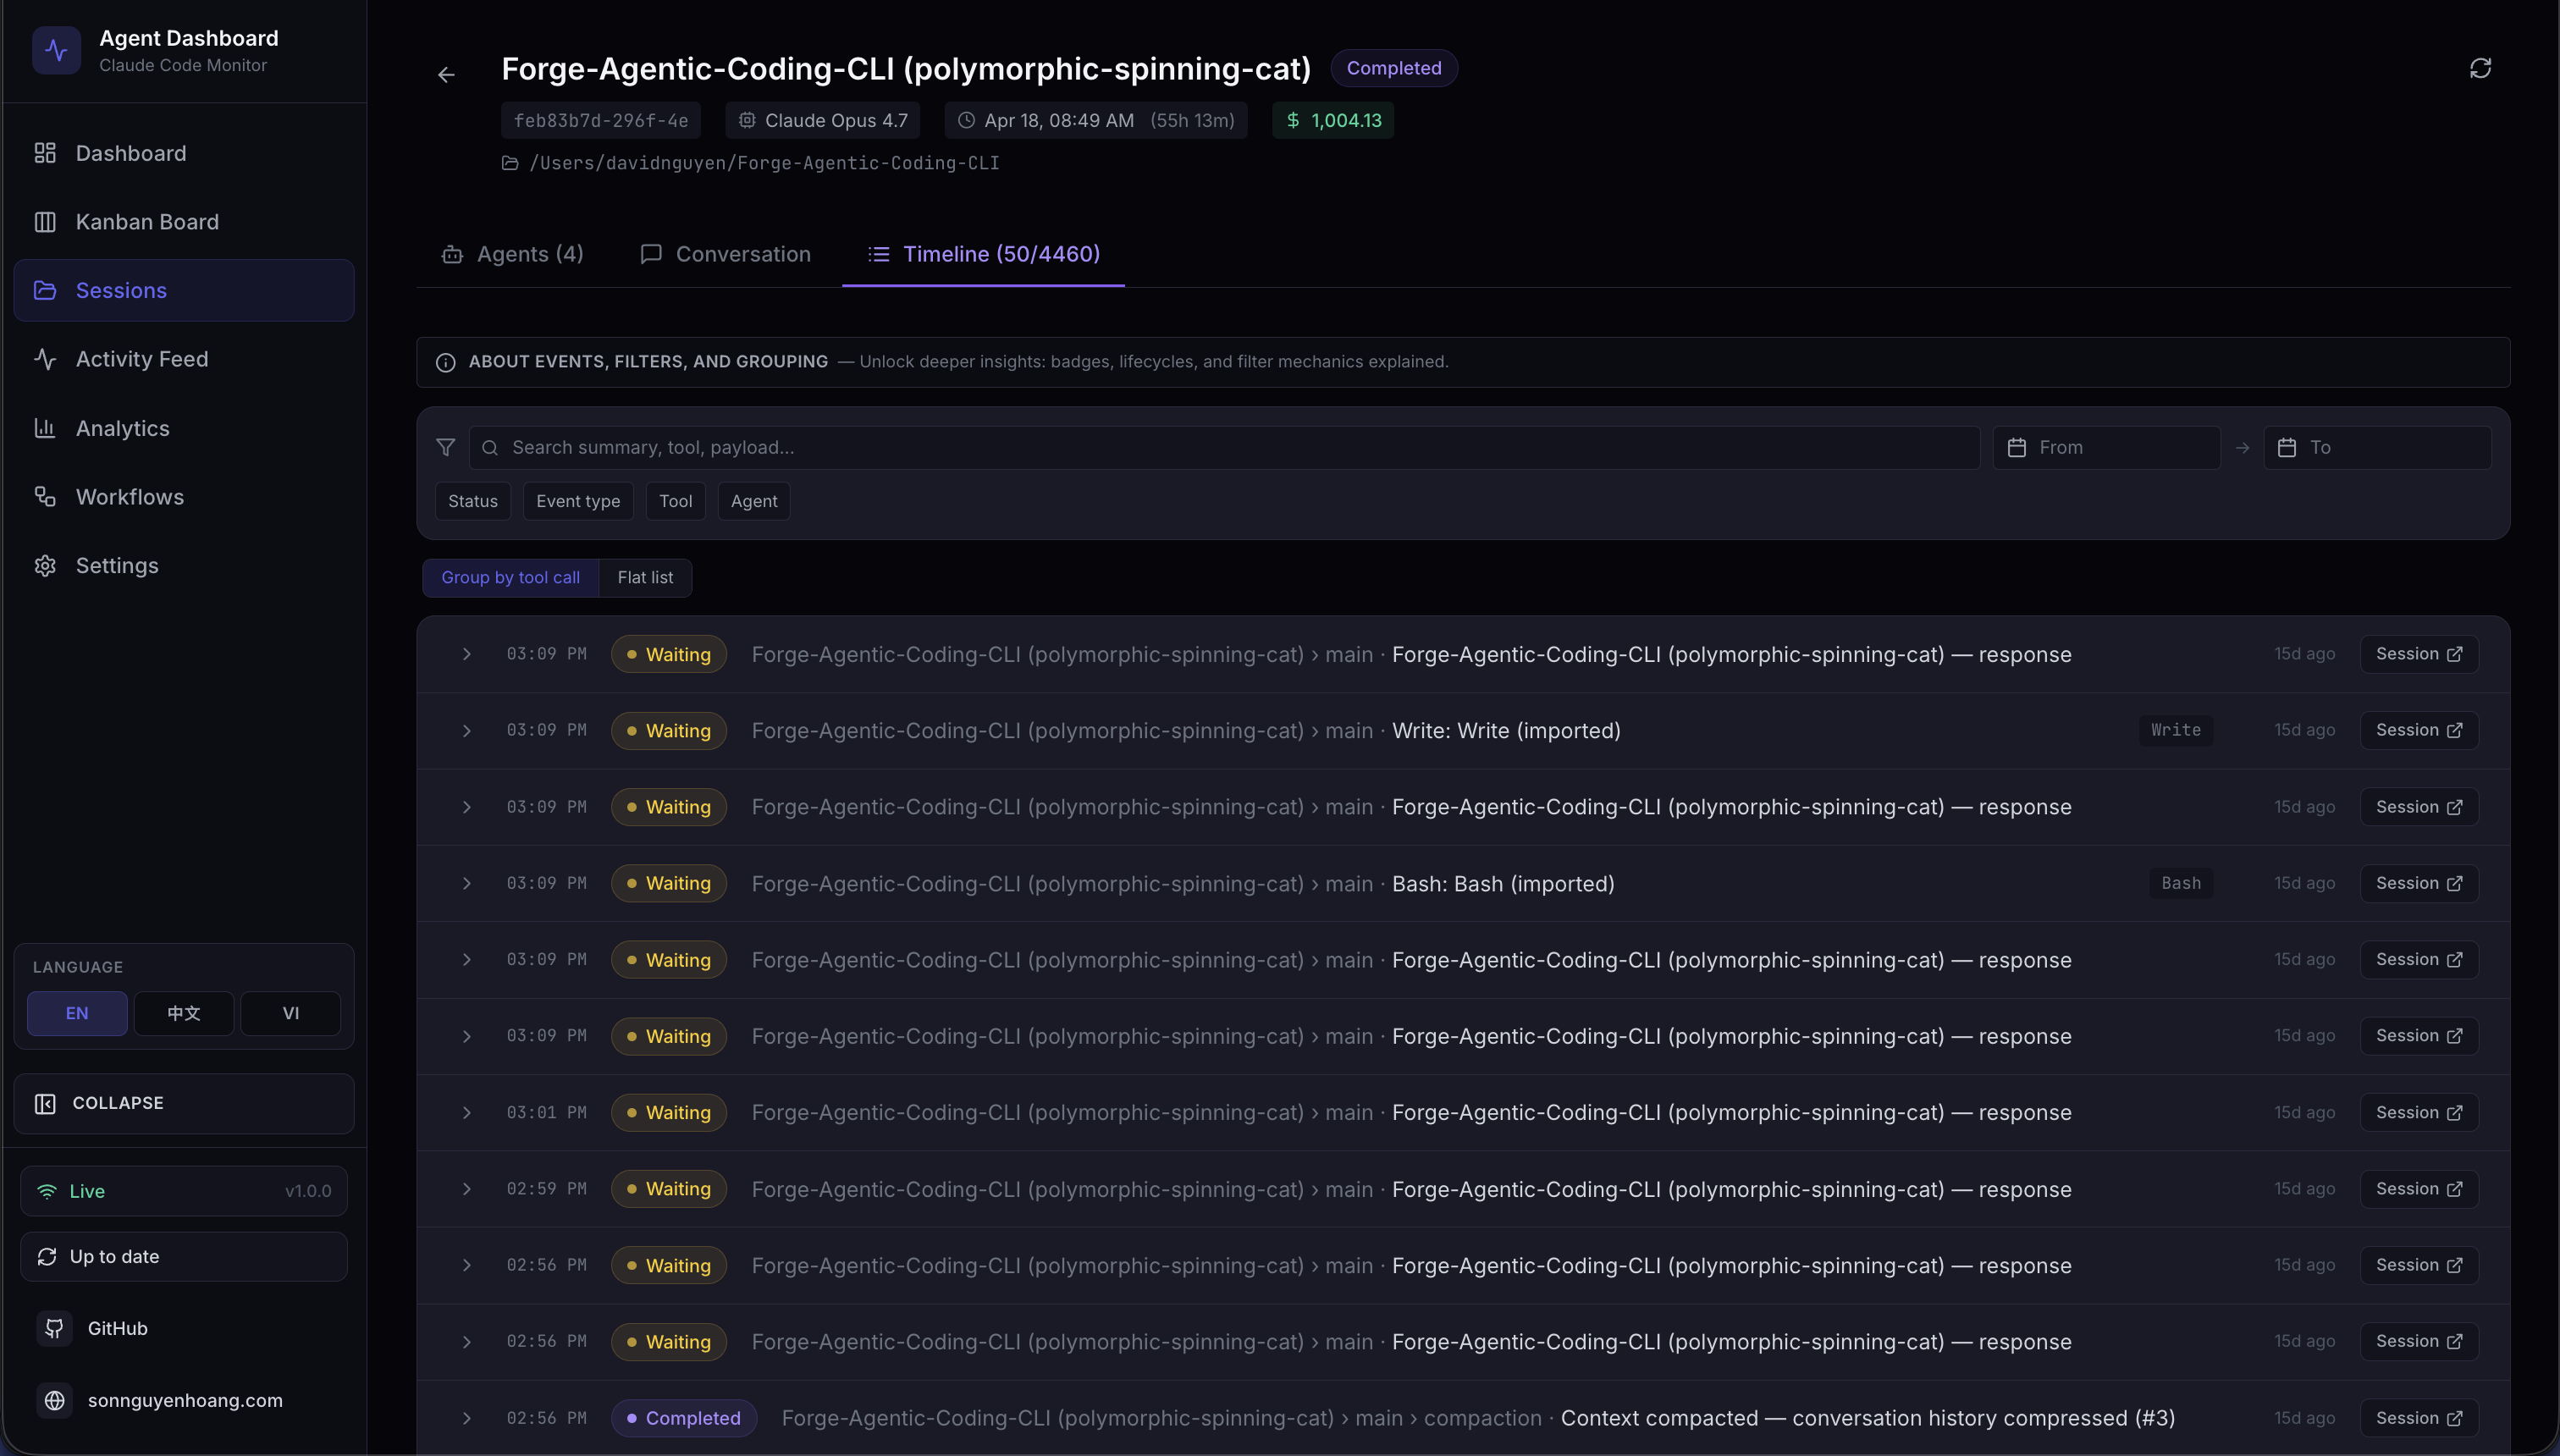
Session · Timeline
Chronological event timeline with multi-dimension filters
 ⤢
⤢
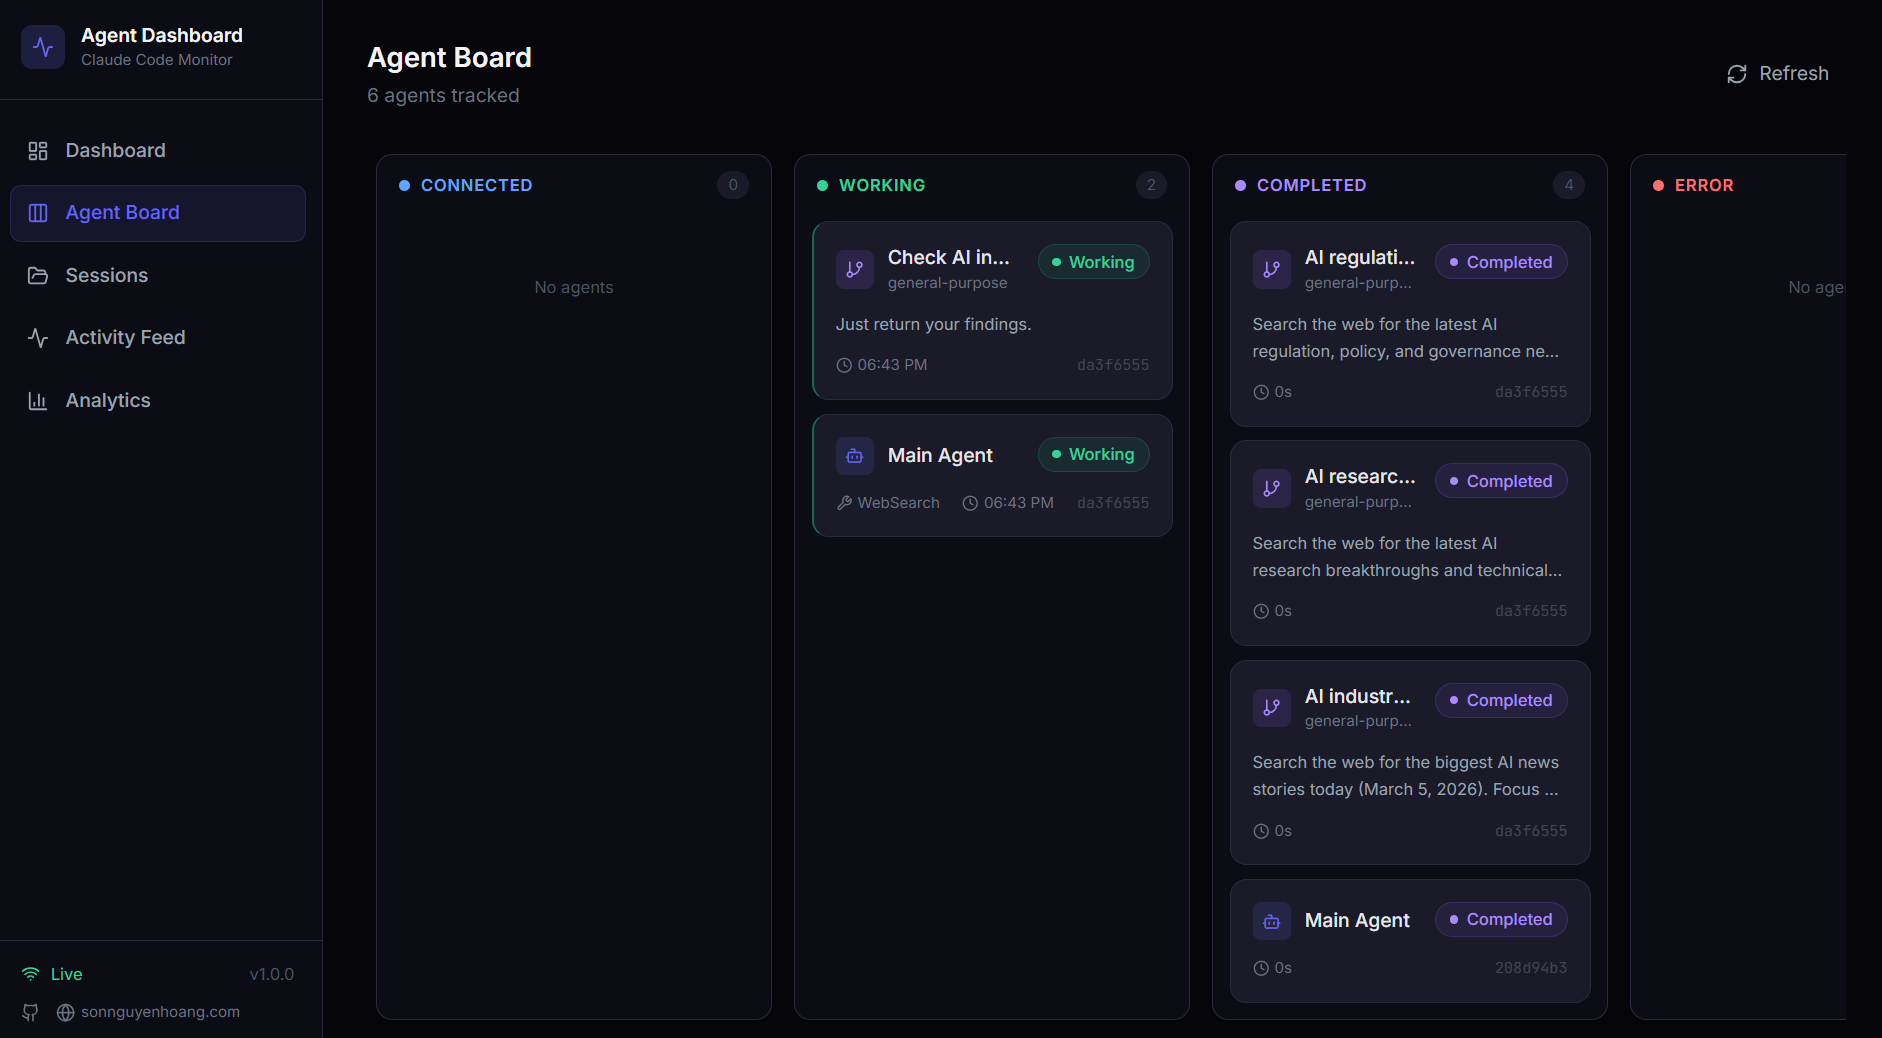
Kanban Board · Agents
Working / Waiting / Completed / Error columns with live WebSocket updates
 ⤢
⤢
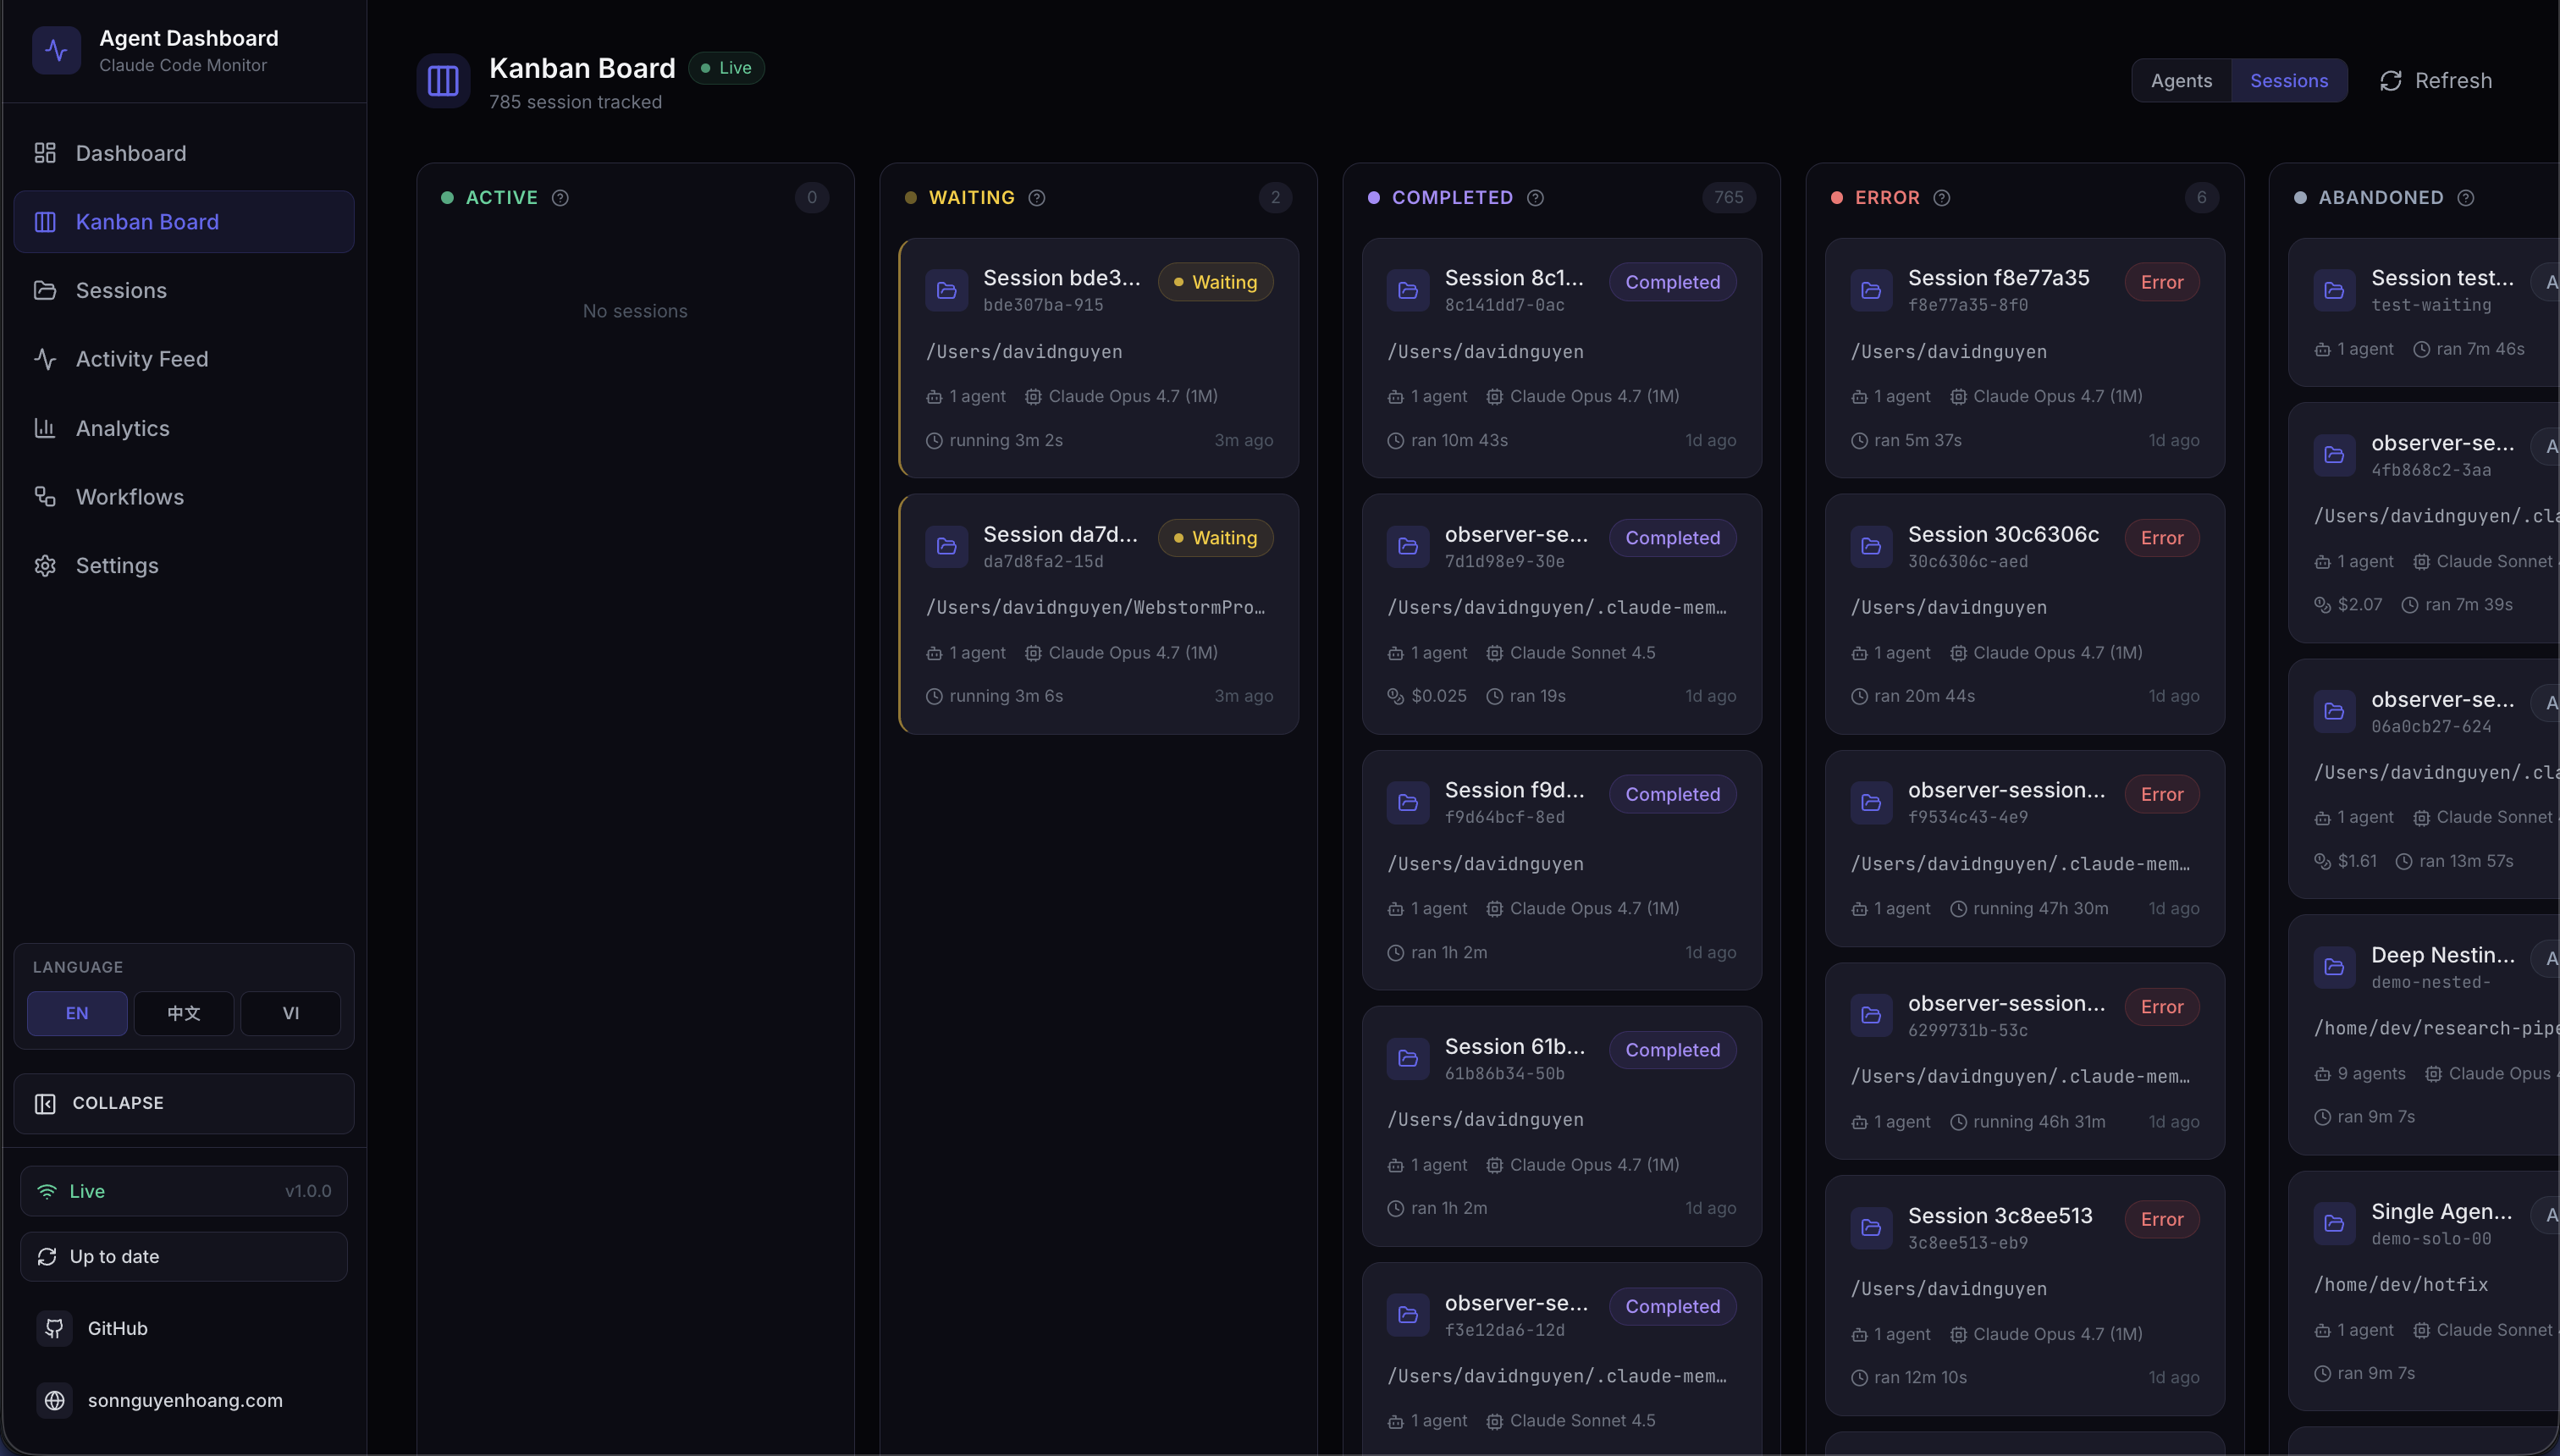
Kanban Board · Sessions
Sessions grouped by status across 5 columns
 ⤢
⤢
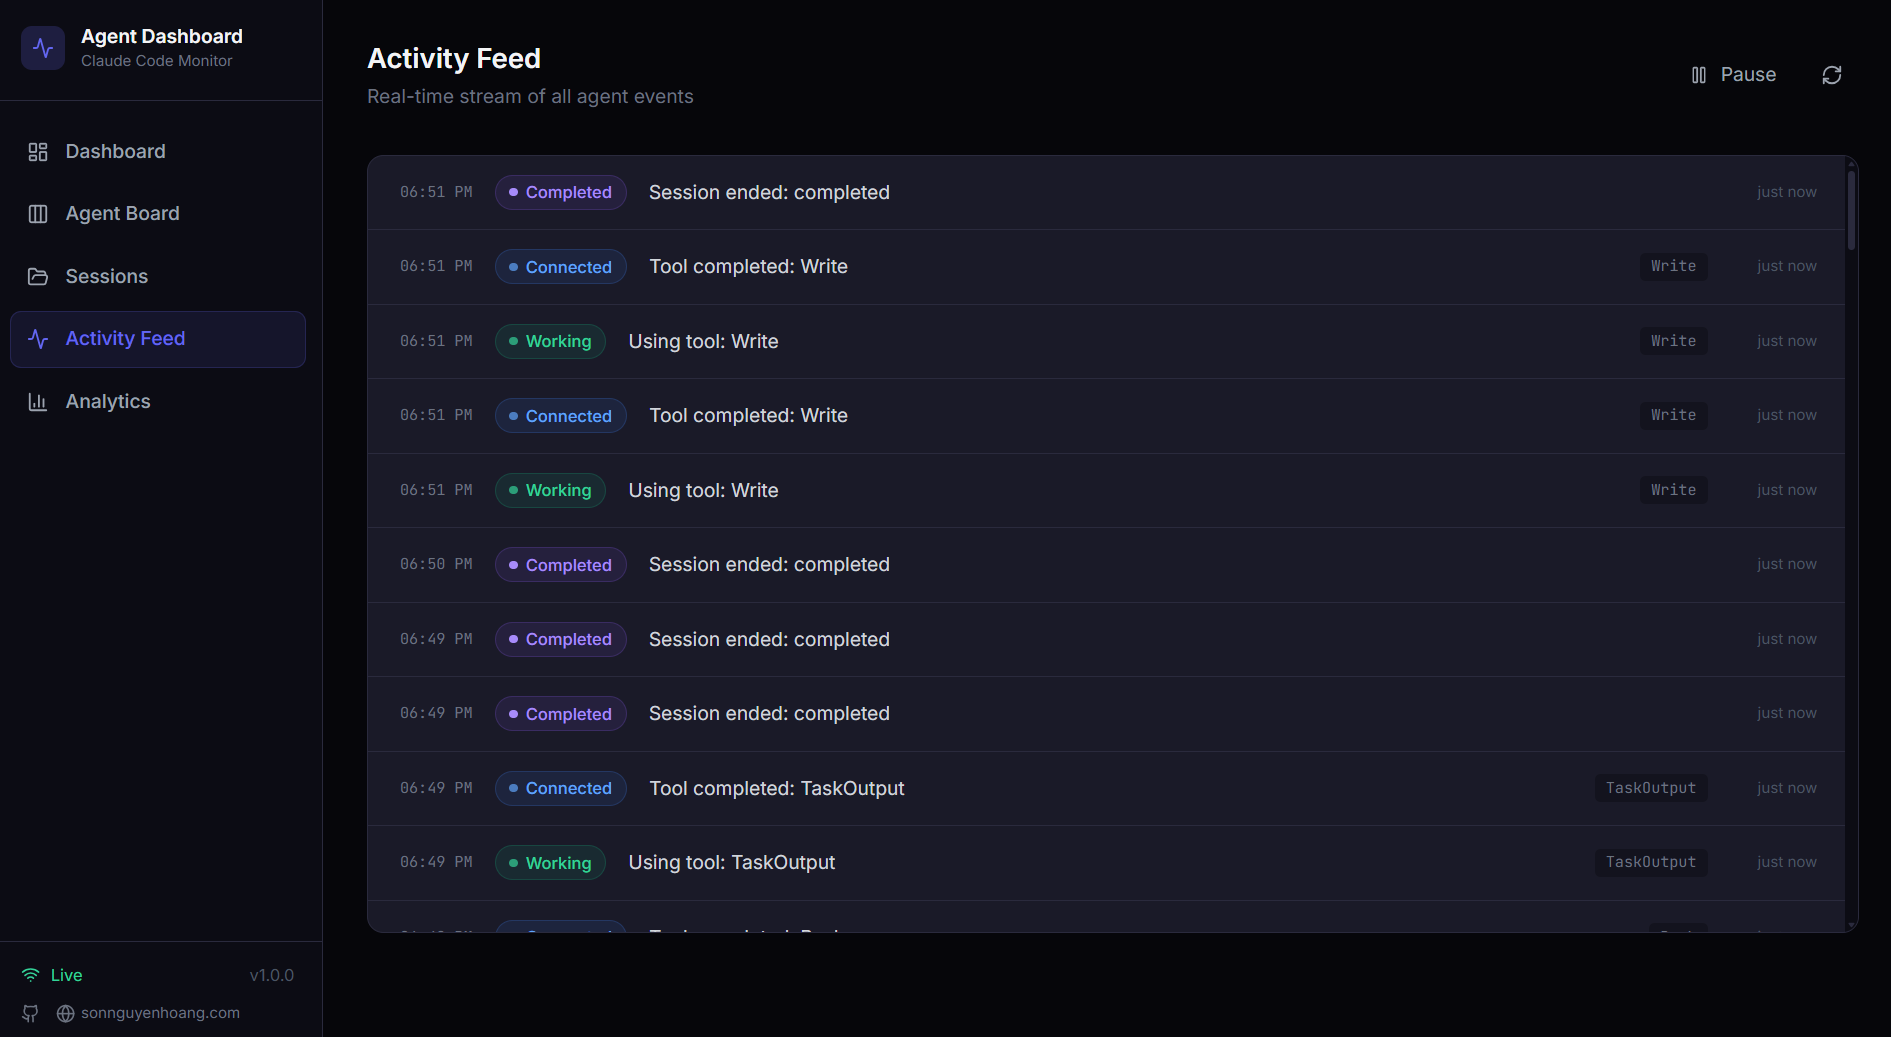
Activity Feed
Real-time event log with pause/resume and multi-dimension filters
 ⤢
⤢
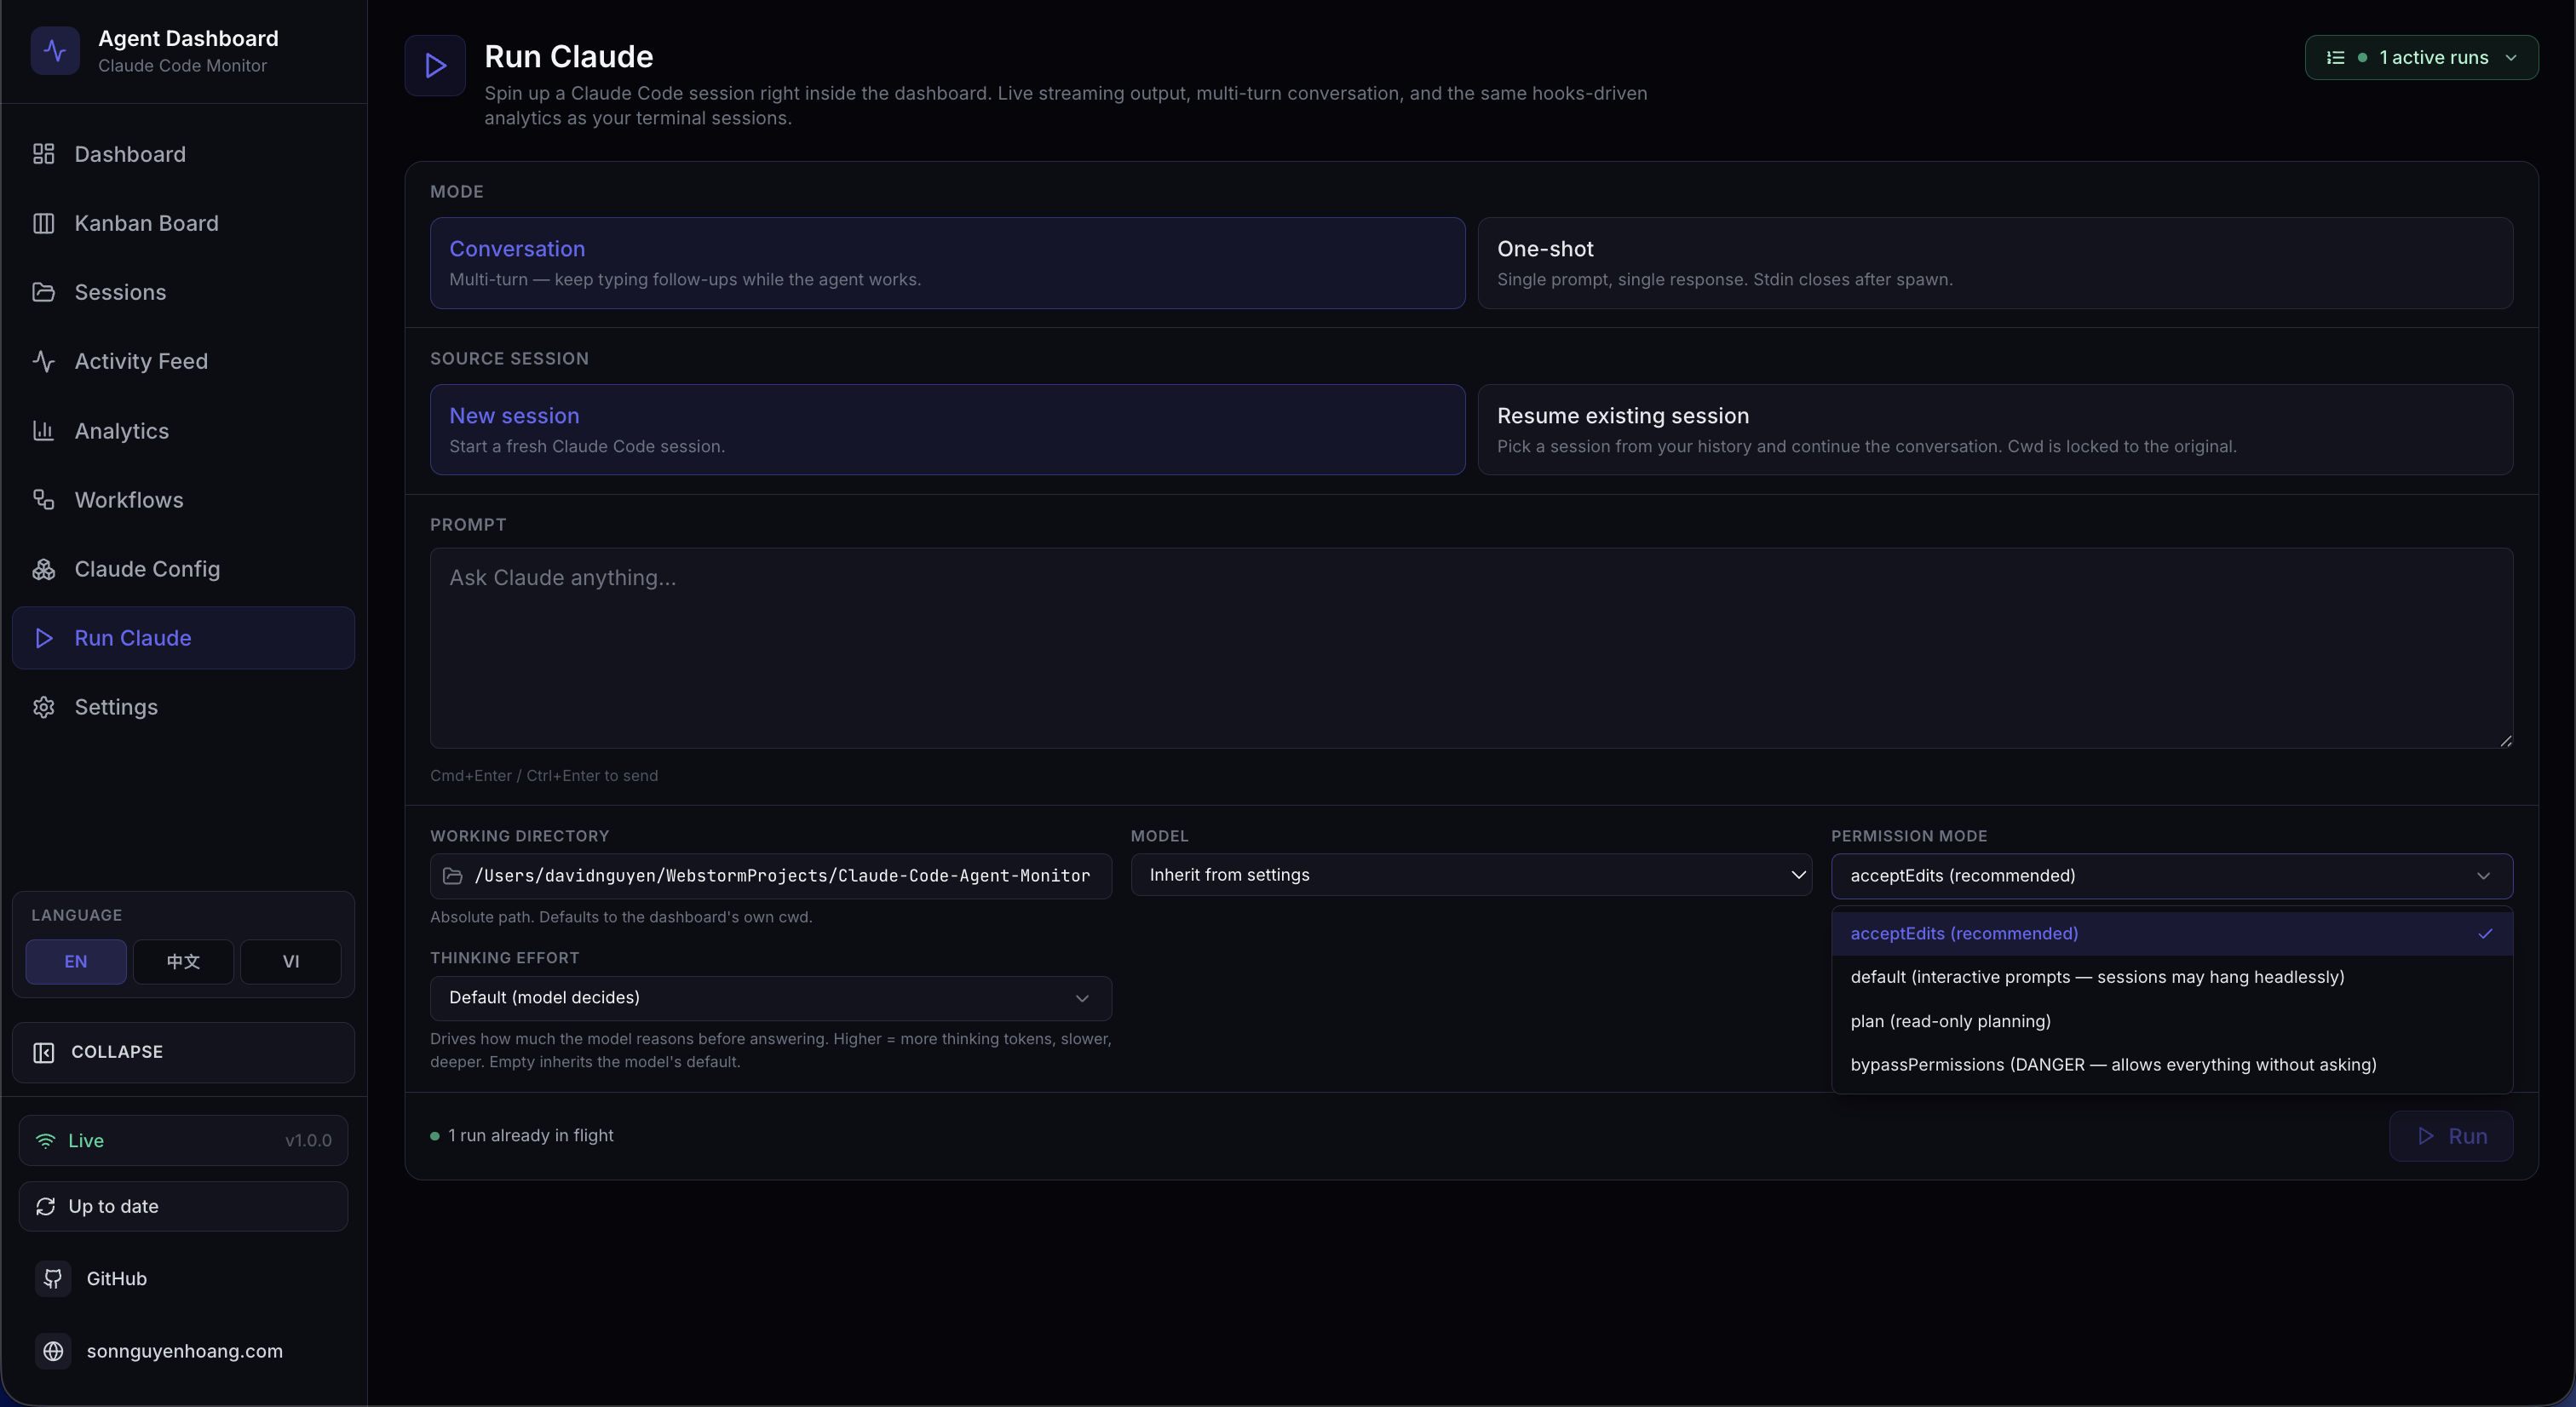
Run Claude · Config
Pick mode, source, cwd, model, permissions, and thinking effort
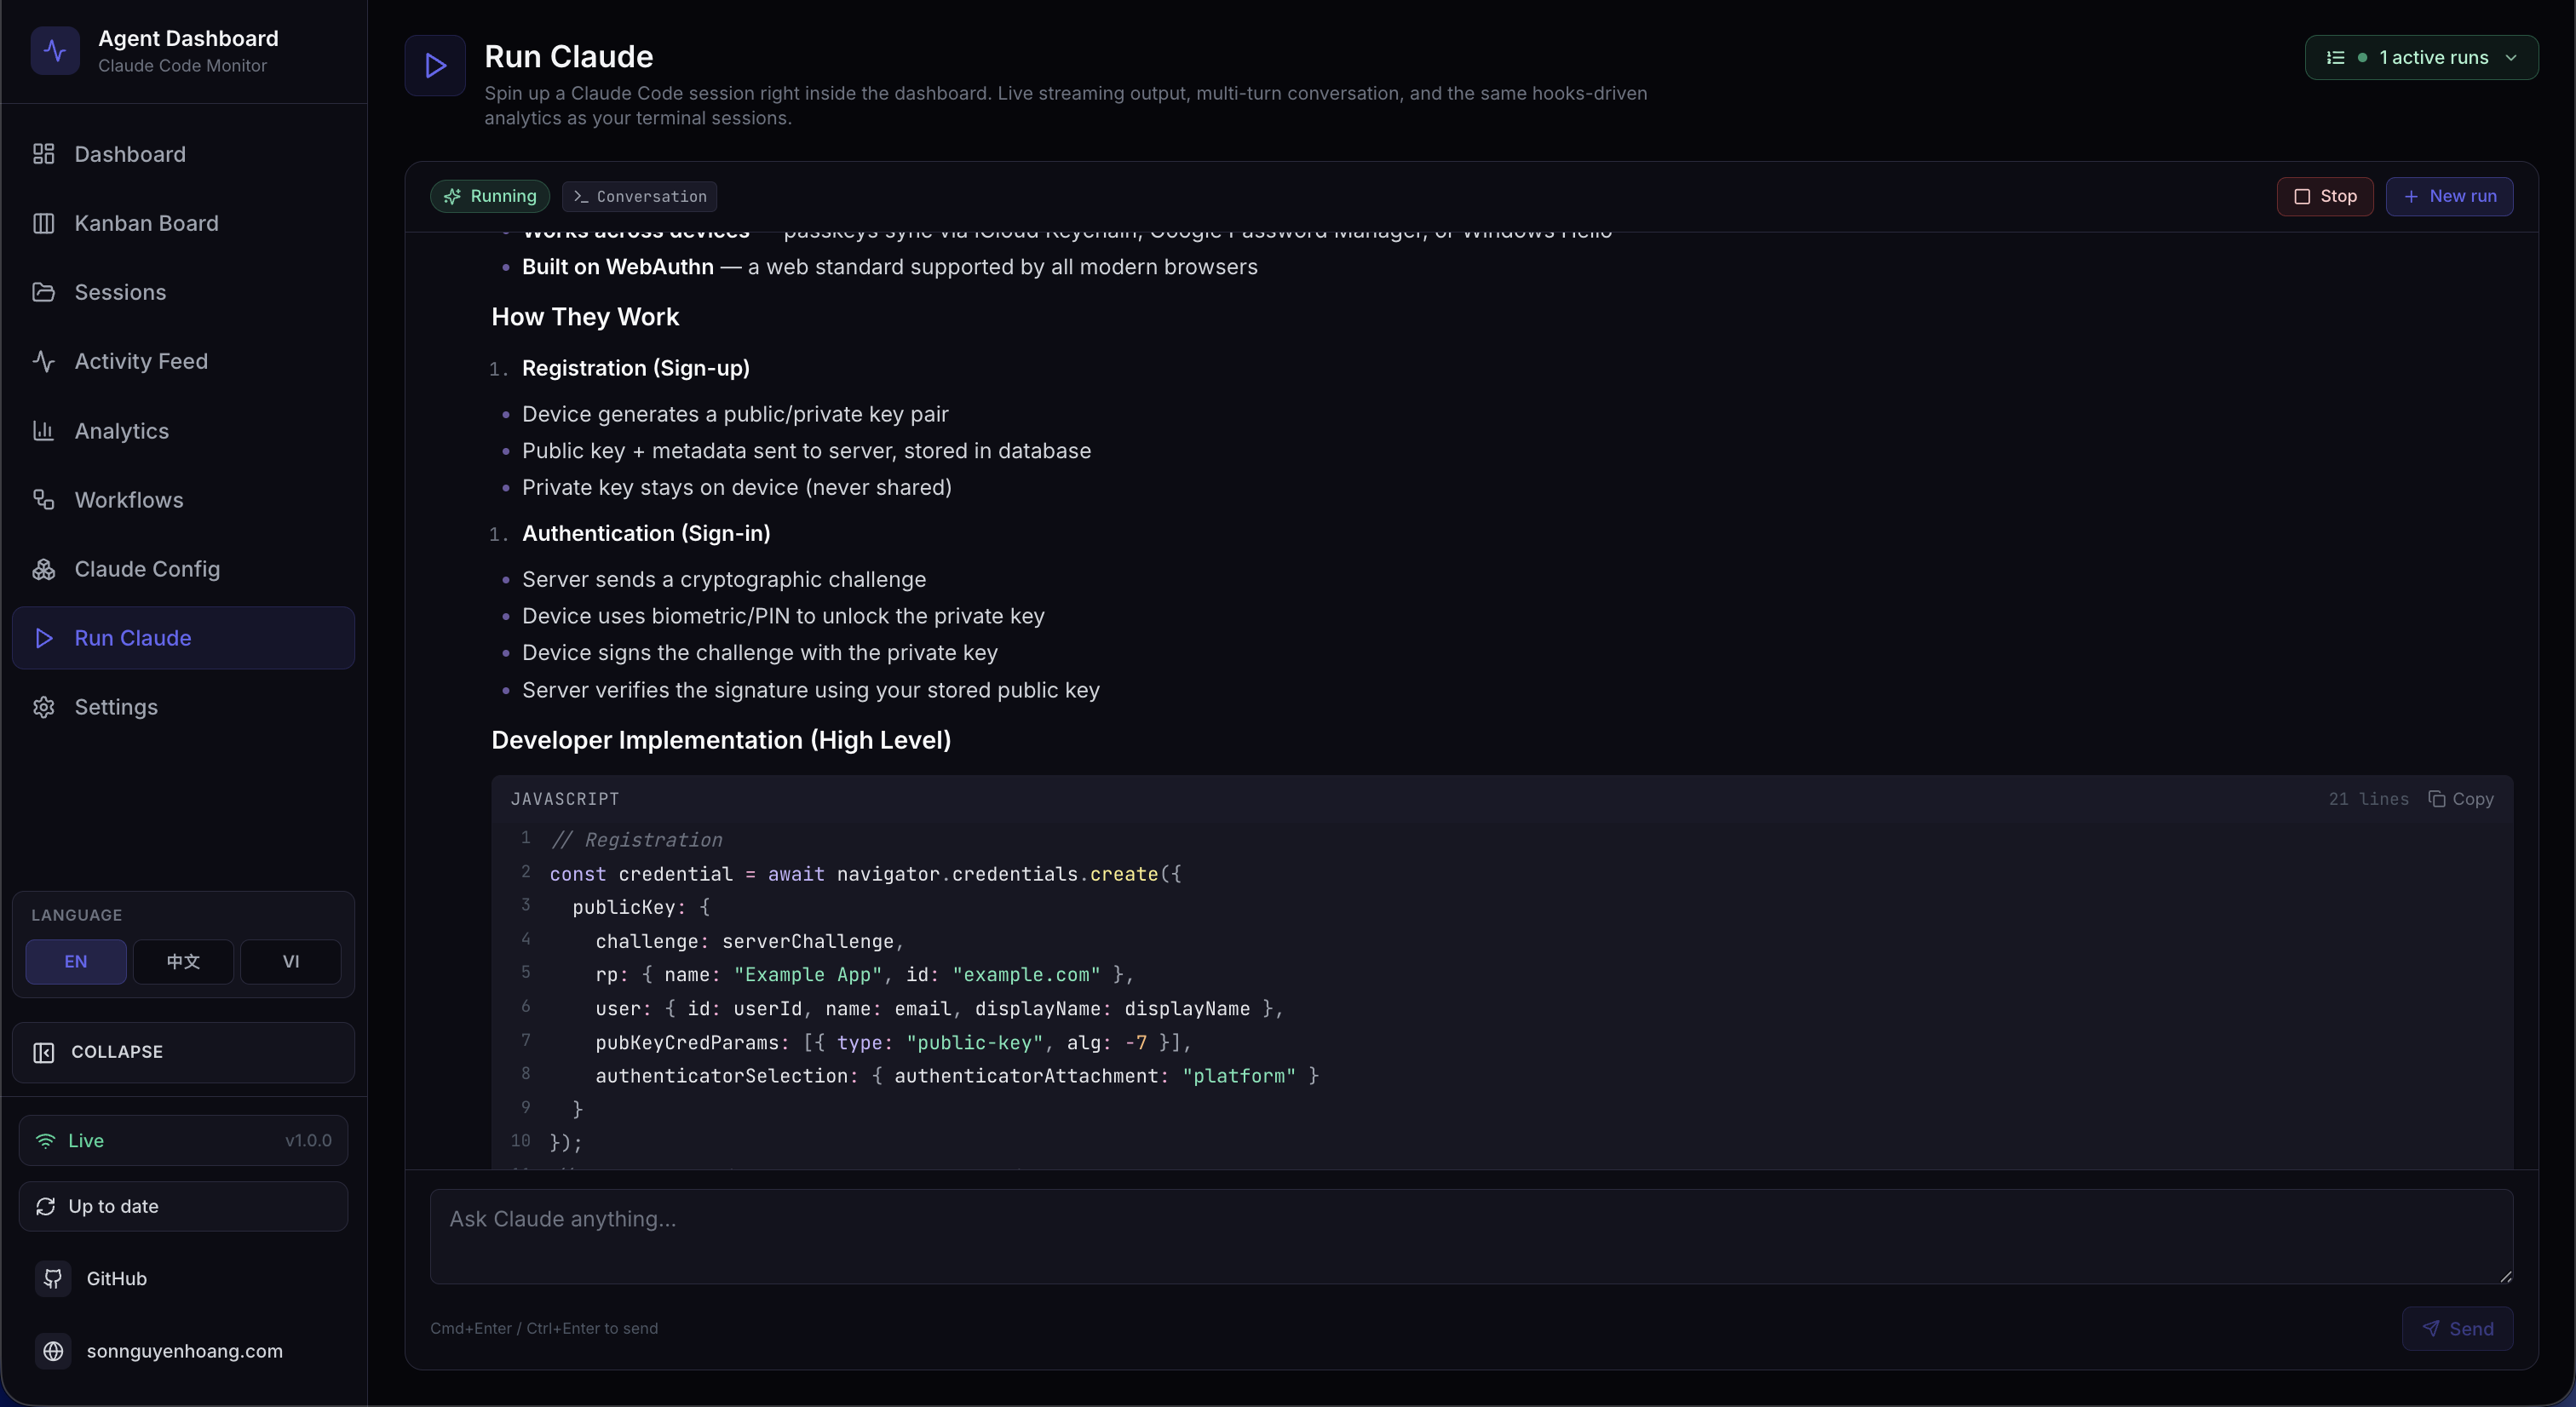 ⤢
⤢
Run Claude · Live Stream
Character-by-character streaming with collapsible tool calls and thinking blocks
 ⤢
⤢
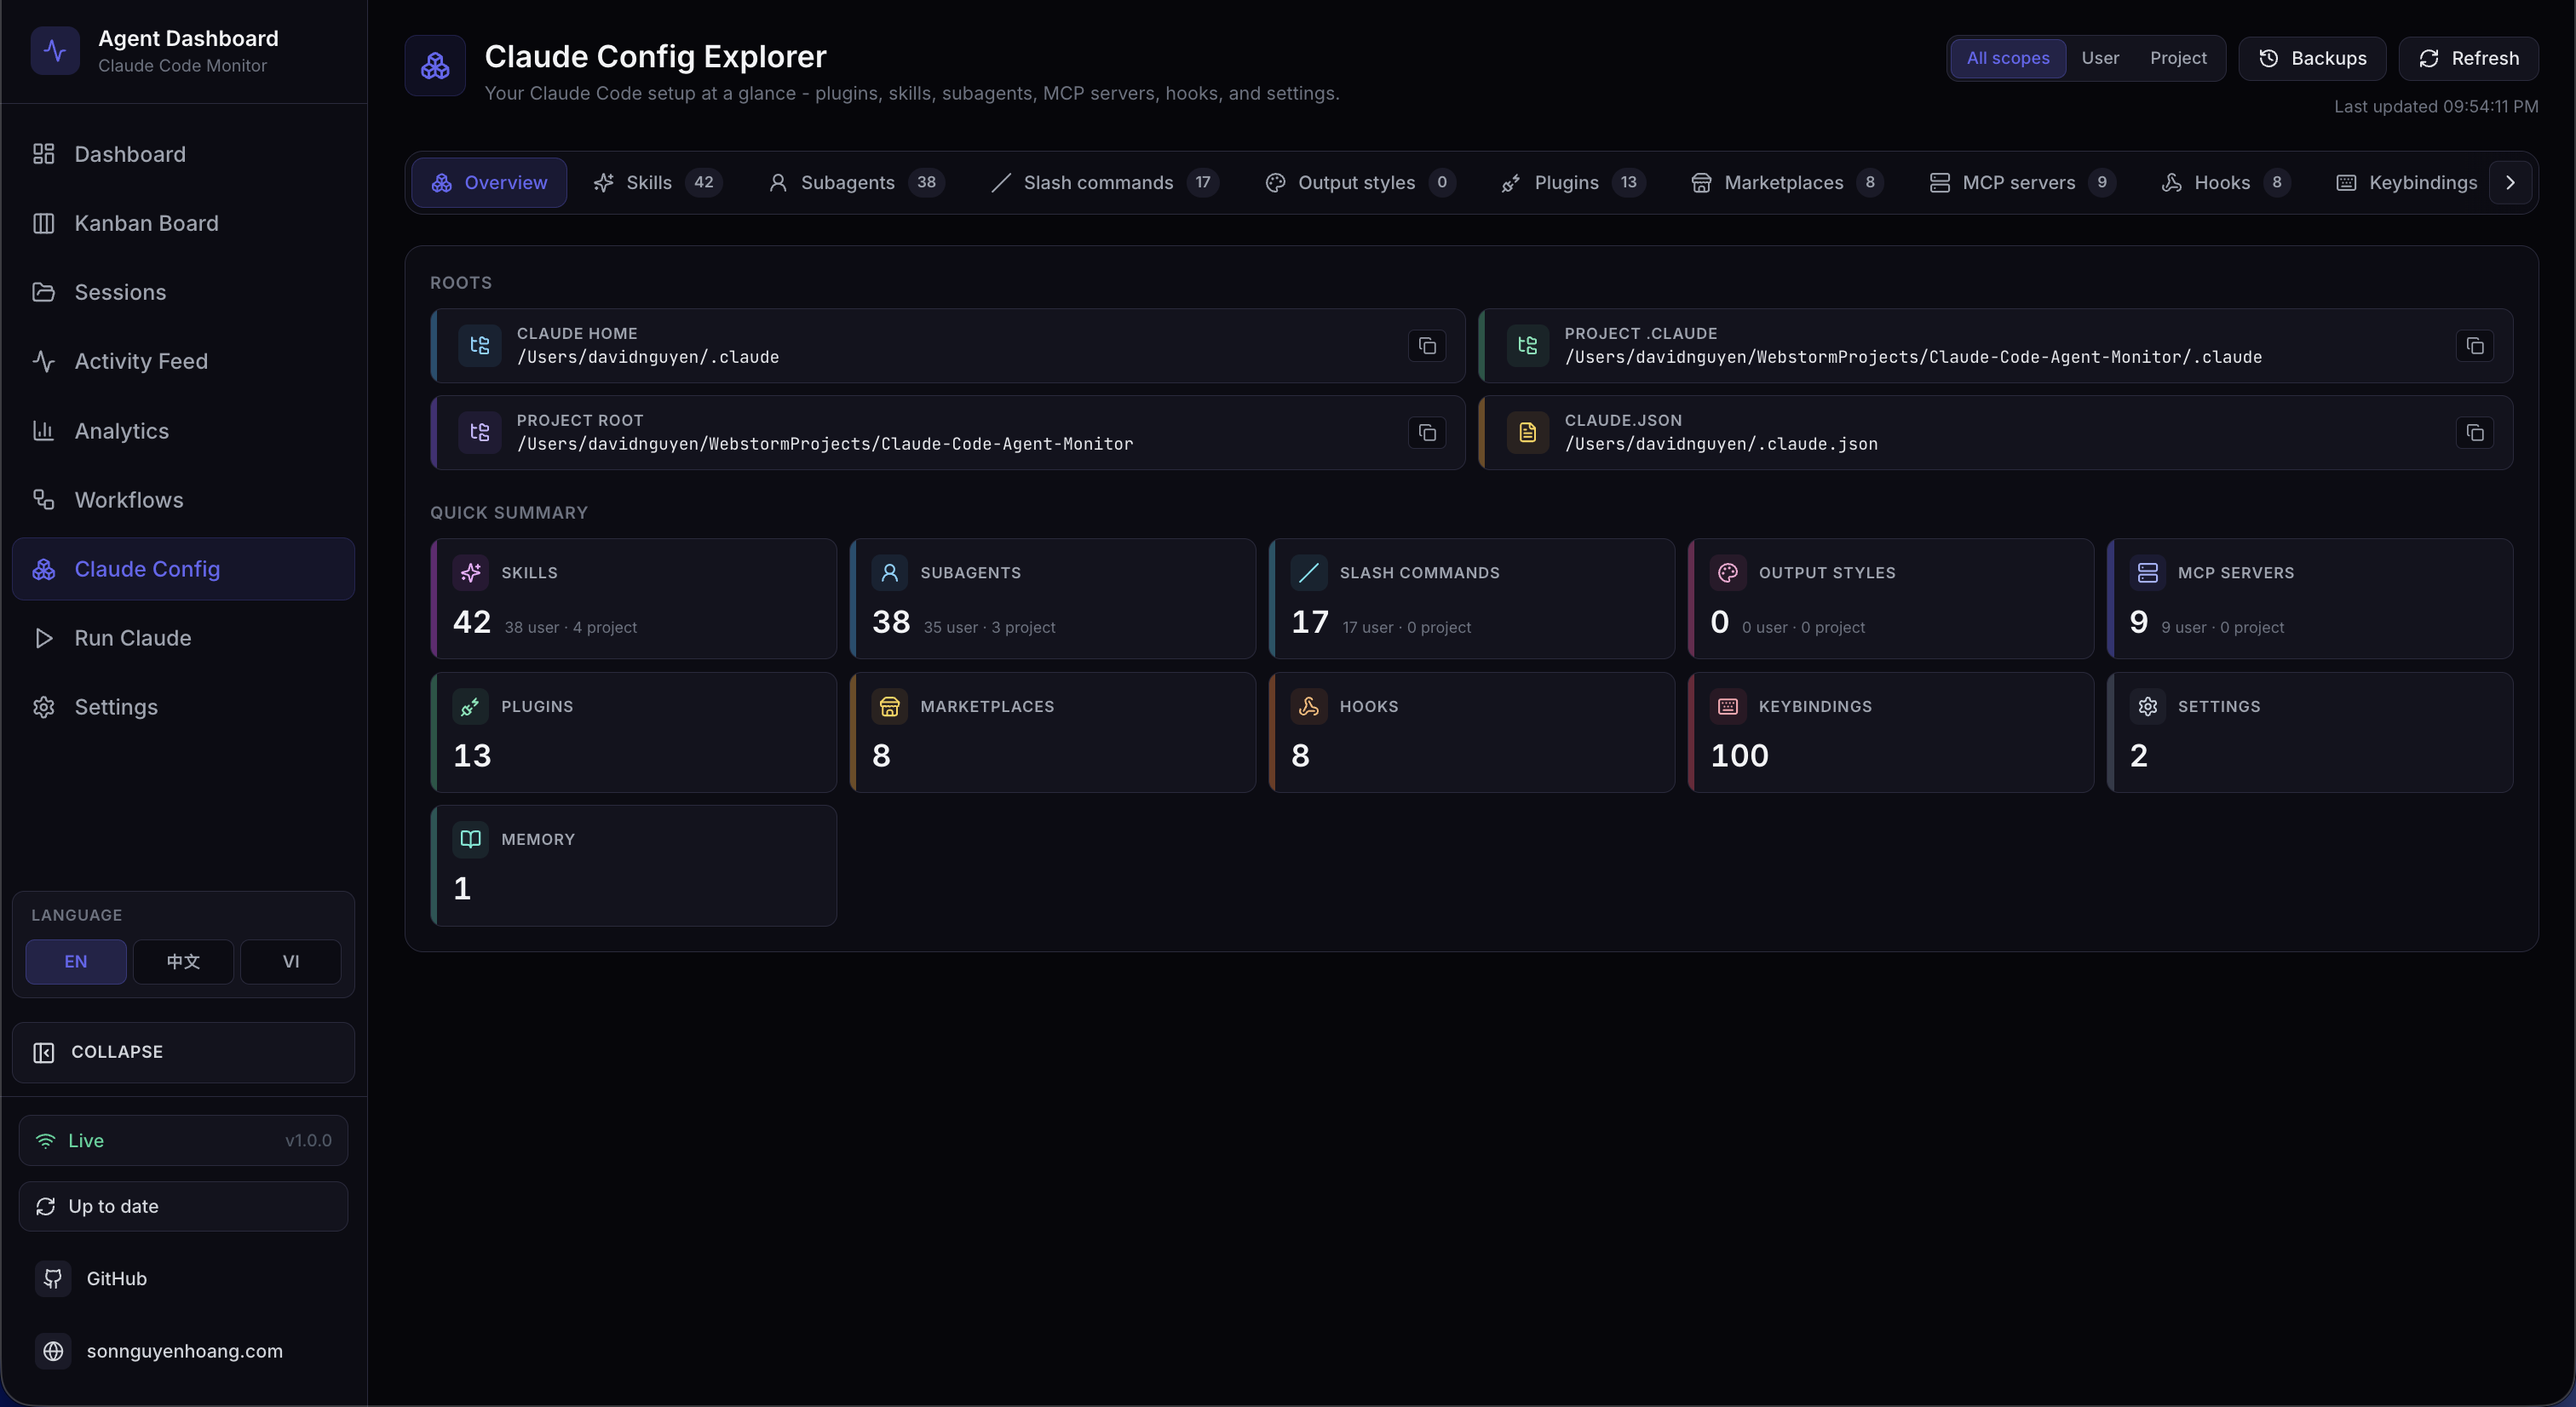
Claude Config Explorer
12 tabs: plugins, skills, subagents, slash commands, MCP servers, hooks, and more
 ⤢
⤢
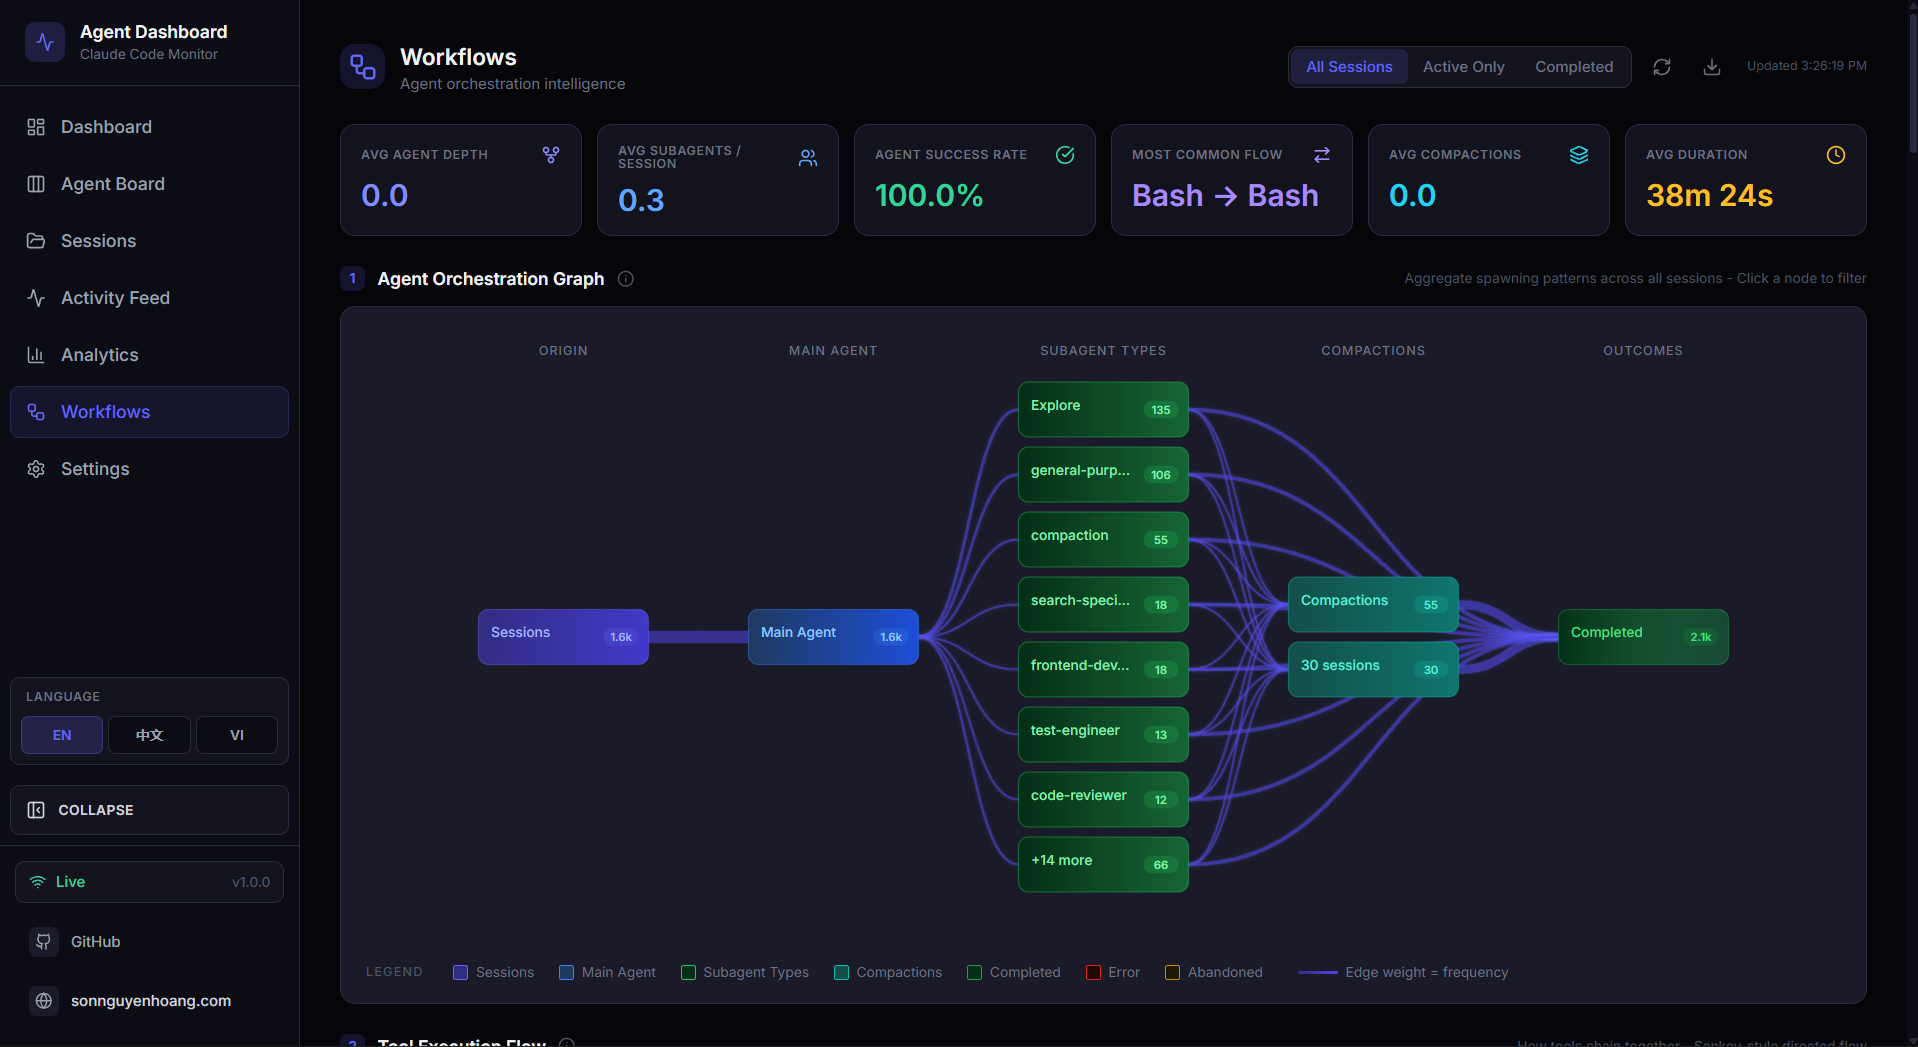
Workflows
D3-powered orchestration DAG, tool Sankey, collaboration network
 ⤢
⤢
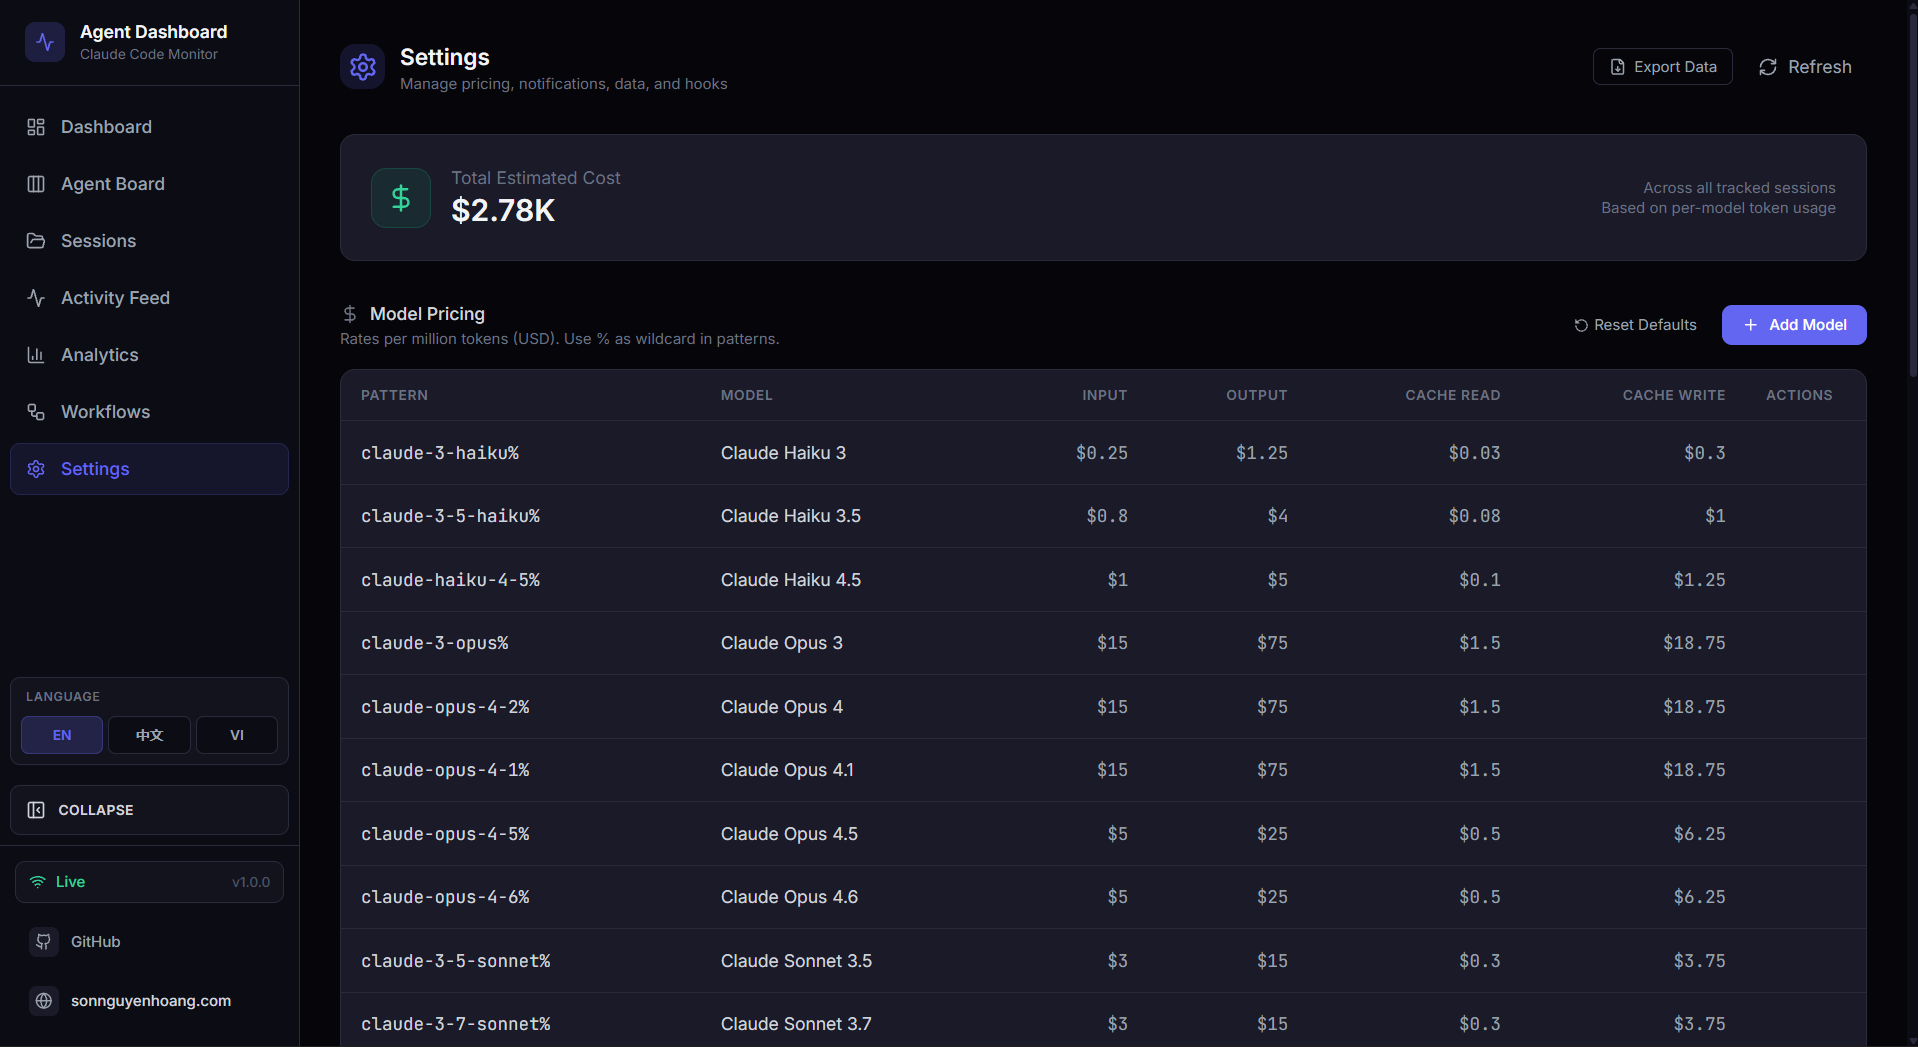
Settings
Model pricing rules, data management, and system information
 ⤢
⤢
Swagger API Docs
Interactive OpenAPI 3.0 spec with try-it-out controls
 ⤢
⤢
MCP Server
Interactive REPL exposing dashboard tools for Claude Code integration
 ⤢
⤢
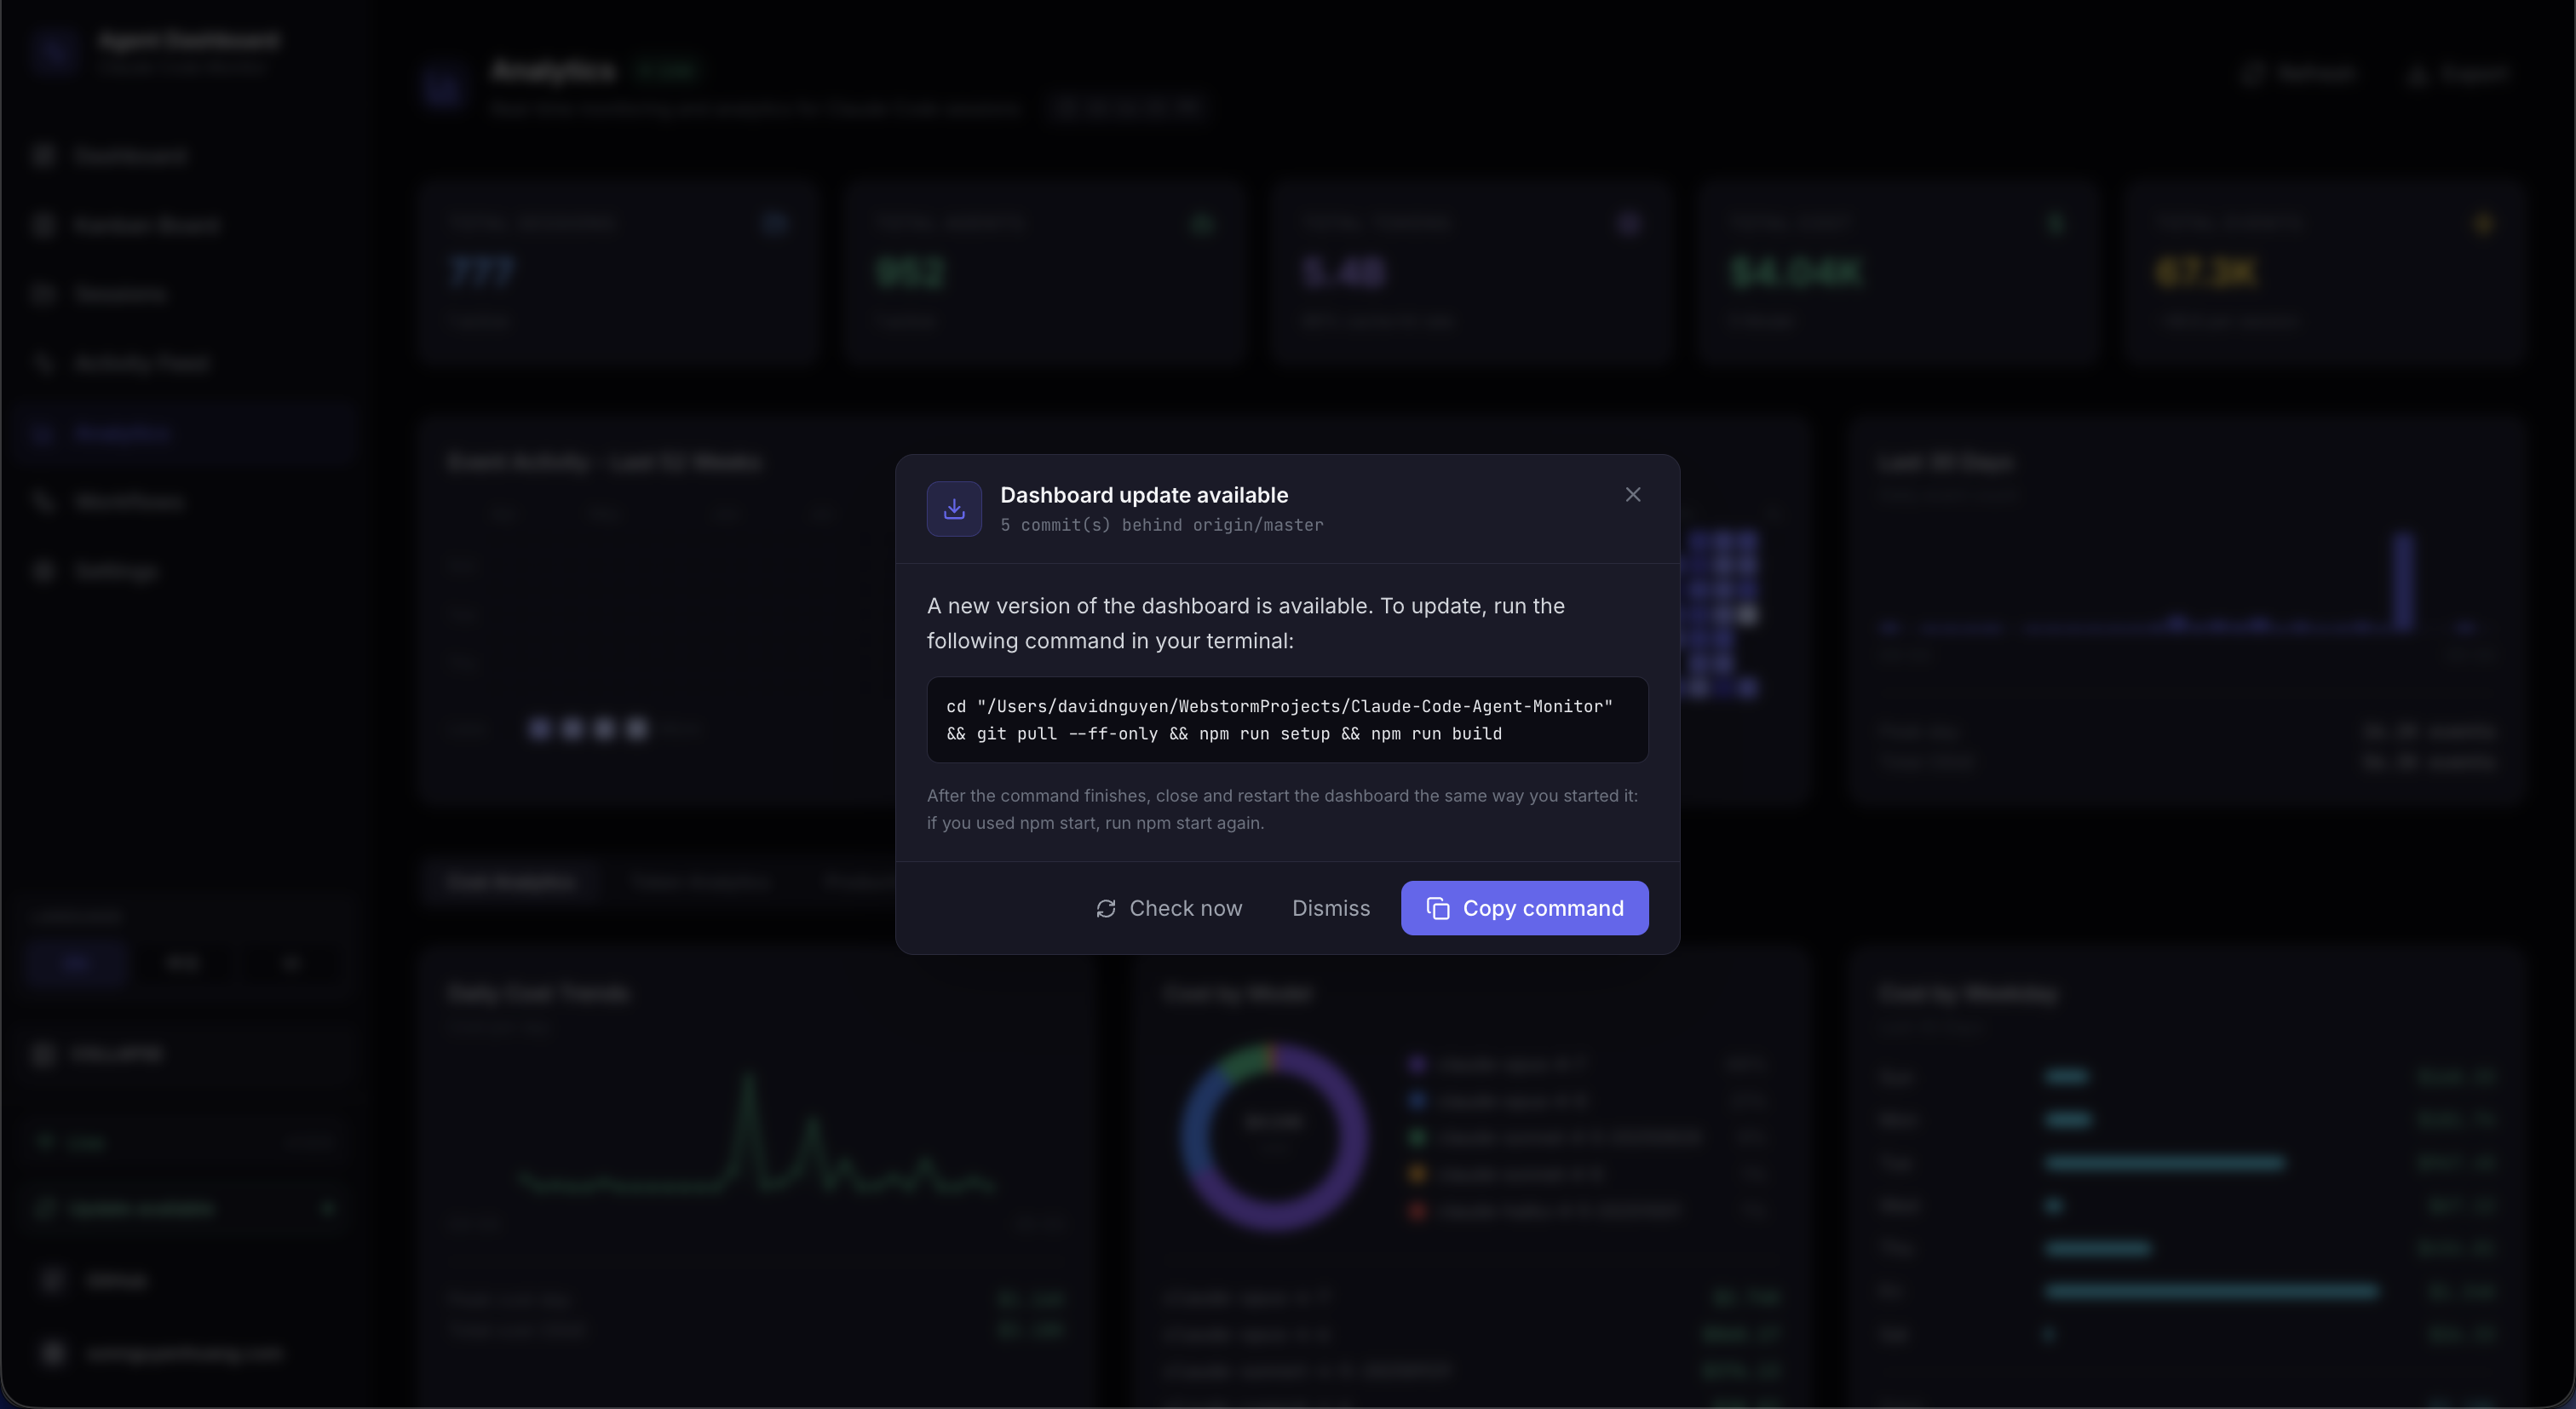
Update Checker
Commits-behind count with one-click copy-to-clipboard update command
 ⤢
⤢
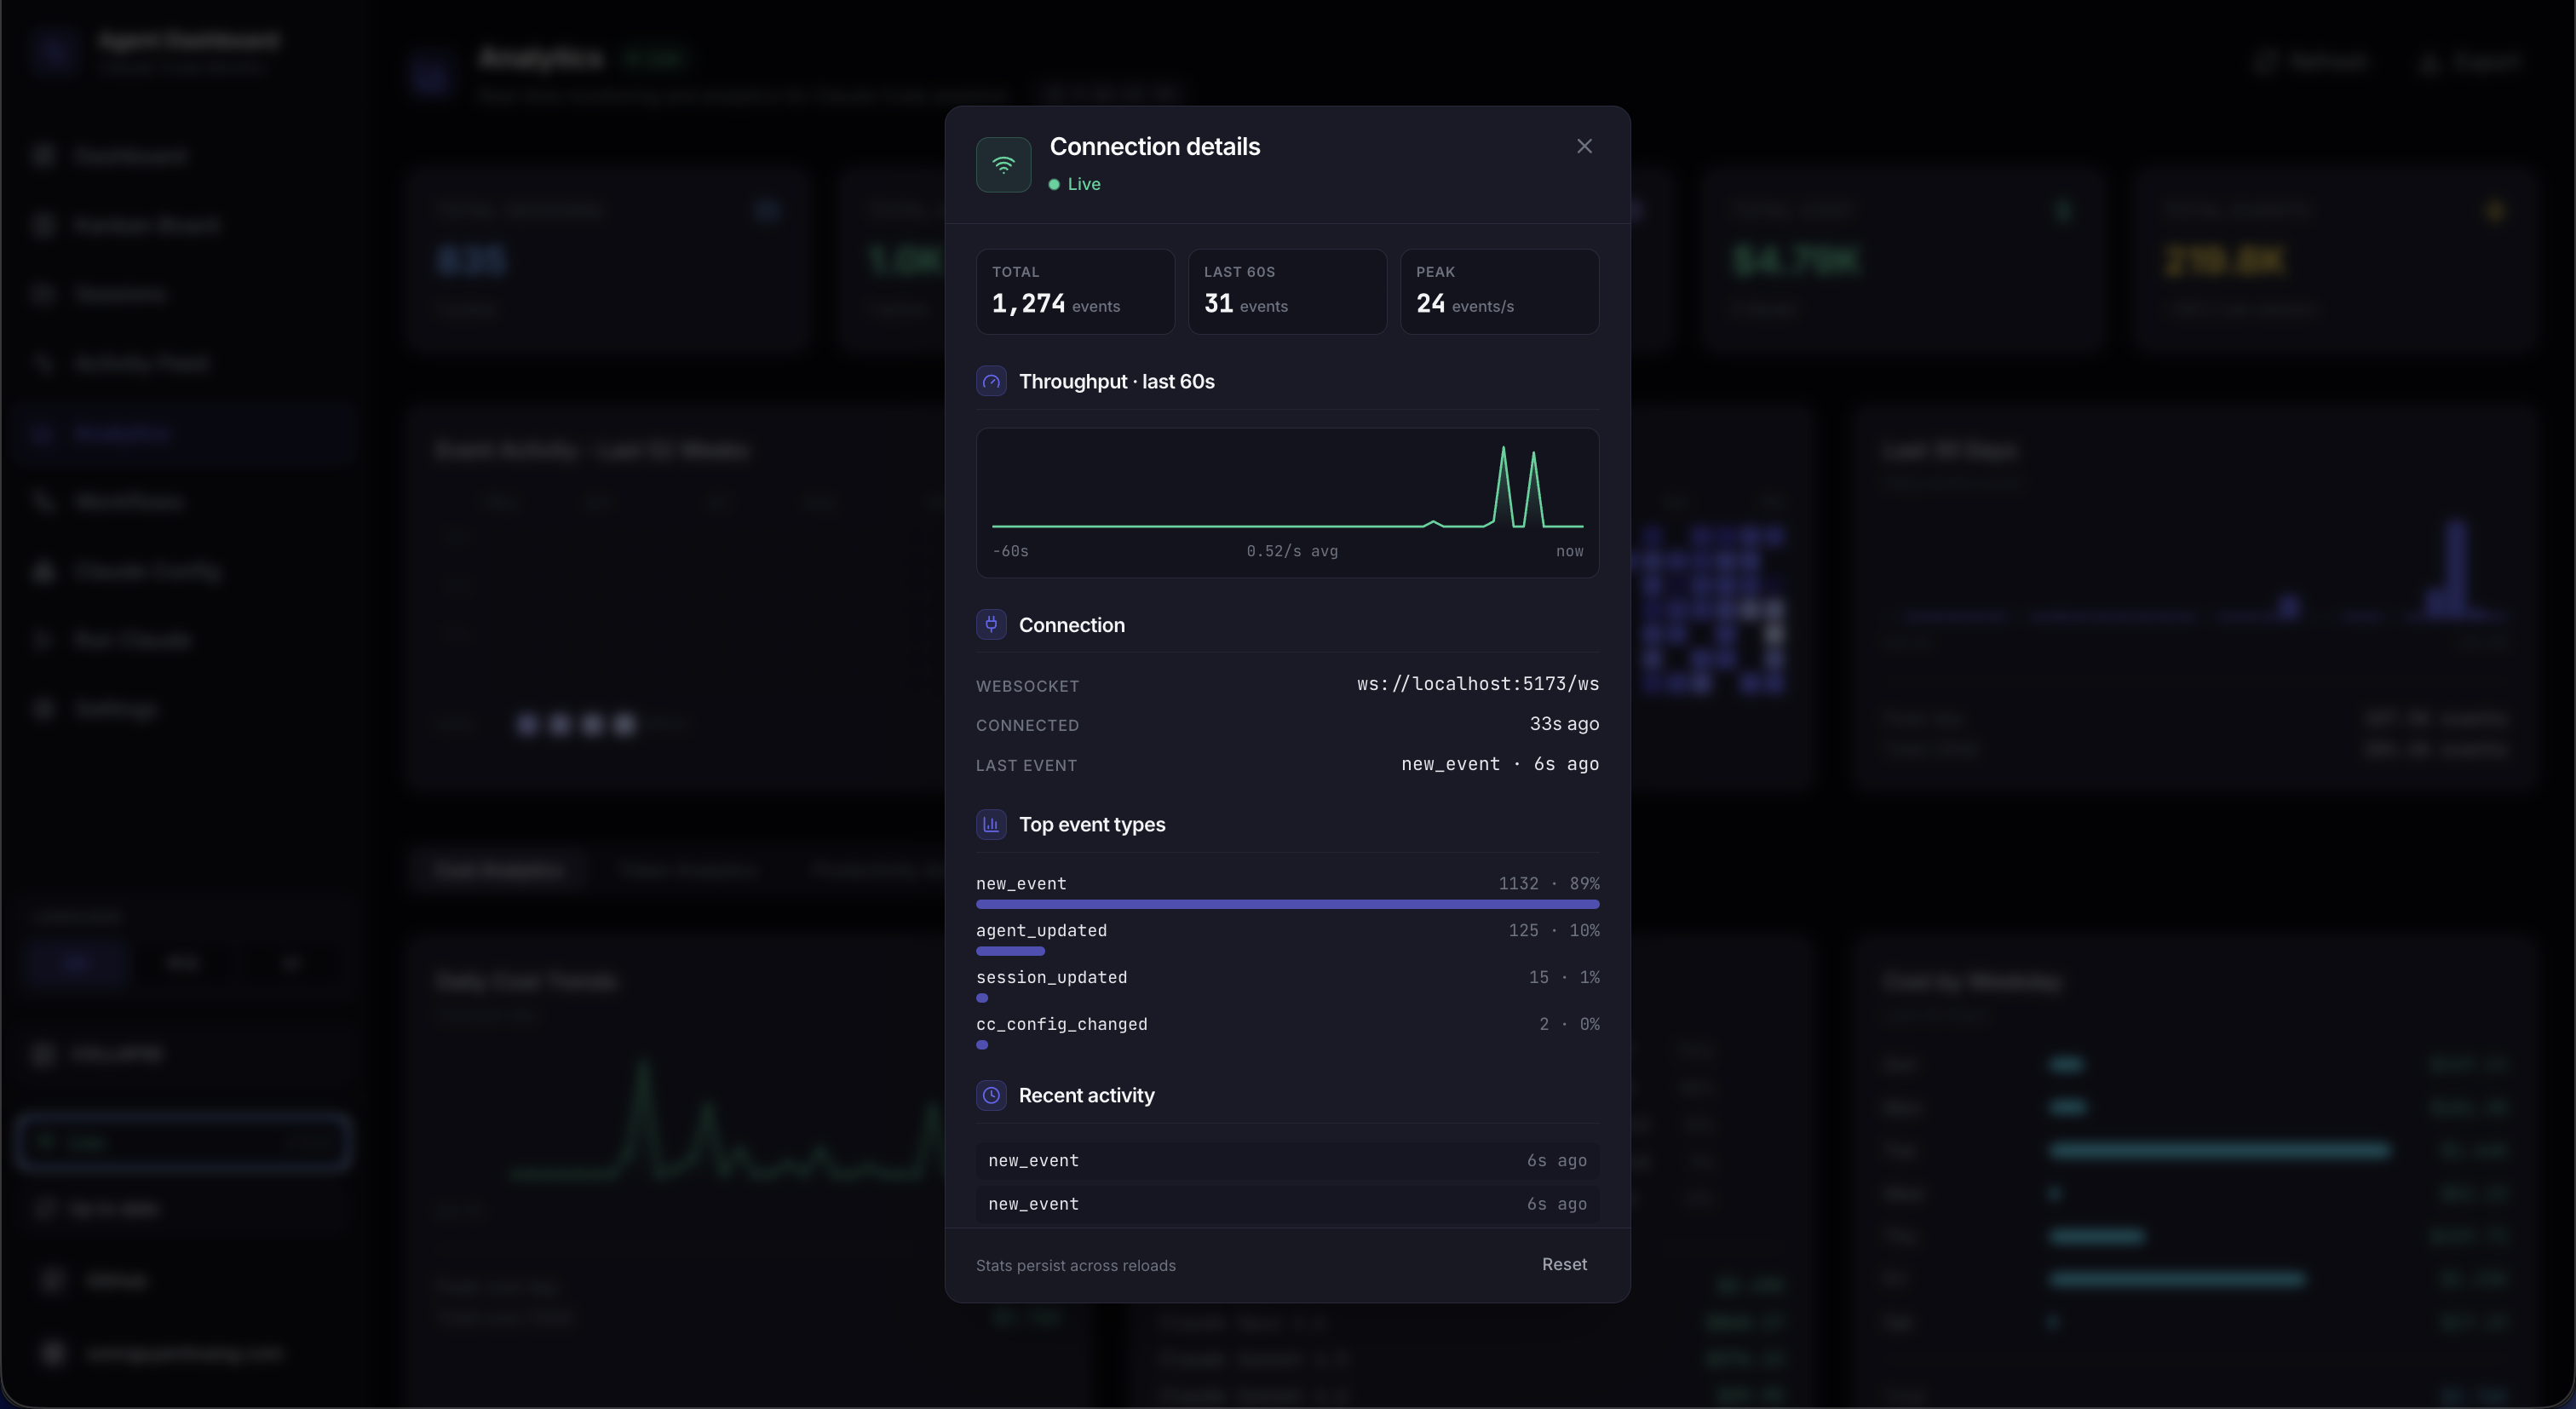
Connection Status
WebSocket details modal with 60-second throughput sparkline, top event types, and recent activity
 ⤢
⤢
VS Code Extension
Full dashboard sidebar inside VS Code with session monitoring
 ⤢
⤢
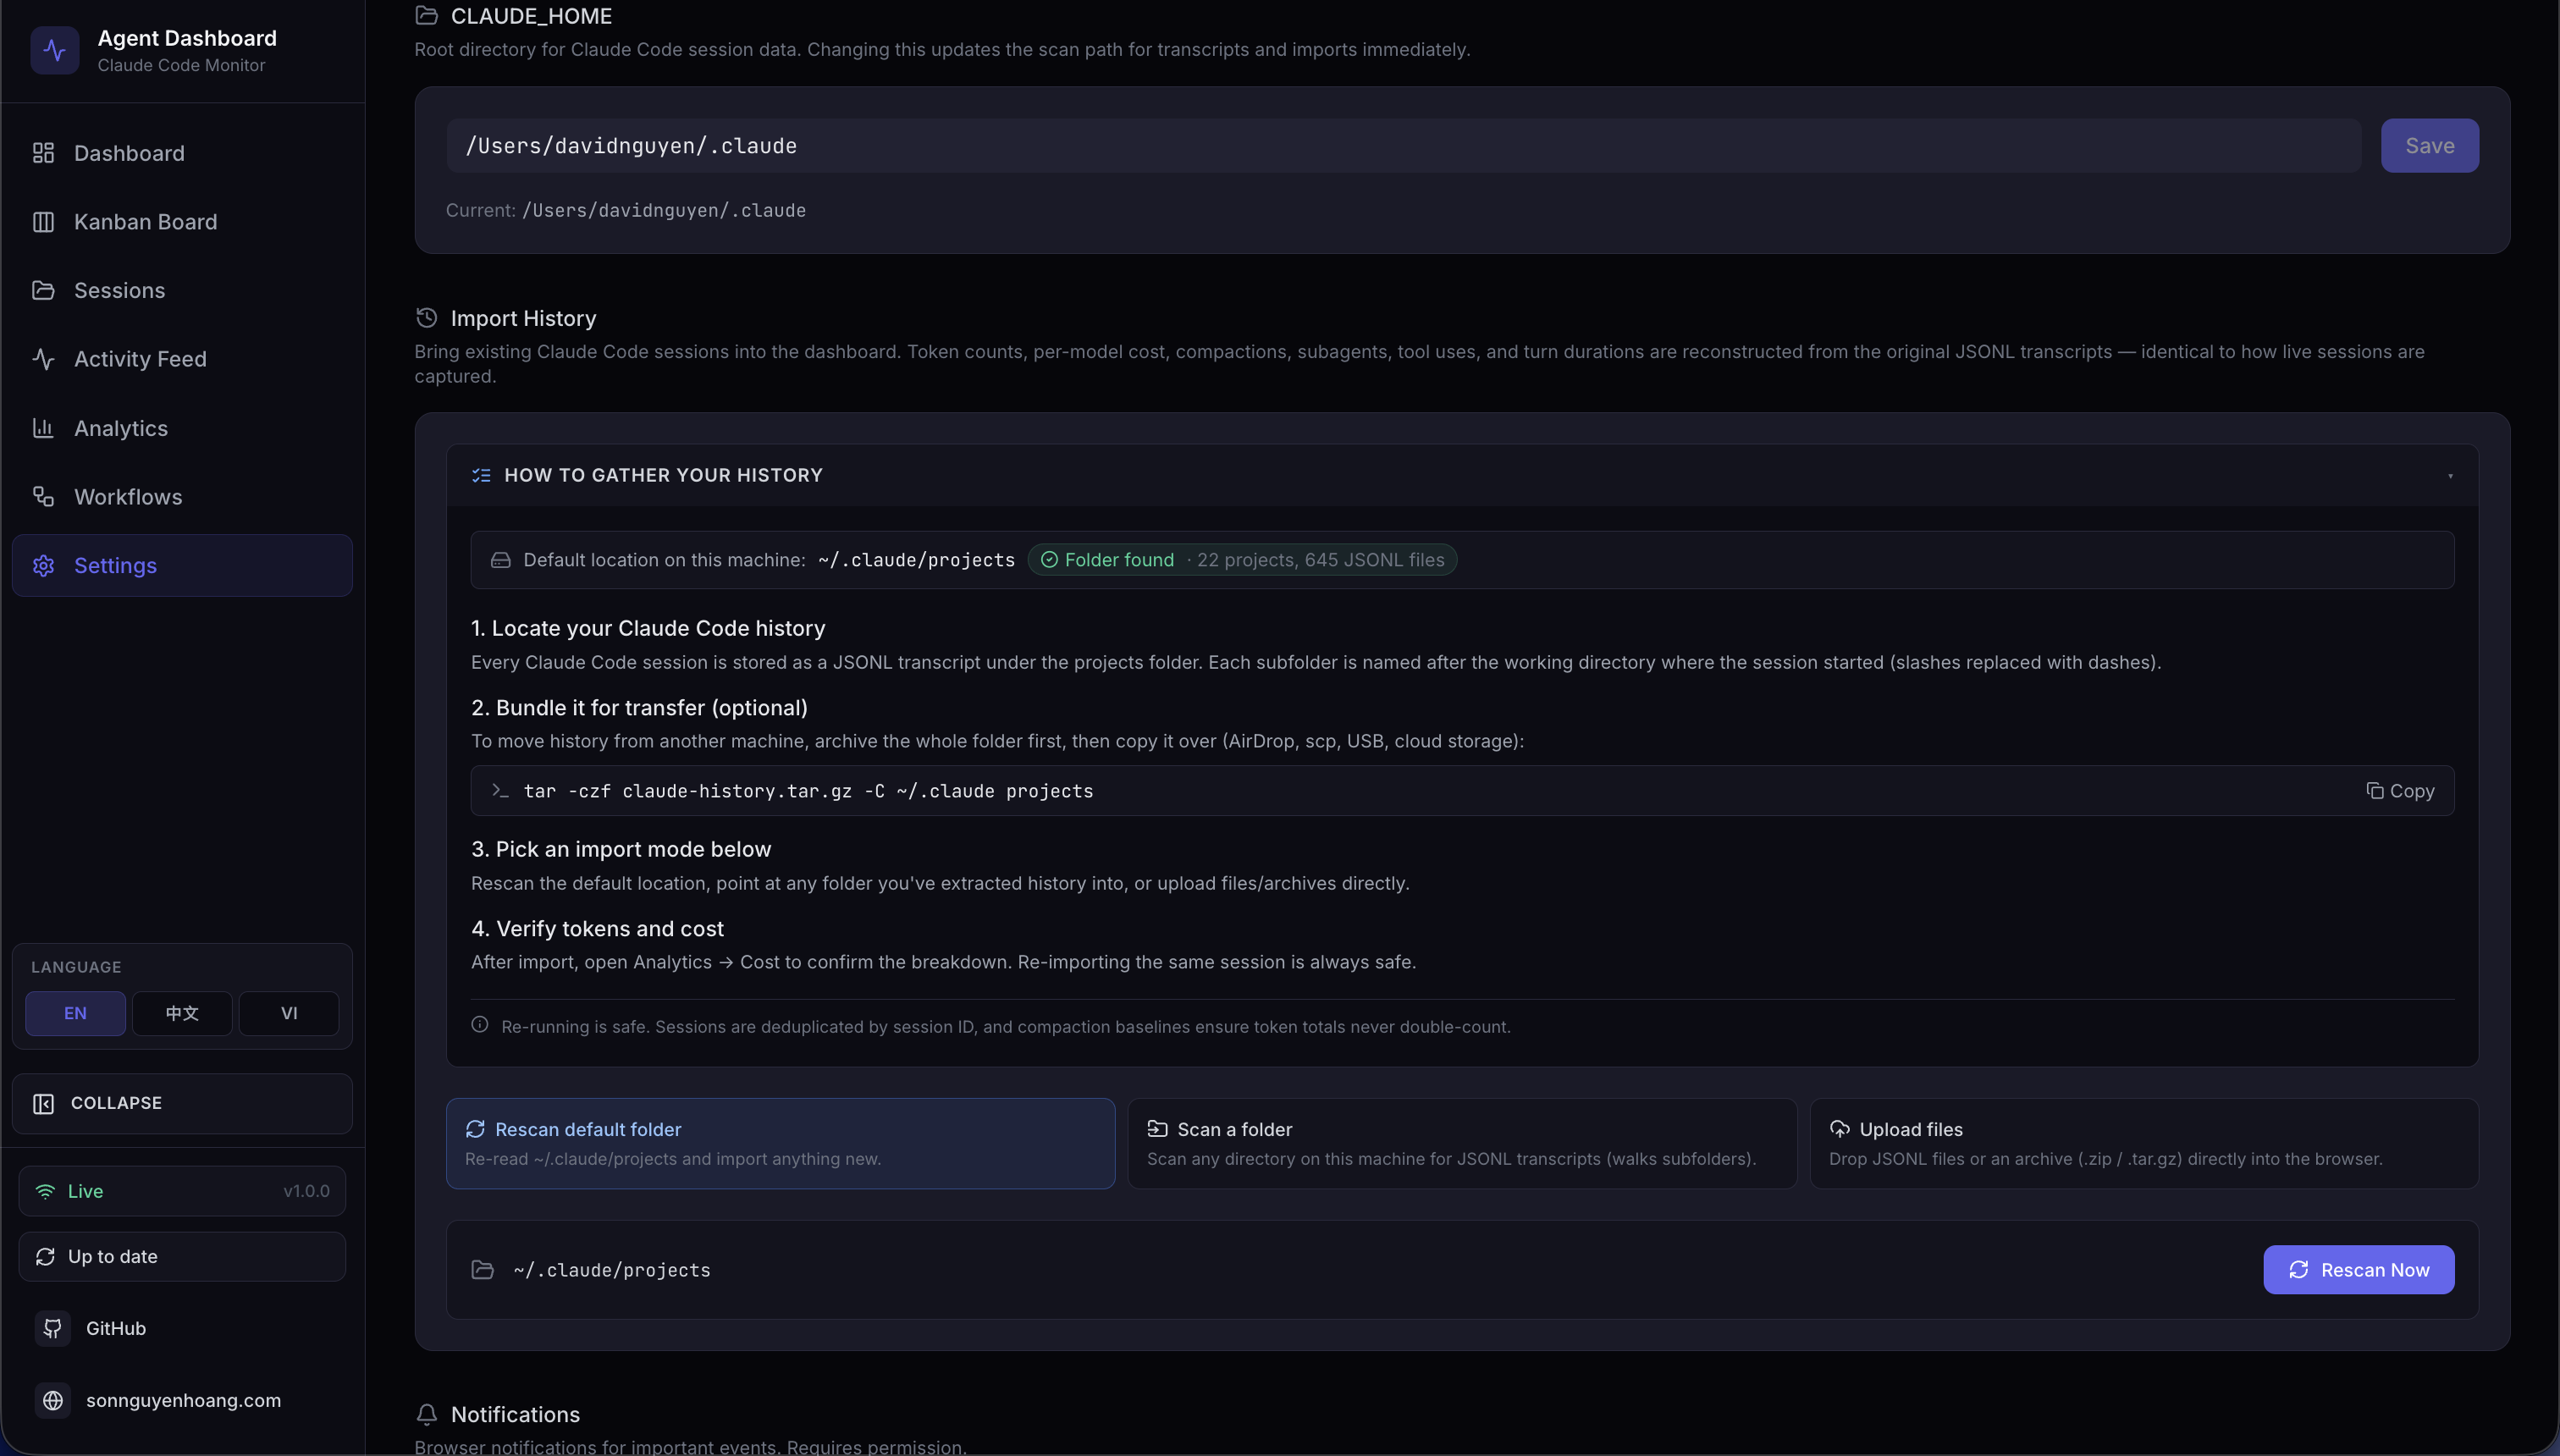
Import History
Rescan default folder, scan custom paths, upload archives with progress
Architecture
How the data flows.
A tight pipeline from CLI hooks to your browser. Everything's local - SQLite, your home dir, your machine. No accounts, no cloud, zero telemetry.
01
Claude Code fires a hook
Auto-installed entries in ~/.claude/settings.json trigger
scripts/hook-handler.js on every SessionStart, PreToolUse, PostToolUse,
Stop, SubagentStop, and Notification.
02
Hook handler POSTs
Stdin payload is parsed and POSTed to http://127.0.0.1:4820/api/hooks/event.
Always exits zero - Claude Code never blocks on the dashboard being unreachable.
03
Server ingests & persists
Single SQLite transaction per event. Auto-creates sessions and agents. Extracts token usage, tool calls, compactions, API errors, and turn durations from JSONL transcripts via a stat-cached reader.
04
WebSocket push
session_*, agent_*, and new_event frames stream
to every connected client. The React UI updates without polling. New
run_stream / run_status frames power the Run page.
Built for
Who actually uses this.
Originally a tool for one person to keep track of one developer's Claude Code use. Turned out it's useful for anyone who ships AI-assisted code - solo or in a team.
01 - Solo dev
Watch what your CLI is doing
See every session, every tool call, every token spent - in real time. Cost tracking, compaction-aware accounting, kanban view of in-flight work.
Sessions Cost tracking Activity feed
02 - AI-ops engineer
Monitor team-wide CC usage
Deploy to Kubernetes with Helm, point hook handlers at the central instance, get Prometheus metrics + Grafana dashboards. Aggregate cost by project / model / user.
K8s Prometheus Multi-user
03 - Plugin author
Inspect & debug your plugin
Config Explorer shows exactly what your plugin contributes, how its hooks fire, and how its skills/agents are structured. Marketplace tab walks you through publishing.
Config Explorer Marketplace MCP server
04 - Power user
Run Claude from the browser
Spawn one-shot or multi-turn sessions, resume any past conversation, manage runs
from a single page. Slash + @-file autocomplete, live token meter, effort
dial, model picker, and permission mode all per-spawn.
Run page Resume Streaming Slash + @
05 - Indie hacker
Optimize your AI spend
Per-model pricing rules, daily / weekly / monthly cost trends, token-by-token analytics, compaction baselines so you know exactly what each session costs - even after a long thread compresses.
Pricing Analytics Cost
06 - Curious researcher
Study agentic workflows
D3 orchestration DAG, Sankey of tool transitions, collaboration network of subagent calls, error-propagation map - the workflow page is purpose-built for understanding how multi-agent CC sessions actually behave.
Workflows Subagents DAGs
07 - Team lead
Keep the squad aligned
See who's running what, which sessions are active across the team, and how many tokens each project consumes. Kanban board and activity feed keep standups honest.
Board Feed Multi-project
08 - VS Code native
Monitor without leaving the editor
Use the VS Code extension sidebar to watch sessions and tool calls while you code. No browser tab needed — everything docks into VS Code as a side panel.
VS Code Extension Sidebar
Quick start
Up and running in 60 seconds.
Local-first by design. Clone, install, run - your Claude Code sessions start showing
up immediately because the dashboard auto-installs its hooks into your existing
~/.claude/settings.json.
Four commands.
No accounts, no cloud, no telemetry. Everything stays on your machine. Existing
sessions in ~/.claude/projects import on first start.
~/Claude-Code-Agent-Monitor - zsh
$git clone https://github.com/hoangsonww/Claude-Code-Agent-Monitor
$cd Claude-Code-Agent-Monitor
$npm run setup


$npm run install-hooks


$npm run dev


→http://localhost:4820
Tour the dashboard
A purpose-built page for every job.
Each route is its own focused workspace — kanban for at-a-glance status, sessions for drill-down, analytics for trends, run for live spawning. They all sit on the same hook-driven event store, so what you see anywhere is the same source of truth.
Live overview of every active session, agent, and tool call across all projects.
Drag-free swim lanes by agent status — waiting, working, completed, error, abandoned.
Searchable, filterable list of every session with token, cost, and status facets.
Full conversation transcript, agent tree, tool calls, errors, and per-turn token cost.
Real-time event log with grouping, multi-dimension filters, and pause / resume.
Cost trends, model mix, tool usage, error rates, productivity heatmaps — 11 datasets.
D3-rendered subagent DAGs, propagation maps, and complexity bubbles per session.
12-tab inspector for skills, subagents, plugins, MCP, hooks, settings, memory, and more.
Spawn, resume, attach, and stream Claude subprocesses straight from the browser with full config control.
Pricing rules, hook installer, notification setup, theme, language, and data tools.
Built with
A focused stack.
Boring, battle-tested foundations. No SaaS, no databases-as-a-service, no authentication providers. Just your machine + the tools that actually matter.
🗃️
SQLite
better-sqlite3 + WAL
📡
MCP 1.0
stdio / HTTP / REPL
🎨
Tailwind 3
+ lucide icons
📋
OpenAPI 3.0
+ Swagger UI
☸️
Kubernetes
+ Kustomize + Helm
🌿
Terraform
AWS / GCP / Azure / OCI
🧪
Vitest
+ Testing Library
✅
Node test
node:test runner
🪝
CC hooks
native CLI integration
🔧
React Router
v6 client routing
🎯
i18n detector
browser language
🗜️
tar / zip
safe archive extract
🔄
workbox
service worker (planned)
🐙
GitHub Actions
CI / release
🐍
Python 3
statusline script
FAQ
Frequently asked questions.
Quick answers to the things people ask most. The wiki has the full picture.
Does this send any data to the cloud?
No. The dashboard is a 100% local-first Node.js + React app that reads your existing
~/.claude/ directory and writes to a local SQLite file. There is zero
telemetry, zero analytics, no third-party calls. The MCP server is bound to
localhost. Web Push notifications use VAPID and only push to subscribers who
explicitly opted in via your own browser.
How does it integrate with Claude Code?
Claude Code's native hook system. npm run setup installs hook entries
into ~/.claude/settings.json that POST every SessionStart, PreToolUse,
PostToolUse, Stop, SubagentStop, and Notification event to the local server. Hooks
always exit zero so they never block your CLI; if the dashboard is down, your
workflow is unaffected and events resume capture as soon as it's back.
Will running Claude from the dashboard cost extra tokens?
The Run page spawns real claude processes - they consume your normal
Claude Code quota / API tokens, the same as if you ran them in your terminal. The
dashboard adds no overhead. The cost-tracking analytics show you exactly what each
run consumes, by model, with compaction-aware accounting.
Can I resume any session, even ones I didn't start in the dashboard?
Yes. The Run page's "Resume existing session" picker lets you select any session
from your full history (everything that's ever lived in
~/.claude/projects/), spawn claude --resume <id> with
the original cwd, and continue the conversation from where it left off - directly
in your browser.
Does the Run page have feature parity with the terminal TUI?
Most of what matters, with the limits the stream-json interface forces on us. We
support slash-command autocomplete (user / project / plugin commands expanded
client-side, plus built-in CLI commands flagged "CLI only - won't run from here"),
@-file references with debounced cwd-scoped fuzzy search, a live
context-window / token meter showing input + output + cache-read with cost, a
thinking-effort field wired to --effort, multi-turn conversation,
session resume, real character-by-character streaming, and full hook capture. What
doesn't carry over is the TUI itself - in-place tool approval prompts,
interactive /login / /init, the keybinding overlay - those
are CLI-only. There's a collapsible limitations banner on the Run page that spells
out exactly which is which, and any session can be popped open in your terminal
with claude --resume <id>.
Is it safe to edit my skills / agents from the Config Explorer?
Yes. Every mutation creates a timestamped backup in
<CLAUDE_HOME>/cc-config-backups/<type>/ before writing. Backups land
outside the directories Claude Code scans, so a deleted skill cannot resurface as a
backup-named one. Writes are atomic via temp file + rename. Plugins, MCP servers,
hooks-in-settings, and live settings.json files are intentionally
read-only because they have concurrent-write races with the running CLI.
What about scaling / multi-user?
The default deployment mode is single-user, localhost-bound. For team setups we ship Docker / Podman compose files, Kubernetes manifests with Kustomize, Terraform modules for AWS/GCP/Azure/OCI, Helm charts, and Prometheus/Grafana observability - see the deployment guide.
One-line install · zero config
Take Claude Code from black box to glass box.
See every session, agent, and tool call as it happens. Spawn and resume Claude from your browser. Inspect every plugin, skill, hook, and setting in 12 tabs. All on your machine — no telemetry, no signup, no cloud.
Install in 60 seconds Read the wiki Star on GitHub
MIT licensed 100% local-first Zero telemetry 13 pages, 1 binary Works offline