Hi all,
I hope you are well. And if you are, it is worth noticing that for a moment. The simple fact that you have the time and space to read something like this already places you, like me, among the more fortunate parts of the global population. That is not a moral statement, just a reminder of perspective. There are many more people for whom things look very different.
Something related to that perspective caught my attention recently. The latest World Happiness Report shows a shift that is easy to overlook but hard to ignore once you see it. In the richest countries, mostly English-speaking and those closely connected to them such as the Netherlands, younger generations report lower levels of life satisfaction than before. That breaks with a long-standing pattern. Life satisfaction usually follows a U-shape, relatively high in youth and later life, dipping in midlife. That curve is now starting to bend in unexpected ways.
This is not happening in isolation. It aligns with worsening housing prospects, more precarious forms of work, and widening wealth gaps that affect younger cohorts more than others. I have written about this elsewhere, so I will not repeat the full argument here. But it is worth pausing on it. If you have children, it may be worth asking how they see it.
Still, that is not what this piece is about.
What I want to explore here is something more specific, and perhaps more uncomfortable. There is a growing group of voices arguing that the sustainability transition is overstated, unnecessary, or already well underway thanks to markets and technology. The more careful among them no longer deny climate change outright. That position has become too costly to defend. Instead, the argument has shifted. It has become more refined, more data-driven, and in some ways more persuasive because of that.
In this piece I want to unpack three recurring tactics in these arguments. They are not about denying facts outright. They are about shaping how those facts are interpreted. The first concerns the focus you choose and the story you tell. The second is about the data you present and how you present it. The third, and most subtle, is about how research itself is framed and tested.
As always, I will start with a short version before moving into more detail.
So, let’s start with focus and story. The ecomodernist move here is to root everything in a particular version of the Enlightenment. Not the historical one, but a simplified one: Reason, Science, Progress. From there the line is almost automatic. Progress leads to growth, and growth solves our problems. Anyone who doubts this is not just wrong. They are irrational, standing against the direction of history.
What makes this powerful is that it is self-sealing. Environmental failure does not challenge the model. It reinforces it. Climate change? More innovation. Resource scarcity? Better technology. The answer is always the same. The model never comes into question.
Add to this the framing move. Present yourself as pro-progress, and critics become anti-progress almost by definition. You don’t have to argue that explicitly. The language does the work.
And lastly the academic layer. A large majority of economists endorses green growth. But the strong est predictor of that endorsement is not expertise in decoupling. It is the prior belief that growth is necessary for well-being. The conclusion drives the reading of the evidence, not the other way around.
Then there is data. The ecomodernist does not invent numbers. They select them. Show per-capita emissions instead of totals. Show a few countries instead of the global panel. Show the last decade instead of the long run. Show production-based emissions instead of consumption-based ones. Each of these choices can be defended. Together they create a very particular picture.
The problem is not that the numbers are wrong. It is that the picture is incomplete in a systematic way.
If you step back and look across two centuries, the story becomes much less comfortable. Genuine green growth, absolute decoupling at a rate consistent with Paris targets while the economy keeps expanding, is rare. Essentially anecdotal. And when it does occur, it does not last. Once growth resumes, the pattern reverses.
And then research. This is the most sophisticated move. Not because it looks less scientific, but because it looks more so. Formalise a theory in a way that strips out what matters most. Choose a proxy that only partially matches the concept. Run the test. Present the outcome as a clean falsification.
A recent attempt to test the doughnut economy does exactly this. It uses a dispersion statistic that cannot capture planetary boundary violations. It replaces actual thresholds with normalized endpoints. And instead of measuring capitalism, it uses a proxy for market liberalism. The result looks precise, but the core of the theory is gone.
When the same framework is measured properly, the picture is very different. Ecological overshoot is large. Extreme in some cases. A relatively small group of countries drives a disproportionate share of it, while experiencing only limited social shortfall. And the gap is not closing. It is widening. The difference is in how the question is constructed.
In what follows, I will go deeper. If you have the time, it is worth reading. It helps to see more clearly, and it gives you something to hold on to when you run into these arguments.
Let’s start with the most fundamental tactic: framing. When you are in the business of ecomodernism, or what the political ecologist Giorgos Kallis more precisely calls “post-environmentalism”, there are a few reliable tricks of focus and narrative.
Post-environmentalism, associated above all with the Breakthrough Institute and its co-founders Ted Nordhaus and Michael Shellenberger, rejects the idea of limits and instead advocates urbanization, industrialization, and agricultural intensification as the path to environmental protection. The 2015 Ecomodernist Manifesto is its most polished product. But the intellectual roots go further: to Steven Pinker’s Enlightenment Now, Hans Rosling’s Factfulness, and the broader “New Optimist” literature that has found a large and enthusiastic audience precisely because it tells people what they want to hear. WE DON’T NEED CHANGE! WE DON’T NEED TO GIVE UP ANYTHING. Technology and markets will fix it. Progress is the law of nature.
Relax.
If it was really true, why did we not solve our sustainability problems yet?
The first trick is to root everything in the Enlightenment. Not the historical Enlightenment, complicated, contested, entangled with colonialism and enclosure and the rationalisation of exploitation, but a mythologized one: Reason, Science, Progress, Freedom. Pinker makes this move explicitly and grandly. His argument is essentially that the Enlightenment gave us empiricism and markets, empiricism and markets gave us growth, and growth gave us everything good: longevity, literacy, falling child mortality, democracy, fewer wars. It is a beautiful story. The problem is that it is a story and not history. It is a founding myth dressed in data.
But the philosophical move is more subtle and more dangerous than mere cherry-picking. Pinker is not simply saying that things got better. He is making a Kantian claim: that history has a direction, that Reason drives it, and that this direction is good. This is secular providentialism The idea, running from Turgot and Condorcet through Herbert Spencer and now through Pinker, that social evolution is progressive by nature. Setbacks are temporary deviations. Problems are inputs for solutions. The arc of history bends toward improvement because that is what Reason does. Innovation is not just useful; it is the mechanism of historical destiny.
This matters enormously because it makes the framework self-sealing. Every environmental problem becomes evidence that more growth and more innovation are needed, not evidence against the model. Climate change? We need more technology. Biodiversity loss? Better agricultural intensification. Resource depletion? Innovation will find substitutes. The framework cannot be falsified because every failure is reinterpreted as a call for more of the same. Anyone who suggests that the model itself is the problem is not just wrong: they are irrational, standing against the direction of history, betraying the Enlightenment project. They are "romantics," "primitivists," "doomers." The story is structured so that criticism is pre-emptively delegitimized.
What the story leaves out is everything inconvenient. Don’t mention class struggle. Don’t mention colonialism. Don’t mention that the institutions which generated mass literacy and public health were often built through political battles against precisely the interests that now invoke their legacy. Mention that we “stand on the shoulders of giants” only if we carefully select which giants and romanticise them and ignore the conditions under which those shoulders were built. Don’t mention that the Industrial Revolution that lifted average incomes also produced the ecological debt we are now trying to repay. Critics have shown that the New Optimists’ progress narratives rest on shaky assumptions, cherry-picked data, and a faulty moral compass: they confuse what was, in centuries past, with what could have been.
What this framing ultimately accomplishes is to present the current economic model as the necessary consequence of Reason itself. Doubt the model and you doubt Reason. Doubt growth and you doubt progress. You are not just wrong: you are unenlightened.
The second trick follows directly. Post-environmentalists frame positive messages, such as ecomodernism, eco-pragmatism, environmental progress, and then critics must argue against these good things, unwittingly reinforcing the framing in the process. Call yourself "pro-progress" and your critic is implicitly "anti-progress." Call your agenda "pragmatic" and alternatives look utopian. The political scientist George Lakoff called this dynamic explicitly, and the Breakthrough Institute has applied it with considerable skill. As Kallis and co-authors show in their detailed discourse analysis, this explains much of post-environmentalism's staying power: its politics align with powerful interests who benefit from arguing that accelerating capitalist modernisation will save the environment. The story is appealing because it is convenient. It tells incumbent industries and their political allies that nothing structural needs to change; just more innovation, more growth, more of the same.
The third trick is the most important for the sustainability debate specifically: the paradigm-conformity effect. Among academics, anyone who questions the green growth premise faces a significant headwind. A large survey of over three thousand researchers in 101 countries found that 59% endorsed the feasibility of green growth globally and among economists the figure rose to 74%. The single strongest predictor of green growth endorsement was not expertise in decoupling science. It was the prior belief that economic growth is essential for human well-being. In other words: the conclusion drives the evidence-reading, not the other way around. Those who question whether innovation will rescue us are swimming against the dominant framework and the dominant framework is not purely empirical. It is also ideological. If you deviate too far, you risk being labelled unserious, your models unfunded, your policy proposals ignored. The Enlightenment story creates the atmosphere in which the data is read.
The fourth trick is the conflation of improvement with sufficiency, and it operates through careful choices about what to measure, where, and over what time period. Show per-capita emissions rather than absolute totals. Show national figures rather than global ones. Show the last decade rather than the last century. Show production-based emissions rather than consumption-based ones, which conveniently move the carbon footprint of wealthy countries’ imports offshore. Each of these choices, individually defensible, collectively constructs a picture of progress that the underlying reality does not support.
And here the new research is devastating. A comprehensive historical study examining 200 years of data found that the large majority of cumulative fossil-fuel CO₂ reduction occurred not during green growth but during recessions — wars, financial crises, pandemics. Just five global crises account for roughly 40% of all fossil-fuel CO₂ reduction since 1820. What we call “genuine green growth” , absolute decoupling at a rate consistent with Paris climate targets and robust economic expansion, is, in the historical record, essentially anecdotal. A major new study of material footprint across 105 countries gives this a precise name: temporal cherry-picking, spatial cherry-picking, and overshoot-level cherry-picking. You choose the time window, the country, and the sustainability threshold that makes the story look best. The methodology produces the conclusion before the data is examined. More on the data in the next section.
What the ecomodernist story never tells you is that the Enlightenment progress narrative was built under very different planetary conditions. We are no longer operating with the same slack in the system. Seven of nine planetary boundaries have been exceeded. The atmosphere does not average across countries. It does not care whether we count per-capita or per-unit-of-GDP. Celebrating the current trajectory as proof that the system is working is like praising someone for slowing down from 140 to 120 km/h as they approach a red light.
The mirror is flattering. But it is also facing the wrong direction.
The second tactic is data. The ecomodernist does not invent numbers. They select them. They choose the indicator, the time period, the geographic scope, and the unit of measurement that makes the story look best. Each choice is individually defensible. Collectively, they construct a picture that the underlying reality does not support. Let me show you how this works in practice, using a simple taxonomy and three moves. And I will do only the ‘core’ discussion: decoupling between economic growth and carbon emissions.
The taxonomy you need
Before anything else, you need to understand that “decoupling” is not one thing. It is at least three things, and conflating them is the oldest trick in the book. Relative decoupling means GDP grows faster than emissions or resource use. Emissions still rise, just more slowly than the economy. This is the most common pattern globally and completely compatible with continued ecological destruction. Absolute decoupling means total emissions fall while GDP grows, genuinely different and much rarer. And then there is what we might call sufficient decoupling: absolute decoupling fast enough to respect our fair share of the remaining carbon budget. This is the standard that actually matters for planetary boundaries. According to the data, it requires roughly ten times the current rate of decoupling achieved by even the best-performing countries.
Almost every optimistic claim you will encounter in the ecomodernist literature conflates the first with the second, or the second with the third. When someone shows you a graph of “successful decoupling,” the first question to ask is always: which kind?
Move one: show per capita, hide the total
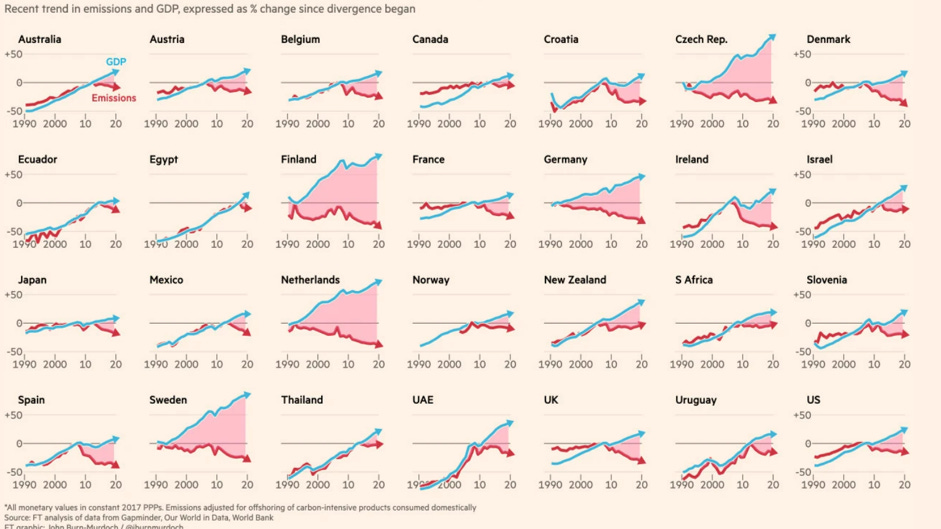
This is the most common trick and the easiest to execute. Take a wealthy European country. Show its CO₂ emissions per capita over the last two decades (see figure below). The line goes down. It looks like progress. It feels like progress.
This suggests that this is a global phenomenon: Even Nigeria! Even Azerbijan! And these data are correct, so why so negative?
Well, the problem is that what determines whether we stay within planetary boundaries is not emissions per person but total emissions the sum of everything humanity puts into the atmosphere.
But even using not per capita data, but total emissions, we have a trick: geographic selection. Show Germany, Denmark, the UK. Do not show the global panel. A study covering 164 countries found that while 49 countries have achieved some form of decoupling, 115 have not, and globally the association between GDP per capita and CO₂ emissions per capita remains positive. The optimistic story is built on roughly 30% of countries and presented as if it describes the world.
Move two: choose your time window
The second move is temporal. You show the period that looks best and stop there. Perfect framing. But the effect is systematic and the new research is unambiguous about it.
Take the United Kingdom, frequently cited as a model of green growth. If you look at 1990–2021, you see an inverted U-shape: material footprint rising then falling as GDP grows (see also figure above for carbon). It looks like the Environmental Kuznets Curve in action, the theoretical idea that economies automatically clean up after themselves once they reach sufficient wealth (see blog #43). Now extend the same analysis back to 1875. The inverted U disappears. What you see instead is a predominantly linear relationship across 147 years: more income, more material consumption. The apparent turning point in the recent period is not a structural transformation. It is a temporary fluctuation, partly driven by the 2008 financial crisis and the housing bust, sitting on top of a persistent long-run trend of coupled growth.
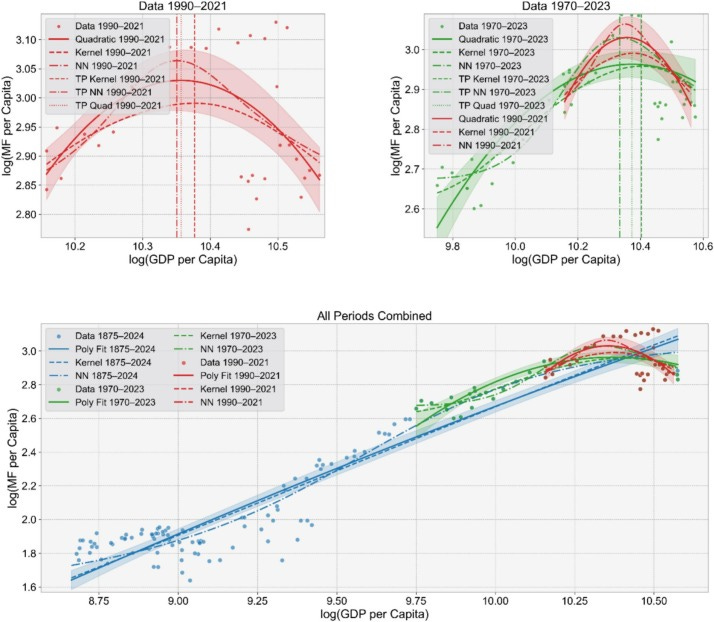
The researchers name three specific forms of cherry-picking at work. Spatial cherry-picking: spotlighting individual countries while ignoring the global panel. Temporal cherry-picking: using short time windows where dips are mistaken for structural change. And overshoot-level cherry-picking: claiming decoupling success at consumption levels far above any plausible sustainability threshold. The UK’s material footprint, despite its recent decline, remains well above the 6–8 tonnes per capita corridor that sustainability science suggests is compatible with a safe operating space. Decoupling from an unsustainable level, at an insufficient rate, in a short window, is not green growth. It is a flattering camera angle.
When you look at all 105 countries together rather than selected cases, the Environmental Kuznets Curve simply does not appear. The panel regression shows a positive and statistically significant relationship between GDP and material footprint throughout the entire 1970–2023 period. Individual success stories are not making the collective difference required.
The atmosphere does not average. It accumulates. Globally, there is only evidence for relative decoupling. Total CO₂ emissions hit an all-time high of 37.8 gigatonnes in 2024. While selected European countries were showing their beautiful per-capita downward trends, the global total kept rising.
Move three: count only what you can see
The third move is definitional. Most decoupling statistics count production-based emissions, what is physically emitted within a country’s borders. This is the number that goes into national climate commitments and gets reported in the headlines. But wealthy countries have extensively offshored their carbon-intensive production. When you instead count consumption-based emissions, including the carbon embedded in everything a country imports, the decoupling picture deteriorates sharply. One analysis found that switching from production-based to consumption-based accounting reduces the number of country-year instances of absolute decoupling by 49%.
The same logic applies within sectors. When you account for the full supply chain of electricity generation. not just the direct emissions from power plants but the upstream emissions from fuel extraction, refining, infrastructure, and the materials used to build renewable energy systems. total emissions are consistently around 20% higher than the figures that appear in official statistics. Solar panels and wind turbines have zero direct operational emissions. They do not have zero life-cycle emissions. Counting only what you can see at the smokestack is not neutral methodology. It is a choice.
What the data actually shows
Put these three moves together and the picture that emerges is very different from the one in the ecomodernist presentation.
A comprehensive historical study examining two centuries of data across all world regions found that roughly 60% of cumulative fossil-fuel CO₂ reduction occurred not during green growth but during economic recessions. Just five global crises — the two World Wars, the 1929 crash, the 1970s oil crises, and COVID-19 — account for around 40% of all fossil-fuel CO₂ reduction since 1820. The episodes of “genuine green growth” — absolute decoupling at a rate consistent with Paris targets and robust economic expansion — are, across 200 years of industrial history, essentially anecdotal. And the episodes that did occur were reversible: the UK’s celebrated seven-year run of absolute decoupling ended when growth resumed. France achieved the same for seven years in 1979–1986. Japan, Germany, Belgium — the same pattern each time.
On the energy sector specifically, scenario modelling to 2050 across multiple world regions found that achieving net-zero energy emissions under continued economic growth would require annual improvements in technology intensity consistently above 10%. The highest single-year improvement ever recorded was 3.3%, in 2015–2016, a year often celebrated as proof that decoupling was finally happening at scale. Achieving the required rate every year for 25 consecutive years, across all regions, while continuing to grow the global economy, has no historical precedent. The only scenarios in which emission reductions are large enough are those in which economic growth is also significantly lower, or negative.
The structural reasons are not mysterious. Rebound effects offset efficiency gains, studies find that efficiency improvements are offset by 78–101% through induced demand, Jevons’ paradox playing out in real time. Offshoring moves carbon-intensive production across borders without removing it from the atmosphere. Services are not immaterial: data centres, logistics, finance, all sectors carry comparable climate and water footprints to manufacturing when measured on a full life-cycle basis. And the IPCC’s favoured mitigation scenarios still rely heavily on negative emissions technologies, such as carbon capture, bioenergy with carbon capture and storage, that do not yet exist at the scale assumed, and may never do so.
The data, read honestly and in full, does not tell the ecomodernist story. It tells a more difficult one: that the decoupling we have achieved is real but insufficient, concentrated in wealthy countries, often temporary, dependent on accounting choices that make rich nations’ footprints look smaller than they are, and nowhere near the rate required to stay within planetary boundaries while continuing to grow. The graphs look good if you choose the right country, the right time window, the right unit of measurement, and the right emissions boundary. Change any one of those choices and the picture changes with it.
That is not science. That is curation.
The third tactic operates at the level of knowledge production itself. It is the most sophisticated and the hardest to spot, because it mimics the form of science while quietly pre-loading the conclusions. Three moves: manufacturing the question, selecting the method, and choosing the proxy.
Good science requires that ideas be made testable. The ecomodernist research programme is skilled at demanding this of its critics while exempting itself. When degrowth economists claim that growth is structurally incompatible with planetary boundaries, the response is swift: show me the model, show me the falsifiable hypothesis.
Watch what happens when the formalization is actually attempted. A recent paper set out to formally test Kate Raworth’s doughnut economy model. The authors translated the doughnut into a measurable index, ran the regressions, and concluded that the predicted relationship does not hold. A clean falsification. Case closed.
Except look at what happened in the translation. The doughnut framework is built around two fundamentally different kinds of limits: a social foundation, below which people experience critical deprivation, and an ecological ceiling, beyond which Earth-system processes become dangerously destabilized. These are not symmetric. Crossing a planetary boundary can trigger non-linear system change. Falling short of a social standard is terrible but does not restructure the atmosphere.
The paper measures none of this. Instead it uses the coefficient of variation (CV) across normalized indicators as its measure of imbalance. The CV captures whether different indicators are dispersed from each other. It does not capture ecological overshoot. And the normalization does not use planetary boundaries as goalposts. It uses arbitrarily chosen endpoints. A country at exactly the planetary boundary for CO₂ scores wherever it happens to fall on the authors’ normalized scale. The threshold disappears from the analysis.
We now know exactly what proper doughnut measurement looks like, because Fanning and Raworth published it in Nature last year. Their framework measures ecological indicators against actual planetary boundary thresholds, with the pre-industrial Holocene baseline as zero. The results are specific: chemical pollution is currently 3,174% beyond its planetary boundary. Species extinction 900% beyond. CO₂ concentration 94% beyond its safe limit. These are not dispersion statistics. They are threshold violations. Meanwhile the richest 20% of countries, with 15% of world population, contribute more than 40% of annual ecological overshoot while experiencing only around 2% of global social shortfall. The poorest 40% hold 63% of global social shortfall while contributing 4% of ecological overshoot. This distributional structure is the analytical heart of the doughnut argument. The CV cannot see any of it.
There is a further problem. The method assumes that low CV is the desirable state. But a country could achieve low CV by being uniformly bad on everything. Equal misery scores as balanced. The paper’s own authors acknowledge this. The formalization does not just simplify the theory. It reverses it.
The demand for testability is routinely weaponized against structural critique. If you want to be taken seriously, you must formalize. When you formalize, you must simplify. When you simplify, you lose what makes the theory interesting: the asymmetry between social and ecological limits, the role of planetary boundaries as hard thresholds, and the distributional structure that shows who overshoots and who goes without. Strip those out and you can falsify the skeleton while leaving the substance untouched.
The same paper uses the Economic Freedom of the World index, produced by the Fraser Institute, as its measure of capitalism. The index combines property rights, sound money, trade openness, and regulatory scope into a single score. A country can score highly because it has strong institutions and reliable rule of law, while also having a large welfare state and extensive environmental regulation. The index bundles together features that theorists of capitalism would treat very differently. What was measured was not capitalism. It was a particular composite of market institutions that correlates imperfectly with what the degrowth literature means when it identifies capitalism as the driver of ecological overshoot. The proxy does not match the concept. The test does not test the hypothesis. And yet the conclusion circulates as a falsification of degrowth.
This pattern is pervasive. Carbon intensity per unit of GDP stands in for ecological impact, erasing absolute scale. GDP per capita stands in for well-being, erasing distribution. Each substitution is individually small. Accumulated across a research programme, they systematically tilt findings toward the incumbent paradigm.
Move three: manufacture uncertainty where there is consensus
Where the scientific evidence is inconvenient, the ecomodernist research programme emphasizes uncertainty and the need for more research. Where the evidence for the preferred view is thin, optimistic projections are presented as established findings.
The Fanning and Raworth data make the gap visible. While global GDP more than doubled between 2000 and 2022, the median level of ecological overshoot increased from 75% above the planetary boundary to 96% above it. Social shortfall improved modestly. But to eliminate it by 2030 would require rates of improvement nearly five times faster than current trends. To stop ecological overshoot by 2050 would require immediately reversing direction and accelerating nearly twice as fast the other way. These are not gaps that innovation is closing. They are gaps the current growth trajectory is widening.
The survey of over three thousand researchers we discussed earlier is revealing here too. Green growth endorsement is strongest among economists and weakest among Earth and Planetary Scientists. The single strongest predictor of endorsement was not familiarity with the decoupling literature. It was the prior belief that growth is necessary for human well-being. The research programme has a systematic tilt, reinforced by funding structures, journal hierarchies, and the paradigm-conformity effects already described. The incentive structure does the work that explicit bias does not need to do.
Honest research would measure ecological performance against actual planetary boundaries, not arbitrary normalized endpoints. It would separate social shortfall from ecological overshoot rather than collapsing them into a dispersion statistic. It would use consumption-based rather than production-based accounting. It would ask not just whether the global average is improving but who is overshooting and who is going without. And it would acknowledge that the historical record of genuine green growth is, as Infante-Amate and colleagues have shown across 200 years of data, essentially anecdotal.
The rules of the research game, like the rules of the economy, were written by humans. The question is always: which humans, and in whose interest.
There is much more to say. But the pattern should be clear by now. Be critical of what is presented as progress. Ask which country, which time window, which indicator, which threshold. The question behind every graph is always the same: who chose this picture, and why?
In an age of overshoot, the fight is not only over policy. It is over what counts as evidence, what counts as progress, and who gets to define reality.
Take care,
Hans