December 9, 2025
Overview
To determine if Instacart is experimenting with pricing, and if so, just how costly it is for shoppers, Groundwork Collaborative, Consumer Reports, and More Perfect Union conducted an independent experiment involving 437 shoppers in live tests across four cities.
Executive Summary
Two shoppers walk into the exact same grocery store, at the exact same time, and pick up the exact same box of Cheerios. Then, they head to the cash register to check out. This sounds like the opening to one of those “three guys walk into a bar” jokes — but there is nothing funny about this punchline.
The first shopper is charged $4.99. She pays and leaves the store with her box of cereal. The second customer steps up to the register and is charged $6.12. He’s ticked and tells the cashier that he, too, should pay $4.99, just like the woman in front of him. His response is understandable. Customers expect to pay the exact same price, for the exact same item, and his experience violates our shared understanding of how pricing for essential products like groceries is supposed to work.
But increasingly, this scenario is no longer hypothetical, it’s real. In fact, the proliferation of new pricing practices and technologies has upended pricing transparency. Fair pricing is no longer a guarantee in the cereal aisle or anywhere else. Our research suggests that companies like Instacart — the focus of this study — are developing, acquiring, and perfecting technology to experiment with pricing, at scale.
These new strategies are pervasive in the growing online grocery sector, with $10 billion in sales in a single month in 2025 and more than 60% of U.S. households reporting they have purchased groceries online.1 At a time when food price inflation outpaces overall inflation, and Americans report that the price of groceries is their number one cost concern, pricing experiments used by companies like Instacart are making the situation worse.
The proliferation of new pricing practices and technologies has upended pricing transparency.
To determine if Instacart is experimenting with pricing, and if so, just how costly it is for shoppers, Groundwork Collaborative, Consumer Reports, and More Perfect Union conducted an independent experiment involving 437 shoppers in live tests across four cities. Researchers assisted shoppers in simultaneously adding items from a specific grocery store to their Instacart shopping carts, but they stopped short of making the purchase. Researchers measured the prices displayed to each shopper and how much those prices varied from one shopper to the next. The results demonstrate how companies could quietly and opaquely charge different customers different prices for the same groceries:
- Almost three quarters (74%) of grocery items in the experiment were offered to shoppers at multiple price points on Instacart. The platform offered as many as five different sales prices for the exact same grocery item, in the exact same store, at the exact same time. A dozen Lucerne eggs sold for $3.99, $4.28, $4.59, $4.69, and $4.79 on Instacart at a Safeway store in Washington, D.C. A box of Clif Chocolate Chip Energy bars (10 count) sold for $19.43, $19.99, and $21.99 on Instacart at a Safeway store in Seattle.
- Of those items that we found Instacart experimented on, the average difference between the lowest and highest prices was 13%. Some shoppers found grocery prices that were up to 23% higher than prices available to other shoppers for the exact same items, in the exact same store, at the exact same time. A box of Signature SELECT Corn Flakes (18 ounce) on Instacart from a Safeway store in Washington, D.C., sold for $2.99, $3.49, and $3.69, with the highest price 23% greater than the lowest one.
- Researchers found that overall Instacart basket totals varied by an average of about 7% for the exact same items from the exact same locations, at the exact same time. The exact same basket of groceries on Instacart from a Safeway store in Seattle, cost some shoppers $114.34, while other shoppers were shown $119.85 and $123.93. At a Target store in North Canton, Ohio, shoppers were shown different prices — $84.43, $84.81, $84.92, $87.91, and $90.47 — for the same basket of groceries.
- Based on the average of about 7% difference in basket totals and the amount that Instacart says the average household of four spends on groceries in the U.S., that could translate into a cost swing of about $1,200 per year.2
Corporate practices like these increase prices for American families. When prices are no longer transparent, shoppers can’t comparison-shop. When prices are no longer predictable, shoppers can’t properly budget. These increasingly opaque pricing practices aren’t just blowing a hole in families’ wallets. Fair and honest markets are the bedrock of a healthy economy — and companies like Instacart are jeopardizing that trust.
Same Cart, Different Price: Instacart’s Price Experiments Cost Families at Checkout
To determine if Instacart is experimenting with pricing, and if so, just how costly it is for shoppers, Groundwork Collaborative, Consumer Reports, and More Perfect Union conducted an independent experiment involving 437 shoppers in live tests across four cities.
Introduction
Milkmen and their ice chests were commonplace in neighborhoods in the 1960s.3 Schwan’s yellow delivery trucks and their frozen goods were an American icon in the 1970s.4 Pizzas and Chinese food have been widely available for delivery for decades. But, in the last decade, Silicon Valley companies like Instacart, Amazon Fresh, and Uber Eats have dramatically changed the speed, cost, and availability of food delivery.
The online grocery industry reached $10 billion in sales in a single month this year, and more than 60% of U.S. households report having purchased groceries online at some point.5 Today, consumers can even order a gallon of milk on Instacart from a Samsung smart refrigerator the moment they realize they are running low.6
Instacart, founded in 2012, is one of the largest grocery delivery and pickup service platforms in the U.S. It partners with national retailers, such as CVS and Ulta Beauty, as well as major grocers like ALDI, Costco, Kroger, and Safeway. When a customer places an order for delivery or pickup through the Instacart platform, the company typically transmits the order to a gig worker, dubbed an “Instacart shopper,” who then fulfills the assignment, collecting the items in the store for pickup, or loading them into a vehicle and delivering them to the customer. In some stores, in-house staff fulfill online orders instead of independent contractors.
In 2022, Instacart’s business model underwent a fundamental change with the acquisition of a tech company called Eversight, whose AI technology enabled Instacart to start experimenting with prices.7 Instacart claims its Eversight pricing software can increase grocery store sales by 1% to 3% and “incremental margins” — the extra profit a company gets from each additional sale — by 2% to 5%.
In a section of its website titled “Eversight: Optimize your pricing with AI,” Instacart advertises its Eversight tools as a way to “continuously drive growth with dynamic pricing.”8 Instacart’s CEO reiterated this on a 2024 earnings call, explaining that new AI-powered pricing algorithms help “to really figure out which categories of products our customers [are] more price sensitive on” and set prices “based on that information.”9 For Instacart’s retailers and brands, the question of when and how much to adjust prices is answered, in large part, by automated experiments on everyday, unknowing shoppers.10
Also on their website, Instacart says that its new pricing tools allow retailers and brands to “target offers” to customers based on whether they are a new or existing customer, how close they are to a competing store, their offline behavior (i.e., in-store shopping habits), and even the weather.11 The company has the capability to use demographics like age, sex, household size, household income, buying behavior, purchasing history, and frequently shopped stores as factors in their experiments.12 This wealth of data has helped Instacart build an automated software program for price optimization — or the science of analyzing customer data to determine exactly how much the company can charge. Most shoppers are unaware that they are the guinea pigs in Instacart’s experiments. The company says:
End shoppers are not aware that they’re in an experiment. For any given shopper in any given store, prices only change on a few of the products they shop and only by a small margin; it’s negligible. But at scale across a store network, those small changes create an orthogonal array of data points that changes the game.13
Translating the corporate-speak, the takeaway is that consumers won’t notice they are being experimented on, and that Instacart is implicitly acknowledging that this could translate into valuable data for the company. For shoppers, these changes could add up, too. Just as new data points could lead to more profits for Instacart, small price increases could add up to big costs for family budgets.
Most shoppers are unaware that they are the guinea pigs in Instacart’s experiments.
Instacart’s pricing practices mean less predictability and little transparency for shoppers. At a moment in which food price inflation outpaces overall inflation, and Americans report that the price of groceries is their number one cost concern, Instacart’s pricing experimentation is making the situation worse. Our findings are one indication of just how much worse.
Methods
This study asks: how are the pricing practices of online grocers, like Instacart, impacting shoppers? To answer this question, a team of researchers at Groundwork Collaborative, Consumer Reports, and More Perfect Union developed a method to test whether different Instacart shoppers were seeing the same prices for the same groceries and, if not, how large the price differences were. Instacart was chosen because of its market dominance in the United States as an e-commerce grocery delivery platform with nearly 300 million orders in 2024 alone.14 The company is, by its own admission, “the largest online grocery marketplace in North America.”
Across five separate tests in September 2025 involving 437 participants, researchers studied the prices of a basket of goods offered at five grocery stores on Instacart: two Target stores and three Safeway stores. For these tests (four were conducted online; one was conducted in-person), shoppers selected a set basket of items and captured screenshots of the prices they found in real-time.
We also performed an additional test to determine which grocery retailers showed evidence of price fluctuations via the Instacart app. This confirmation test, conducted with 88 volunteers in November 2025, evaluated the prices for two products at 15 different retailers and found evidence of similar price experimentation at Albertsons, Costco, Kroger, and Sprouts Farmers Market. This confirmation test does not inform the final calculations, but the results of this final test underscore the price variability evident throughout this study.
Participant Recruitment and Data Collection
Researchers recruited shoppers from a base of active Consumer Reports members, emailing consumers who had previously participated in at least one community research project with the organization. The team also recruited participants more widely, using Consumer Reports’ social media channels and members from a nonprofit journalism organization, More Perfect Union.
Participants signed up for one of four different Consumer Reports-hosted tests, which were conducted remotely through online video conferencing software in September 2025.15 The tests focused on four stores in Seattle; Washington, D.C.; Saint Paul, Minnesota; and North Canton, Ohio.16
For these tests, shoppers joined online video conferences where they were instructed on how to create an account for Instacart, if they didn’t have one; enter a particular store address; and select the option for in-store pick-up. (To eliminate concerns about how delivery services might impact item costs or basket totals, this study focused on grocery orders that could be picked up at the store, rather than delivered to a home address.17) Then, researchers helped shoppers find and add between 18 and 20 specific items18 to their shopping carts. At the end of each hour-long test, participants were asked to capture screenshots of the prices they found in real-time, submit those screenshots, and complete a survey about their basic demographics and shopping history.19
In addition, researchers recruited in-person study participants with the help of a local nonprofit to conduct a similar shopping test of the Instacart platform for a Safeway store in Washington, D.C..20 For this test, which was co-hosted by Groundwork Collaborative and More Perfect Union, researchers and participants gathered in a conference room about a mile from the store and simultaneously used their phones or other devices to shop online for groceries. In this case, the geolocation of participants was not a variable. The participants were physically close to one another and followed the same method of shopping on the Instacart platform as in the previous virtual tests. In the end, the results of the conference room test were indistinguishable from the findings of the video conferenced tests.
A total of 437 people from across the U.S. reported their Instacart pricing data, and after removing incomplete or incorrect files, 193 of those submissions were cleaned, processed, and included in the analyses.21
Data Analysis
The research team processed up to eight screenshots for each of the 193 participants (179 online and 14 in-person) by first confirming that the screenshots showed the correct store and location and the correct products. Then, researchers entered sales prices,22 original prices,23 and total basket prices into a database and merged them with participants’ survey responses, which included demographics and shopping history. The team did not collect information about taxes or service fees associated with any Instacart order.
To evaluate whether prices differed among participants for the same items or basket totals, we measured the prevalence and size of price variations. When price variation was present, the first step was to identify its nature.24 For each of the five shopping tests we conducted, we computed (a) the difference in total basket prices across participants; (b) the number of total basket prices observed; and (c) the difference between the maximum and minimum basket totals. We then identified how many distinct price tiers existed and how participants were distributed across them. In addition, we repeated this step for each item in each test. We computed (a) the spread of sales prices across participants; (b) the number of unique sales prices observed; and (c) the difference between the maximum and minimum prices.
In cases of price variation, we sought to understand whether the data we had collected about individual shoppers could explain the differences. To assess whether shopper characteristics such as age, race, gender, and income could explain differences in total basket prices, we compared average sales prices at both the basket level and the item level between groups of shoppers defined by frequency of Instacart use, age, race, gender, and income. We completed tests on group means to assess whether any observed differences were likely to be real or could simply reflect random variation.
We also used regression models at both the basket and item levels. At the basket level, the models tested whether shopper characteristics predicted differences in the total price of the basket. At the item level, the models included product fixed effects so that the comparisons were between shoppers looking at the exact same items. Two sets of regressions were estimated. In the first, we included only Instacart shopping history measured in two ways: (a) as a single binary variable for “ever used” versus “never used,” and (b) as two binary variables for “used sometimes” and “used often,” with the “never used” category omitted. This strategy allowed us to test whether prior experience with the platform alone explained price variations. In the second set of models, we added demographic controls (age, income, gender, and race) to assess whether these characteristics, when considered together, influenced basket or item prices. This stepwise approach distinguished the regression analyses from the t-tests. While t-tests compared average prices between individual groups, the regressions assessed whether any observed differences persist after controlling for multiple factors simultaneously.25 Across both model specifications, the differences associated with Instacart use and demographics were small and not statistically meaningful.
Our participant pool is not representative of the U.S. population. But this study’s findings are robust and offer a meaningful contribution to understanding how new digital technologies are being used to limit pricing transparency and stability for consumers.
Findings
Significant Number of Shoppers with Higher Prices
Across all tests, researchers found that Instacart quoted prices to some consumers that were up to 23% higher than those quoted to other consumers for the exact same grocery item from the exact same location, at the exact same time. In total, researchers found that Instacart basket totals varied by an average of about 7% for the exact same items, from the exact same locations, at the exact same time. A household of four will spend roughly an extra $1,200 per year for groceries on Instacart if they are exposed to the average fluctuations in total basket prices observed in this study.26
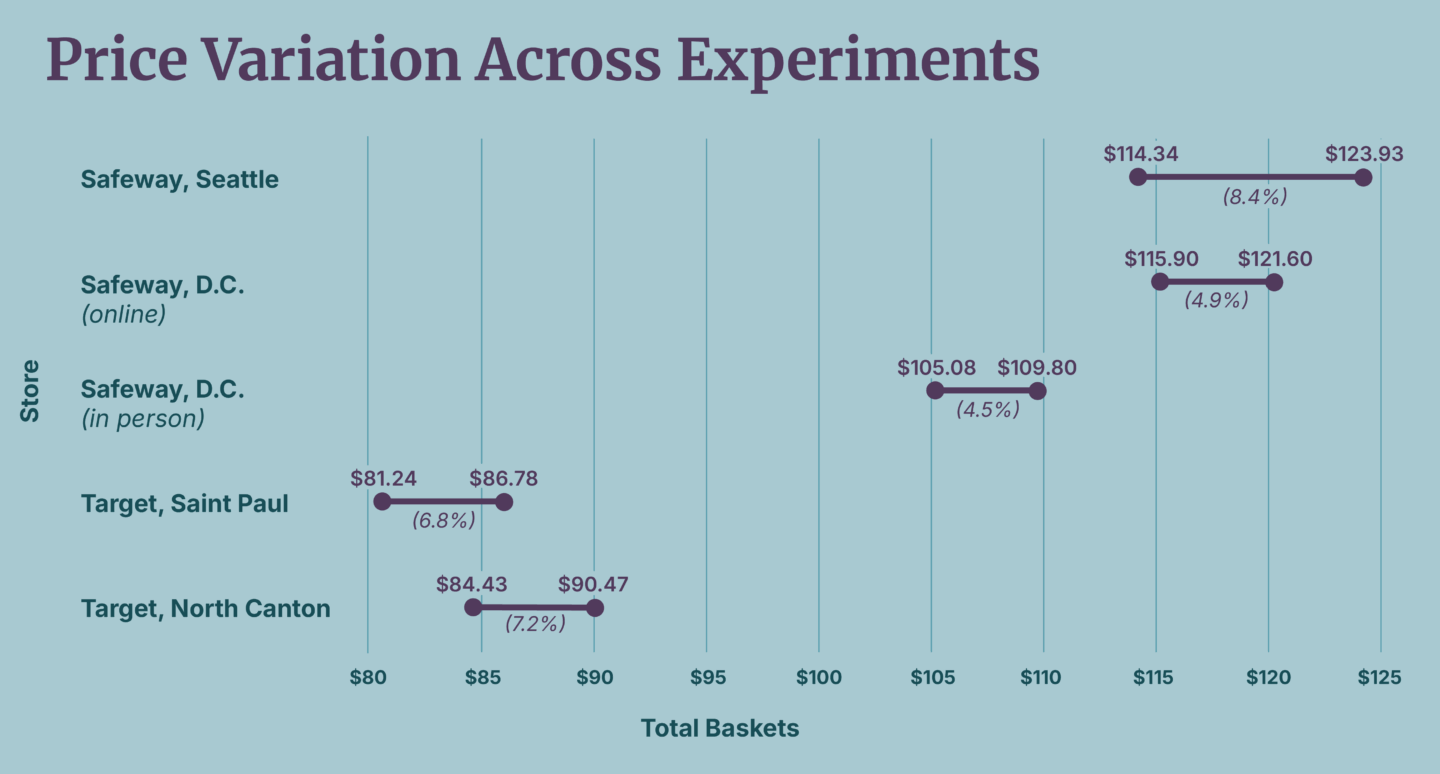
The same basket of grocery items on Instacart from a Safeway store in Seattle cost some shoppers $114.34 while others saw prices of $119.85 and $123.93. Eight percent of shoppers in our test had the lowest basket total. By contrast, 92% of shoppers would have paid more for the exact same groceries. Of this group, some shoppers saw a total bill that was roughly $10 more than shoppers with the lowest bill.
Instacart priced a basket of groceries from one Safeway in Washington, D.C., at $116.40 for some shoppers, while many others saw totals of $119.30, $119.40, or $121.60. For another Safeway in Washington, D.C., shoppers were shown $105.08, $108.51, or $109.80 for the same basket.
Price differences also occurred at a Target in North Canton, Ohio. Thirteen percent of shoppers saw a total of $90.47 while 21% of shoppers were shown an amount of $87.91 for the same items. Nearly 63% received the lowest prices — $84.43 or $84.81 for the same goods.
Even when selecting the exact same items online, at the exact same store, and at nearly the exact same time, shoppers routinely found multiple prices for the same item. Instacart presented prices to some shoppers that were higher across most categories while other shoppers were shown lower prices.27 As a result, shoppers were clustered into what we call “distinct price groups,” in which shoppers received identical item prices, and therefore, identical totals for their baskets of groceries.
Even when selecting the exact same items online, at the exact same store, and at nearly the exact same time, shoppers routinely found multiple prices for the same item.
At a Target in Saint Paul, Minnesota, nearly all shoppers fell into one of seven price groups.28 Roughly one quarter of shoppers saw the lowest total, $81.24. For nearly another quarter of shoppers, the basket price was $83.82. Five percent were presented with the highest price, $86.78. All shoppers at the highest price point that day saw the exact same item prices — from oats and chips to cereal and pasta.29
The distribution of shoppers across pricing groups differed from store to store. In some cases, 20% of shoppers had the lowest basket price; in other cases, only 8% of shoppers received the lowest price. Additionally, we found that the number of distinct price groups was not uniform. Some stores had as few as four distinct price groups. Despite these variances, researchers found conclusive evidence that Safeway and Target shoppers on Instacart were routinely sorted into distinct price groups.
Multiple Prices for Each Item
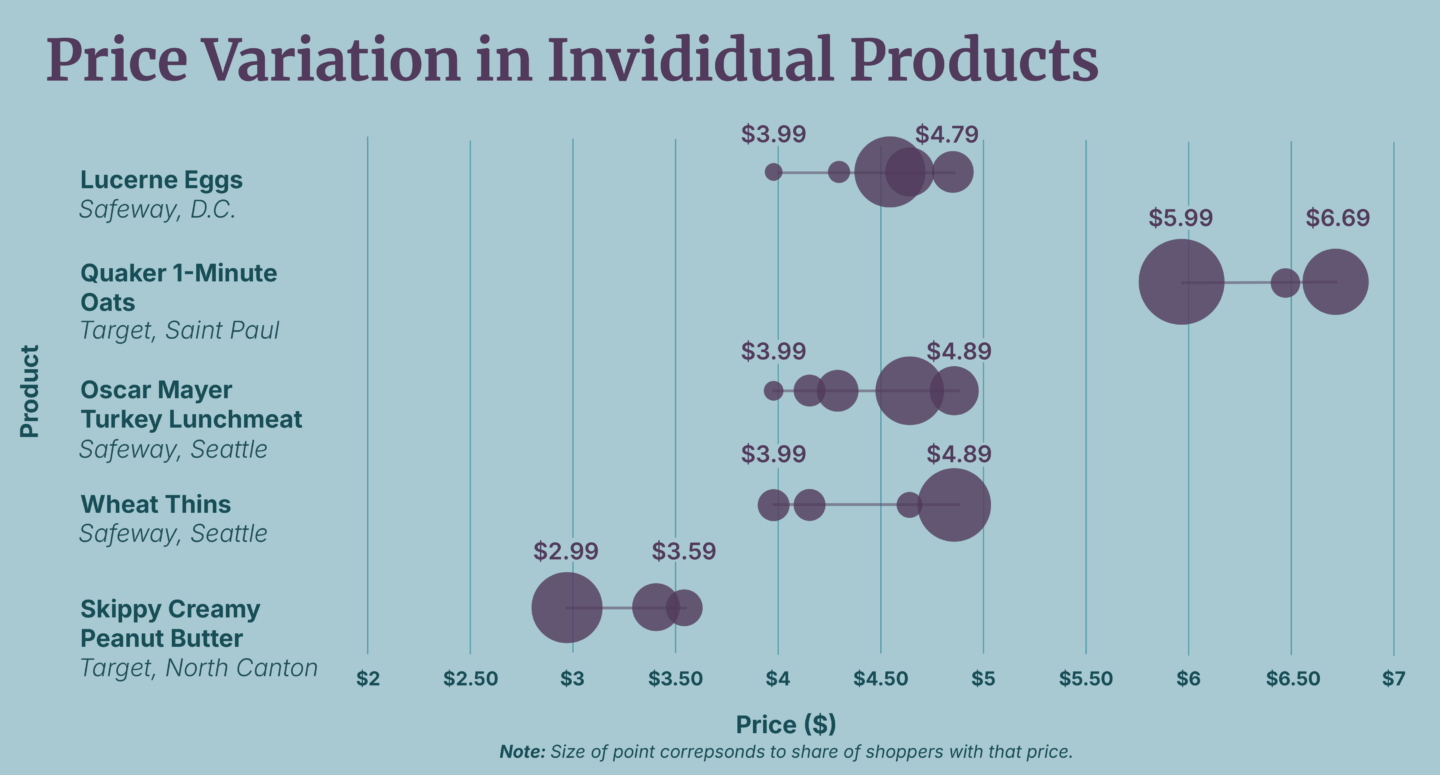
Instacart offered as many as five different sales prices for the exact same grocery item, in the exact same store, at the exact same time. This investigation revealed that 74% of Instacart grocery items had different prices for different shoppers. Of those, the average difference between the lowest and highest prices was 13%. A dozen Lucerne eggs sold for $3.99, $4.28, $4.59, $4.69, and $4.79 on Instacart at a Safeway store in Washington, D.C, with some shoppers seeing prices 20% more than others. On a different day, at a different Safeway in Washington, D.C., a box of Signature SELECT Corn Flakes (18 ounce) sold for $2.99, $3.49, and $3.69, with the highest price 23% greater than the lowest.
Across all stores, shoppers found nine items priced up to 23% higher than the prices shown to other shoppers for the exact same item, in the exact same store, at the exact same time. These top items included:
- Skippy Creamy Peanut Butter (23% increase between shoppers at a Safeway in Seattle; 20% increase between shoppers at a Target in North Canton, Ohio)
- Wheat Thins Original Crackers (23% increase between shoppers at a Safeway in Seattle)
- Oscar Mayer Deli Turkey (23% increase between shoppers at a Safeway in Seattle)
- Signature SELECT Corn Flakes (23% increase between shoppers at two different Safeway stores in Washington, D.C.)
- Signature SELECT Saltine Crackers (23% increase between shoppers at two different Safeway stores in Washington, D.C.)
- Honeycrisp apple (22% increase between shoppers at a Safeway store in Seattle; 20% increase between shoppers at a Safeway store in Washington, D.C.)
- Lucerne eggs (20% increase between shoppers at a Safeway store in Washington, D.C.)
- Good & Gather Farfalle Pasta (20% increase between shoppers at a Target in Saint Paul, Minnesota and at a Target store in North Canton, Ohio)
A box of Wheat Thins Original Crackers (9 ounce) had at least four different prices at a Safeway store in Seattle. The price was $3.99 for 8% of shoppers, while the price for another 8% of shoppers was $4.31. Instacart priced the crackers at $4.69 for 22% of shoppers while 62% of shoppers received the highest price of $4.89. This last price was 23% greater than the price presented to the group that got the lowest price. At the same Safeway, Oscar Mayer Deli Turkey (9 ounce) sold on Instacart for five different prices: $3.99, $4.31, $4.59, $4.69, and $4.89. Close to a quarter — 23% — of shoppers in our test received the top price.
In North Canton, Ohio, a Target store on Instacart priced a box of Good & Gather Farfalle Pasta at $1.19, $1.39, and $1.43. About a quarter (24%) of shoppers were given the lowest price, while 13% of shoppers received a price that was 20% higher at $1.43. On Instacart, the same Target store priced a box of Premium Original Saltine Crackers (16 ounce) at $3.99, $4.59, and $4.69. Thirteen percent of shoppers paid the highest price for this kitchen staple.
Variable Item Discounts
In some cases, Instacart displayed an item with the same sales price but different original prices, suggesting that promotions or discounts may have been used to make a sales price look like a deep discount. For instance, all shoppers found the same sales price of $4.99 for a bottle of Heinz Ketchup (20 ounce) at a Washington, D.C., Safeway on Instacart on September 10, 2025. But some shoppers saw an original price of $5.29, while others saw original prices of $5.34, $5.39, or $5.59. Similarly, on September 4, 2025, all shoppers at a Seattle Safeway found Premium Saltine Crackers (16 ounce) listed on Instacart for $3.99. But some shoppers saw original prices of either $6.69, $5.99, or $5.93 for the crackers. Why some consumers were given the impression they were receiving a greater discount was unclear.
Company Responses
In October and November 2025, we reached out to the companies mentioned in the study. Instacart said in a statement that “some consumers may see slightly higher prices for certain items and lower prices for others; however, most customers see the standard price.” The company also said its price experiments don’t use any personal or demographic data and noted that customers are randomly assigned to price test cohorts by product category and location. But Instacart said that consumer-packaged good companies, or CPGs, who use Instacart’s advertising product, “may use behavioral data…to inform discounts or promotional offers.” In a statement, Instacart said: “Affordability has always been at the heart of Instacart’s mission, helping people access the nutritious food they need from the retailers they love. Retail partners set and control their prices on Instacart, and we work closely with them to align online and in-store pricing wherever possible. Instacart is always transparent about pricing.”
“Just as retailers have long tested prices in their physical stores to better understand consumer preferences, a subset of only 10 retail partners — ones that already apply markups — do the same online via Instacart. These limited, short-term, and randomized tests help retail partners learn what matters most to consumers and how to keep essential items affordable,” Instacart wrote in the statement.
In a statement, Target said it has no business relationship with Instacart and that it “does not directly share any pricing information with Instacart or dictate what Instacart prices appear on their platform.” In response, Instacart subsequently acknowledged that it scrapes Target’s publicly displayed prices and charges an additional amount to offset its “operating and technology costs.” Instacart said that at the time of our testing they were evaluating how much to charge for those costs but that the Target price “tests have now ended.” Safeway (which is owned by Albertsons), Costco, and Kroger did not respond to questions about Instacart’s price experiments. Sprouts declined to comment.
Policy Landscape
Online grocery delivery has transformed the idea of retail convenience — but Instacart’s algorithmic pricing potentially turns that convenience into unpredictable pricing. Shoppers rightly would be outraged if they were charged more than the customers behind them in the grocery checkout line. For the consumer, Instacart’s pricing tools appear to adjust costs inexplicably, charging different consumers different prices for identical items in real time. Our findings suggest that this is not an anomaly, but a consistent pattern built into Instacart’s pricing model. Instacart, in a response to the findings, did not dispute that they use price optimization but asserted that their pricing fluctuations are randomized and do not use “customer characteristics.” This pricing model is a choice, not a requirement. Technology, combined with data collection, allows for price adjustments based on granular, personalized information.
Policymakers have taken notice. Several efforts at the state and federal level aim to address pricing practices like Instacart’s or potential harms that could arise from the use of Instacart’s pricing technology. In 2024, the Federal Trade Commission (FTC) issued orders to eight companies seeking information on their services or technologies that enable surveillance pricing. A preliminary report found that third-party intermediaries had the ability to set different prices for different products based on granular, individual inputs.30 While the investigation was shelved by the Trump administration, legislators in states across the country have introduced and passed laws that address algorithmic and surveillance pricing.
Administrative
The FTC could take action under Section 5 of the Federal Trade Commission Act, which prohibits unfair methods of competition. In outlining what constitutes unfair competition, the FTC in 2022 pointed to legislative history that suggested unfair pricing may include “price discrimination not justified by differences in cost or distribution,” which appears to match Instacart’s pricing experiments and fluctuations.31 Similarly, under Section 5, the FTC could bring enforcement cases, initiate rulemaking, or issue informal guidance on these pricing strategies as an “unfair or deceptive practice,” a consumer protection standard.32 Many states have versions of the same laws and authorizing language and could pursue remedies at the state level.
The FTC and state enforcers with the relevant legal authority could initiate investigations of Instacart for its pricing experiments, including a careful examination of its practice of seemingly showing different “original” prices to different consumers while charging them the same “sale” price, making discounts for some consumers look larger than others. This practice may run counter to the FTC’s guidance on deceptive pricing, which explains that pricing can be deceptive if a consumer is offered a discount or markdown, but the original price is “fictitious.”
Federal
In July 2025, Rep. Greg Casar (D-Texas) introduced the Stop AI Price Gouging and Wage Fixing Act, federal legislation that would ban the use of automated decision systems setting individualized prices based on personal data or behavior. The bill would direct the FTC to enforce the ban and provide a private right of action for enforcement. The bill explicitly exempts loyalty programs and other broad-based discounts and price-setting practices from the ban. The legislation would also apply a similar framework for wage setting.
State
Several states have introduced legislation to address various algorithmic pricing practices.33 Recently, New York enacted a first-of-its-kind disclosure requirement, the Algorithmic Pricing Disclosure Act, which requires companies, with some exemptions, to include a prominent disclosure stating “THIS PRICE WAS SET BY AN ALGORITHM USING YOUR PERSONAL DATA.”34 While this might point researchers and enforcers to companies that deserve more scrutiny, disclosure may not be meaningfully helpful to consumers. The New York disclosure law does not detail what data about the consumer a company used or whether that information led the company to increase or lower the price, and it’s not clear what action, if any, a consumer could take upon seeing this disclosure.
Other states have introduced legislation that would go further and ban surveillance pricing outright. In Colorado, HB 1264, introduced by Reps. Javier Mabrey and Lorena Garcia, would have barred both surveillance price-setting and wage-setting, similar to the Casar legislation. The bill sponsors asked the House Judiciary Committee not to advance the bill after significant industry pushback. Georgia legislators also considered a bill to ban surveillance pricing and wages (SB 164), as did legislators in Illinois (SB 2255). In California, Assemblymember Chris Ward introduced AB 446, which would have barred the use of personal information to set prices.35 The bill was amended in the Senate Appropriations Committee, narrowing its focus to grocery stores using personal information to increase prices, and the sponsor decided to delay advancing the bill until 2026. In Pennsylvania, Representative Danilo Burgos, Chair of the House Consumer Protection, Technology & Utilities Committee, introduced HB 1942, which would model the original California legislation barring companies from setting prices based on personal information.36
Conclusion
This study reveals something that many shoppers have suspected for some time: When it comes to pricing, the ground has shifted right under their feet. Everything consumers thought they understood about pricing has changed. It’s not just that prices have gotten higher — although they certainly have. Today a basket of groceries costs 25% more than it did in 2020.37 Pricing also has become increasingly opaque, complex, volatile, and unpredictable — a highly engineered science that is detached from the true value of goods and services.
Companies are investing big to acquire new technologies and methods to optimize pricing based on decisions made by their black-box algorithms and sometimes on the experiments they run on consumers without their knowledge. These practices have eroded the idea of a single, transparent price — which has been the norm for more than a century, when haggling gave way to the price tag. When prices are no longer transparent, shoppers can’t comparison-shop. When prices are no longer predictable, shoppers can’t budget. These shifts exacerbate the problem of rising costs and make bargain hunting increasingly elusive. It’s increasingly difficult to find a fair price, let alone a deal.
Instacart says the price changes in their experiments are “negligible.” But families buy a lot of groceries, and grocery inflation is already an economic burden. When you add up the differences in prices this research found, the impact on families can be significant. Instacart’s pricing tactics alone could cost a household of four around $1,200 over one year — or more than a month’s rent in many American cities — based on Instacart’s own calculations for how much a household of four adults spends on groceries in a month.
Fair and honest markets are the bedrock of a healthy economy. Companies like Instacart offer great convenience, but they are increasingly pursuing corporate pricing practices that unfairly decouple the price of a product from its true cost. As more consumers learn about, and decry, these practices, perhaps companies will change course. But if they do not, policymakers should intervene and require them to change their practices.
Authors
Katie Wells
Katie J. Wells, Ph.D., is Director of Research and Senior Fellow at Groundwork Collaborative. She is a labor and policy expert who writes about how tech affects the way we live in cities, and especially how we govern them. She is a co-author of Disrupting D.C.: The Rise of Uber and the Fall of the City, which won awards from The Los Angeles Times and the American Association of University Publishers. Wells has a long record of designing and conducting qualitative research projects about the gig economy; this is her third report about Instacart.
Lindsay Owens
Lindsay Owens, Ph.D., is the Executive Director of the economic think tank Groundwork Collaborative and author of the forthcoming book, GOUGED: The End of a Fair Price in America. Widely known for her ability to communicate pressing economic concepts and arguments, Lindsay has been credited with changing the way we understand inflation by leading the charge to expose – and articulate – the role of firm pricing power and corporate profiteering in price increases. Previously, Lindsay served as a senior economic policy adviser to Sen. Warren, and deputy chief of staff and legislative director to Reps. Ellison and Progressive Caucus Chair Jayapal. She holds a Ph.D. from Stanford University and a Bachelor’s degree from the University of Pennsylvania.
Angel Han
Angel Han is the Campaign Manager for digital marketplace issues at Consumer Reports. She leads the Make the Price Right campaign to fight for fair pricing and stop companies from exploiting data at consumers’ expense. She has a MPH in Health Policy and Management from Columbia University Mailman School of Public Health.
Alan Smith
Alan Smith is Manager, Community Leadership for Consumer Reports, working with the Community Mobilization team to build consumer power by distributing leadership and investing in them as educators, organizers, storytellers and testers in their own right. He supports local leaders in building community and in building the power needed to reform marketplaces.
Acknowledgements
This paper was a partnership of Groundwork Collaborative and Consumer Reports as part of a larger project with More Perfect Union.
The data is courtesy of Consumer Reports Grocery Pricing Data © 2025 Consumer Reports, Inc.
The authors thank Tracy Anderman, Camille Calman, Sierra Cheatham, Liz Donovan, Eric Gardner, Grace Gedye, Alex Jacquez, Nayeon Kim, Derek Kravitz, Nia Law, Jayme Link, Debasmita Morgan, Elizabeth Pancotti, Agatha Pinheiro, Jen Shecter, Imari Stewart, Charisma Troiano, and Breyon Williams for their feedback and insights during the production of this report. Carol McCarthy provided copyediting, and Hailey Walsh provided graphic design.
Groundwork Collaborative, established in 2018, is an economic think tank that transforms the way people understand the economy. To win policies that create strong, broadly shared prosperity and true opportunity for all, we advance new narratives about what a good economy looks like. Groundwork’s unique tripartite structure — part communications shop, part think tank, and part issue advocacy organization — allows us to drive economic narratives with credibility, expertise, and impact.
Consumer Reports (CR) is a 6-million-plus-member, nonprofit testing, journalism, and advocacy organization with a track record of conducting participatory research that shines a light on problems in the consumer marketplace. Community Reports, the Participatory Science wing of CR, has completed participatory studies of home tap water quality, errors on credit reports, price variation on broadband bills, the usability of new data rights, and more. A similar research model has been applied to this study of the surveillance pricing economy by asking volunteers to enroll in this Instacart study and shop for the same items, at the same store, at the same time.
This work is made possible, in part, by a grant to Consumer Reports from the Alfred P. Sloan Foundation. Consumer Reports’ work on privacy, security, AI, price transparency, and financial technology issues is also made possible by the vision and support of the Ford Foundation, Omidyar Network, Craig Newmark Philanthropies, and Heising-Simons Foundation.
Notes
1: Bigora, Peyton. “Grocery E-Commerce Hits Record High Household Penetration.” Grocery Dive, August 14, 2025. https://www.grocerydive.com/news/grocery-ecommerce-online-sales-july-household-penetration/757641/.
2: Instacart estimates on its website that a family of four will spend $363 per person per month. The annual cost for a family, according to Instacart, is $17,424. See: https://www.instacart.com/company/ideas/average-grocery-cost-per-month/.
3: Knapp, Cathy. “From Farm to Front Porch: Remembering the Milkman.” The Indianapolis Star, July 20, 2015. https://www.indystar.com/story/news/history/retroindy/2015/07/20/farm-front-porch-remembering-milkman/30419783/.
4: Rembert, Elizabeth. “Schwan’s Delivery Trucks Are an American Icon. But Layoffs and a New Name May Shake That Image.” KCUR, April 29, 2024. https://www.kcur.org/news/2024-04-29/schwans-delivery-yelloh-name-change.
5: Bigora, Peyton. “Grocery E-Commerce Hits Record High Household Penetration.” Grocery Dive, August 14, 2025. https://www.grocerydive.com/news/grocery-ecommerce-online-sales-july-household-penetration/757641/.
6: Samsung U.S. Newsroom. “Samsung Joins Forces with Instacart to Enhance Kitchen Experiences Through Hallmark Innovation.” January 2, 2025. https://news.samsung.com/us/samsung-joins-forces-with-instacart-to-enhance-kitchen-experiences-through-hallmark-innovation.
7: Instacart Platform. “Eversight: Optimize Pricing with AI Experiments.” https://www.instacart.com/company/retailer-platform/connected-stores/eversight.
8: Instacart Platform. “Eversight: Optimize Pricing with AI Experiments.” https://www.instacart.com/company/retailer-platform/connected-stores/eversight.
9: The Motley Fool. “Instacart (CART) Q3 2024 Earnings Call Transcript.” November 12, 2024. https://www.fool.com/earnings/call-transcripts/2024/11/12/ instacart-cart-q3-2024-earnings-call-transcript/.
10: In-store pricing, which is outside the scope of this study, has also been a subject of interest for Instacart. In 2024, Instacart introduced proprietary shopping carts to retailers. Each cart, called a Caper Cart, has a digital screen that can display targeted offers and personalized ads based on a shopper’s geo-location within the actual brick-and-mortar store as well as on the history that the company has acquired on the shopper. Such strategies are not unique to Instacart, as Consumer Reports revealed earlier this year in a study about Kroger’s personalized coupons.
11: Instacart Docs. “Offer Structure.” September 30, 2025. https://docs.instacart.com/discounting_platform/offers/offer_structure/; Alexandra Pfeffer, “Instacart Makes It Easier for Customers to Save on Groceries with Acquisition of Eversight.” Eversight, September 1, 2022. https://eversightlabs.com/instacart-makes-it-easier-for-customers-to-save-on-groceries-with-acquisition-of-eversight; Montero, Michael, Jamie Eldredge, Daniel Gibson, David Moran, and Jamie Rapperport. Systems and Methods for Price Testing and Optimization in Brick and Mortar Retailers. Patent US 10,915,912 B2, filed October 10, 2018, and issued February 9, 2021. https://patentimages.storage.googleapis.com/96/e9/5a/bd499f84c605e1/US10915912.pdf.
12: “Instacart Welcomes Eversight!” Instacart Corporate Blog, September 1, 2022. https://www.instacart.com/company/updates/instacart-welcomes-eversight/.
13: Instacart Platform. “Eversight: Optimize your pricing with AIs.” https://www.instacart.com/company/retailer-platform/connected-stores/eversight. (italicized emphasis added).
14: Inklebarger, Tim. “Instacart stock takes a hit on soft earnings outlook.” Supermarket News. February 26, 2025. https://www.supermarketnews.com/finance/instacart-stock-takes-a-hit-on-soft-earnings-outlook.
15: Some people signed up but never shared their data.
16: The test stores were (a) Safeway, 3900 S. Othello Street, Seattle, Washington; (b) Safeway, 2845 Alabama Avenue Southeast, Washington, D.C.; (c) Target, 1744 Suburban Avenue, Saint Paul, Minnesota; and (d) Target, 4484 Dressler Road Northwest, North Canton, Ohio.
17: For the Target tests, participants entered the address of the store as the location for delivery.
18: One shopping test uses only 18 items in its analysis as two of the grocery products were unavailable at the time of testing; two other shopping tests use only 19 items as one of the grocery products was unavailable at the time of testing.
19: All research participants were tech-savvy enough to use Zoom video conference; access the Instacart website or app; submit answers through a SurveyMonkey form; take and upload screenshots; and multitask during a multi-modal online event — meaning they possessed a relatively high level of digital literacy.
20: This test was conducted at a Safeway store located at 415 14th Street Southeast, Washington, D.C. (The two tests for Washington, D.C. investigated distinct Safeway stores.)
21: While almost all submitted entries contained at least some relevant data, many of the entries did not have complete evidence for all tested products. Some volunteers were unable to complete the study because they were unwilling to create an Instacart account or had trouble with the process of shopping, taking screenshots, or submitting them. In some cases, shoppers had missing items in the screenshots they submitted. During the video conference, some shoppers indicated that they could not see an option for a particular grocery item via the app or a web browser. At other times, shoppers submitted a screenshot for the wrong size of a product (i.e., an 18 ounce box of Cheerios instead of the 8.9 ounce variety), the wrong quantity of a product (i.e., two boxes of pasta instead of one), or the wrong store location (i.e., a Target in Minneapolis instead of the one selected in Saint Paul).
22: Sales price refers to the cost of an item after any mark-down or discount is applied.
23: Original price refers to the cost of an item before any mark-down or discount is applied. On the Instacart platform, original prices are displayed with a “strike-through” font to indicate that they are not current.
24: None of the five tested stores had electronic shelf labels in September 2025 at the time of testing.
25: We did not complete this analysis for all participants as we did not collect shopping history for the Safeway tests.
26: Instacart estimates on its website that a household of four adults will spend $363 per person per month. The annual cost for a household, according to Instacart, is $17,424. See: https://www.instacart.com/company/ideas/average-grocery-cost-per-month/.
27: A caveat: Shoppers with the highest total basket price could sometimes see the lowest prices for particular products. One shopper, for instance, whose entire cart had the lowest price, had the highest price for Skippy Creamy Peanut Butter (16 ounce) and Signature Farms Baby-cut Carrots (16 ounce). In other words, distinct price groups may be reliable indicators of what kind of prices — higher or lower — a shopper sees for most but not all grocery items in their basket.
28: Three percent of shoppers had miscellaneous costs that were not duplicative of other shoppers and thus did not fit into a price group. A price group is defined as more than one shopper who receives the same prices for the same individual items and the same price for the same basket of items.
29: Sometimes those item prices were the same as those found in other price groups; sometimes the item prices were unique.
30: Federal Trade Commission. “FTC Issues Orders to Eight Companies Seeking Information on Surveillance Pricing.” July 23, 2024. https://www.ftc.gov/news-events/news/press-releases/2024/07/ftc-issues-orders-eight-companies-seeking-information-surveillance-pricing.
31: “Policy Statement Regarding the Scope of Unfair Methods of Competition Under Section 5 of the Federal Trade Commission Act Commission File No. P221202.” Federal Trade Commission, November 10, 2022. https://www.ftc.gov/system/files/ftc_gov/pdf/P221202Section5PolicyStatement.pdf.
32: “Federal Trade Commission Act Section 5: Unfair or Deceptive Acts or Practices.” Federal Trade Commission, n.d. https://www.federalreserve.gov/boarddocs/supmanual/cch/200806/ftca.pdf.
33: Tan, Cheyenne. “How U.S. States Are Tackling Algorithmic Pricing: 2025 Bill Tracker and Analysis.” Innovation at Consumer Reports, August 1, 2025. https://innovation.consumerreports.org/how-u-s-states-are-tackling-algorithmic-pricing-2025-bill-tracker-and-analysis/.
34: Tan, Cheyenne. “How U.S. States Are Tackling Algorithmic Pricing: 2025 Bill Tracker and Analysis.” Innovation at Consumer Reports, August 1, 2025. https://innovation.consumerreports.org/how-u-s-states-are-tackling-algorithmic-pricing-2025-bill-tracker-and-analysis/.
35: California Legislature. “AB-446 Surveillance Pricing (2025–2026).” California Legislative Information, August 30, 2025. https://leginfo.legislature.ca.gov/faces/billNavClient.xhtml?bill_id=202520260AB446.
36: Legislative Data Processing Center. “House Bill 1942 Information; 2025-2026 Regular Session.” The Official Website of the Pennsylvania General Assembly, October 16, 2025. https://www.palegis.us/.