
For almost five years, I was a product manager in San Francisco’s Office of the Chief Data Officer (often called DataSF). Some of my role was managing the Open Data Program: essentially getting departments to share their data with the public, building the infrastructure to do so, and helping the public get the most out of that data. I was always baffled at how expensive all the technology seemed to be, and why nobody seemed to realize or care. I couldn’t help but think of Lucille Bluth Banana Quote from Arrested Development.
“It’s one open data portal Michael, how much could it cost, $1,000,000?
In May 2026, I was laid off from the city. I had free time and a theory that open data portals could not be as expensive as they were quoted. So, I built my own. My theory was correct, but the order of magnitude surprised even me.
While you might not know what “Open Data” is, you probably interact with it every day. From earthquake information provided by the USGS, to weather data from NOAA, to GTFS transit feeds that tell you when your bus or train will arrive, government agencies share critical data that affects your daily life. To facilitate this exchange of information, they use Open Data Portals: platforms that allow anyone to search for and download government data for free. And while the data they give away is free, the portals they procure are far from it.
Federal government resources are probably the most obvious examples, but there are many forms of Open Data woven into daily life. In this essay, I’m going to focus on local and county-level portals and why they are so expensive. Every time you read about crime rates, housing production, or traffic citations, there’s a good chance the reporter pulled that data from an Open Data Portal.
Overall, they are extremely useful. But with all the add-ons and upsells, they are just not a good deal.
As many government employees and civic technologists have talked about over time, and I witnessed firsthand, when buying technology, at almost no point is there any negotiation or pushback on the price. Local governments are the ultimate price takers. Beyond proving that something is necessary, it seemed that the government was more than willing to stretch their budgets and magically find more money instead of pushing back on prices to a vendor.
On the local level, finding out how much cities are paying for open data portals is usually just a public records request away. This is how we know that Oakland spends $78,575 a year and we estimate that San Francisco is spending upwards of $233,000 ($1,628,590 for a 7-year contract).
And because San Francisco is generous enough to also publish their usage statistics, we can calculate the raw platform costs. These are Compute, Storage, Bandwidth, and Fixed costs.
Applied to San Francisco’s actual portal (930 published datasets, and 120,685,801 recorded accesses in the twelve months ending August 2026, according to the city’s own published usage logs) the arithmetic comes out like this:
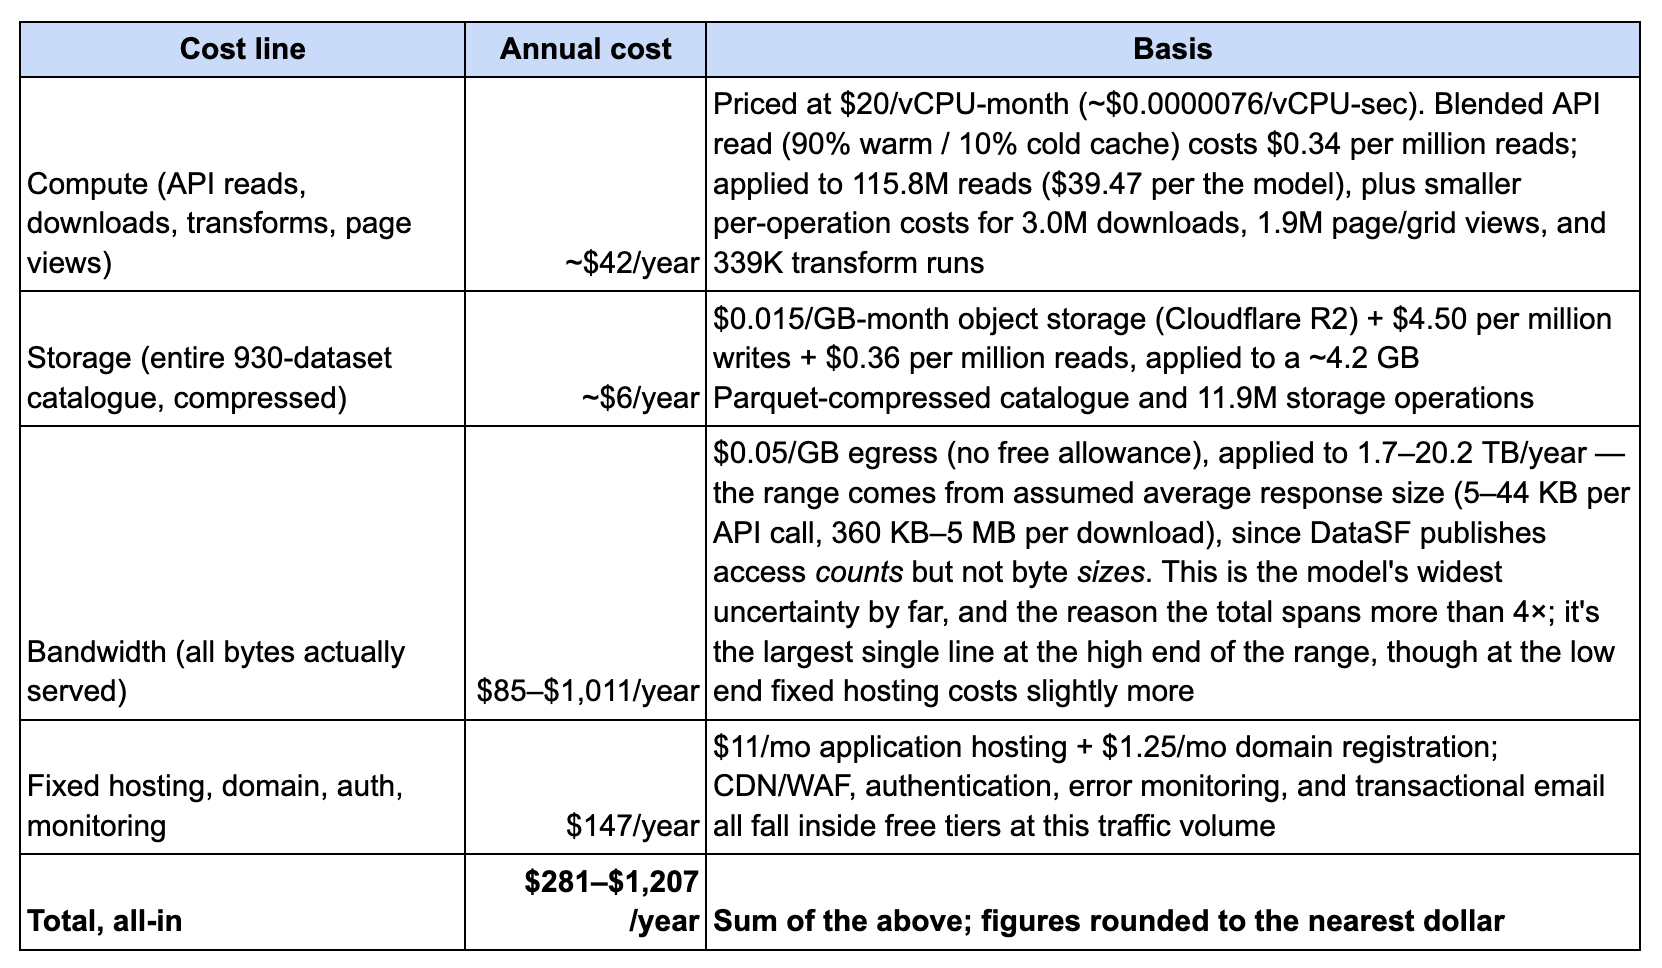
So, at first blush, San Francisco is paying ~200x for their portal service, is not great. And while I don’t have Oakland’s usage numbers, if we assume it’s similar to SF, it’s 65x the cost. Still not ideal. This alone would make me question my decisions on portal procurement. But it’s admittedly not entirely fair. There are other costs associated with data portals other than just the technology stack.
So, let’s look at a specific company. Open data portal provider Socrata, and Tyler Technologies, the GovTech conglomerate who bought it.
At the time of the Socrata sale, the company was public about its numbers: roughly 150 employees, about 1,300 government customers, and around $25 million in annual revenue. Let’s call it $19,000 in revenue per client.
Tyler Tech on the other hand is a $2.3-billion-a-year, 7,600-employee public company that folded Socrata into a division it calls “Data & Insights” (broken out financials not disclosed). To get around this, I built a model using what I think are defensible assumptions:
That Data & Insights has roughly doubled its client base since acquisition, to around 2,600, and
That per-client revenue climbed to about $35,000.
Critically, I scaled employee headcount up in step with the client base too, from 150 to 300
Here’s what that looks like:
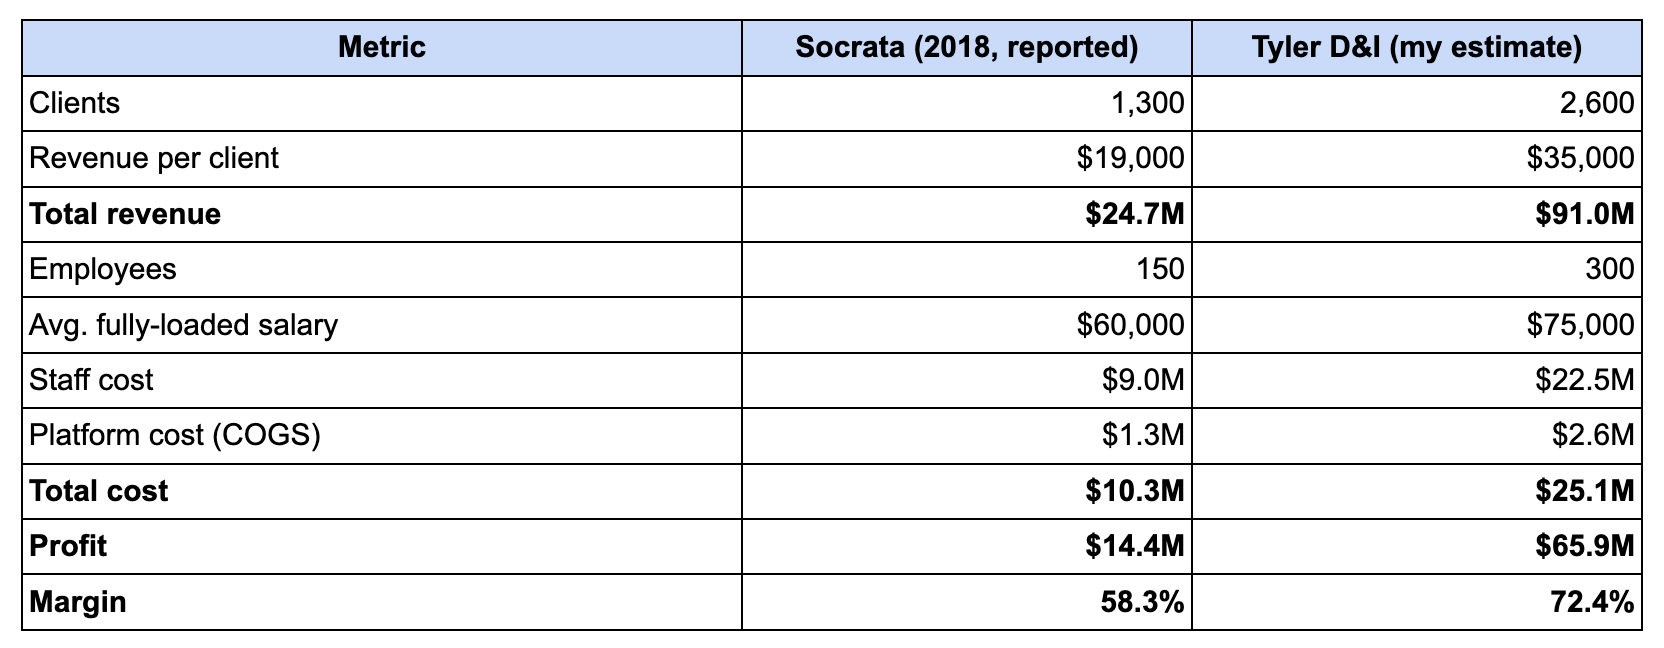
Even with headcount doubling right alongside the client base the model still lands at a 72% margin on the “Data & Insights” business.
With these estimates, the open data business is dramatically more profitable than the company selling it. That’s not proof of anything nefarious, it’s what a pricing category with almost no competitive pressure looks like, sold to buyers who don’t push back on price.
It could almost certainly be done for less, and still be a very good business.
There’s an obvious rebuttal to all of this: just self-host something open source. CKAN (the platform quietly running data.gov, the UK’s data.gov.uk, and dozens of national and city portals around the world) is free, powerful, and has been doing this job at serious scale for over a decade.
But costs don’t just magically disappear. Free software doesn’t mean a free portal. CKAN is real infrastructure: Python, PostgreSQL, Solr for search, background workers, and a deployment that needs someone who actually knows what they’re doing. Somebody has to install it, patch it, upgrade it when a dependency has a security hole, and be reachable when it goes down because a reporter is hammering the API the night before an election. The cost shifts from the vendor to your own headcount.
Open source is a genuinely good option for larger, well resourced jurisdictions or even small cities that are lucky enough to have a talented tech worker (one person can really make a huge difference). If it works, it really works, but it is not the right fit for everyone.
If you’ve read all the way here, genuinely, thanks!
And if, as you read this, you are thinking, “wow, this guy is doing a great public service by educating us on the price-gouging in a corner of the government that I knew nothing about without any ulterior motive”, I’d recommend that you stop reading now.
Because, as I mentioned earlier, I do have an ulterior motive. I built an open data portal product and I hope it competes with the one your town is currently using. It is live at Reliquery.net and you can see my demo portal at Danalytics.reliquery.net.
If it’s any consolation, it is priced so that almost any city or county could use it for a little over $2,000 a year. It’s not free, it doesn’t have all the (mostly useless) bells and whistles that other portals have, but it will do the job at a fraction of the price.
I hope people take me up on the offer. But even more, I hope cities stop paying so much for a substandard product.
I made a lot of assumptions and estimates in doing this analysis, so I have a few caveats and notes:
The infrastructure model is mine, not theirs. It’s measured on my own stack, at list-rate cloud pricing, applied to San Francisco’s real traffic. It’s a lower bound on what the job requires, not a claim about what Socrata’s or Tyler’s internal costs actually look like.
Bandwidth is the single biggest uncertainty in the whole model. San Francisco publishes access counts, not response sizes, so I had to estimate average payload sizes rather than measure them directly. That one estimate is what stretches the total from $281 to $1,207.
I don’t have a verified, itemized breakdown of San Francisco’s $1.6M Tyler contract. The circumstantial evidence on the open data portal is strong, but I can’t rule out the contract bundles other Tyler products alongside the open data platform.
The Tyler “Data & Insights” financial model is an estimate, not a disclosed figure. Tyler doesn’t break out that division’s revenue, headcount, or client count anywhere I could find. I built it to be defensible, and sourced Socrata numbers as the 2018 baseline, headcount scaled with client count, and checked it against Tyler’s actual company-wide margins as a sanity check. It’s still a model of a private number, not the number itself. It could be completely wrong
I only have hard invoice numbers for two cities. San Francisco and Oakland. I made public records requests to many others, and the response rate was not great. Everything about how representative they are of the broader market is an inference, not a sample.
If you work with open data, procurement, or GovTech contracts and think I got something wrong I’d genuinely like to hear it. This entire piece started because I thought a number looked wrong and decided to check. I’d rather be corrected than be confidently incomplete.