This is part three of a discussion about variance in golf that I’ve been working on for months. That work is done, but I’m breaking it up into three parts so it will be a bit more easily digestible. I’ve been trying to build toward something throughout the three-part series and we’re finally here.
Part one was about how hole design transforms uniform dispersion patterns into different probabilistic outputs.
Part two was about visualizing variance: how we can show strategic tradeoffs by illustrating risk-adjusted strokes-to-hole.
Part three is about what we mean by “good shots” and “bad shots,” and illustrates why the two different frameworks divide the golf community.
A few concepts from the previous posts will be relevant here. We discussed how architectural features act as dispersion pattern transformations, creating outcome distributions that differ wildly from input distributions. This creates the potential for shots that miss their target to end up with good outcomes. Keep that in mind; it will be relevant. I also discussed how applying risk premiums to expected values on a golf hole illustrates its underlying strategic design. We will do something similar here, but instead of looking at general risk premiums, we will focus on conditional risks associated with good shots versus bad shots.
Here, I want to focus more on ideas – specifically, how we think about what a “good shot” and a “bad shot” actually are. The difference, I think, underlies some of the most pervasive debates in golf architecture. Differing views on this can even shape the types of strategic and penal design we see on a golf course.
I will use the same example hole as I did in the last article: an homage to #4 at the Lido (the Channel Hole).1
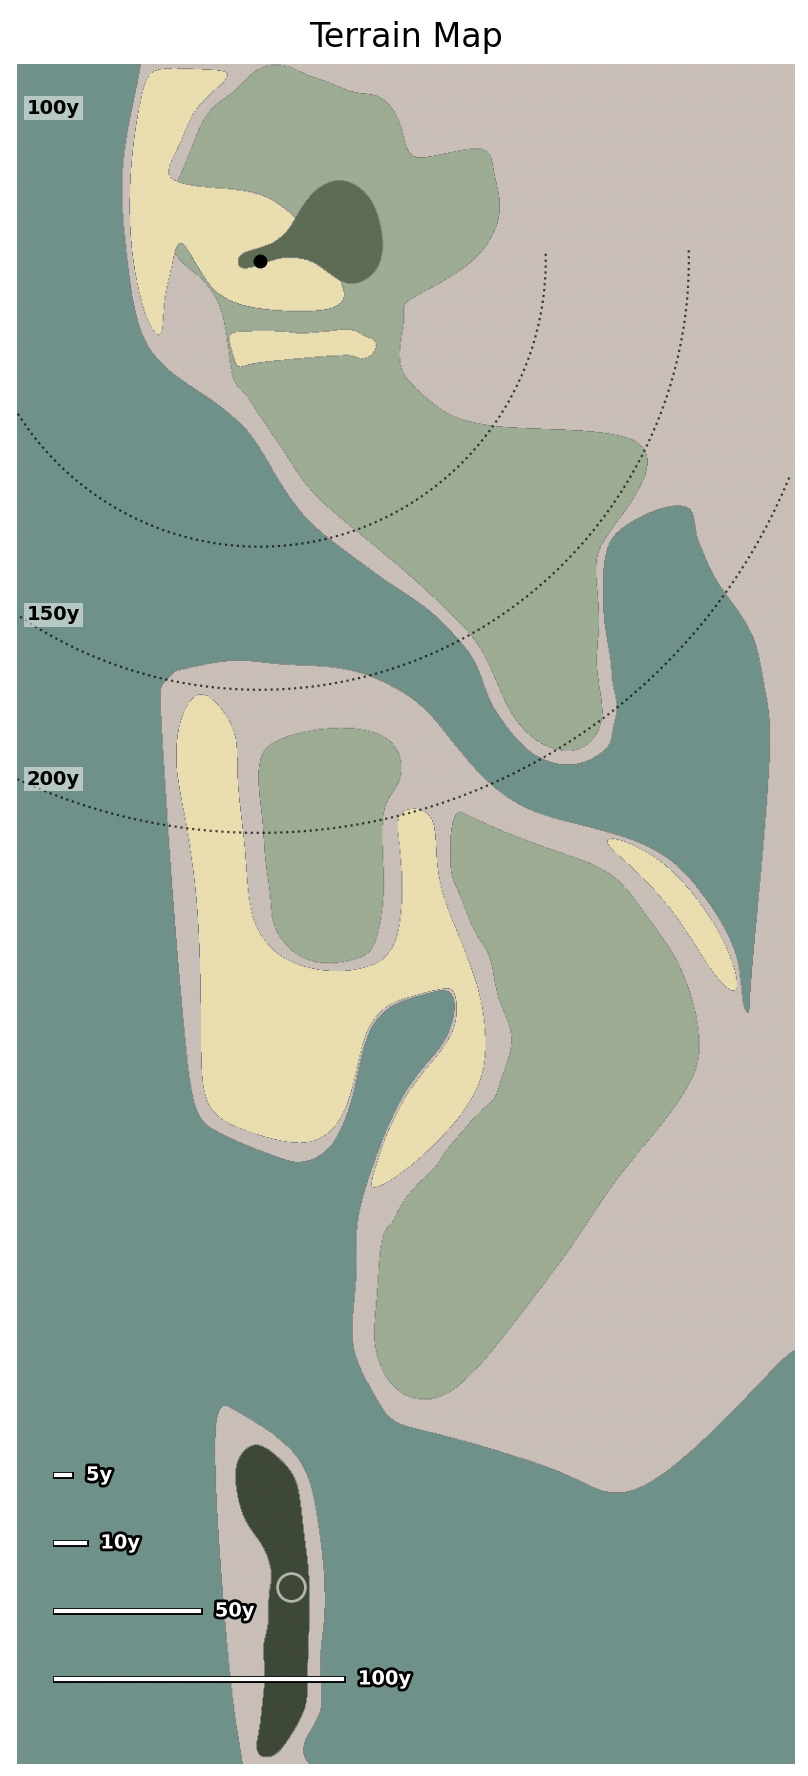
A player with a two-stroke lead on the last hole of a tournament will be particularly concerned with the expected downsides of a bad shot when playing to different areas of the hole. If the expected value of a dangerous area of the fairway is bogey, that might mean a good shot yields birdie while a bad shot yields triple-bogey. Conversely, it could also mean the golfer probably makes bogey regardless of whether they hit a high- or low-quality tee shot. The only way to tell which outcome is likely is to break apart our averages and look at the conditional effects of hitting a good or bad shot.
I will do my best to explain, but describing these illustrations will be a bit complicated if you haven’t read previous articles on the golf architecture visualizer I’ve been building:2
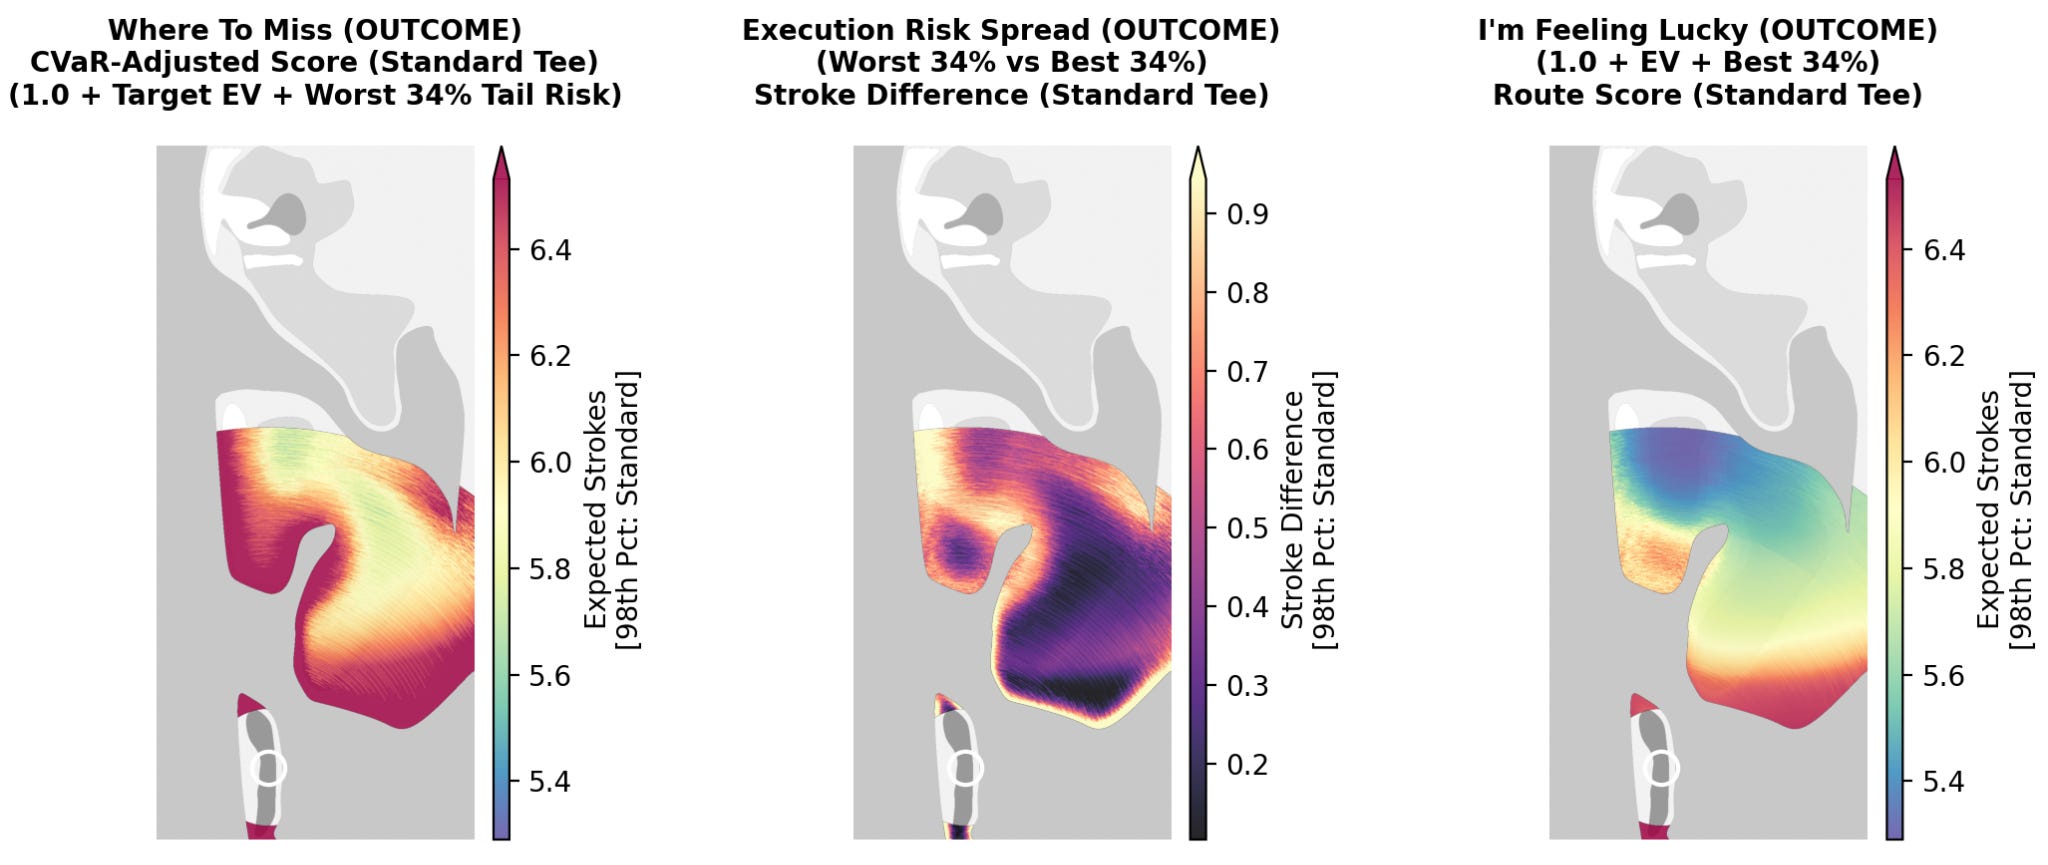
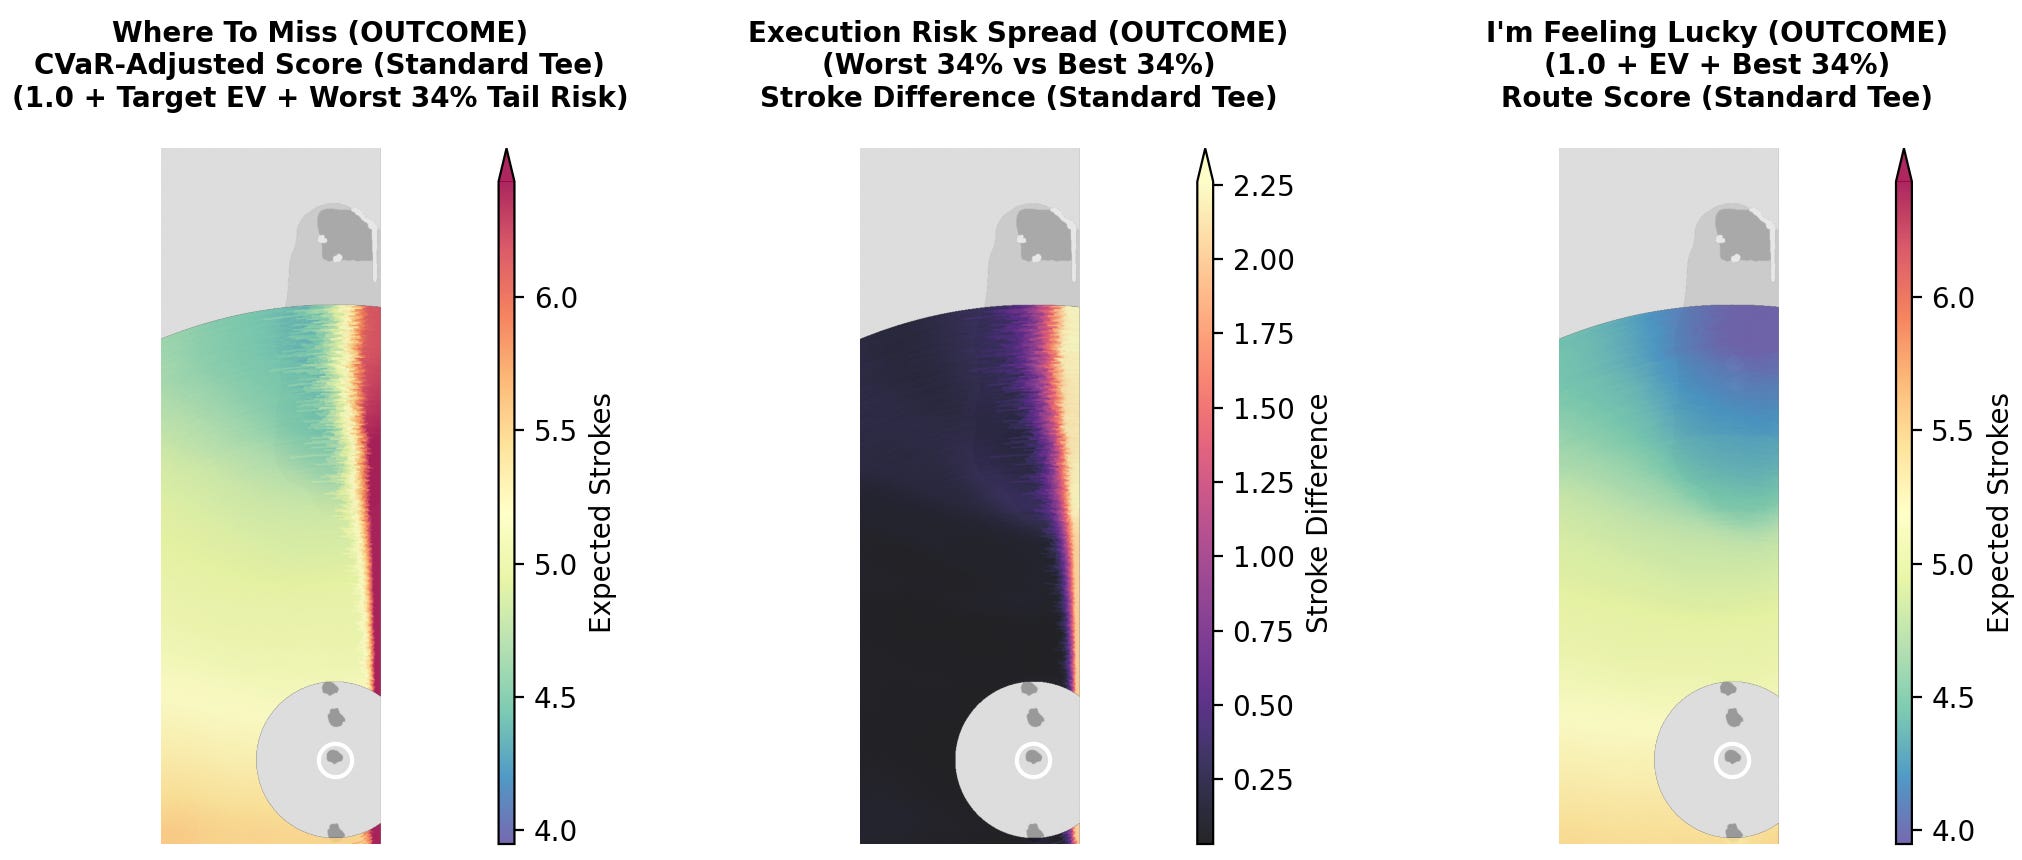
If we look at the first map, “Where To Miss” (left), each pixel shows the expected strokes to hole for the worst shots in the dispersion pattern. Technically, this represents the worst third of results from the dispersion pattern. This grouping includes everything from extremely terrible results to just below-average results. This illustrates a kind of worst-case scenario and, consequently, the best places to aim if we expect to hit a “bad shot.”
In contrast, the “I’m Feeling Lucky” map (right) does the opposite. This illustration averages the best third of our dispersion pattern at each pixel, which provides a best-case scenario for each target and shows us where to optimally play if we expect to hit a “good shot.”
Finally, the middle illustration is the “Execution Risk Spread” map. It just shows us the difference between the other two maps. It highlights the most consequential targets – places where a good result most improves our score compared to a bad result. These are the places with the highest expected downside risk.
The results above seem pretty straightforward. The “Where to Miss” and “I’m Feeling Lucky” maps show that distance is important for score (even in worst-case scenarios). The “Execution Risk Spread” map suggests the most important decision to prevent downside risk is to never aim close to water… or so it seems.
What if I told you that, yes, in a sense this is helpful information, but in another sense I’ve completely bungled this analysis? The entire point of this article is that these ideas aren’t so simple, but they are philosophically interesting.
There is, in fact, a completely different way to calculate these three maps. The way you choose to do this calculation will say a lot about your philosophy on how you view the game of golf.
So remember, the illustrations above only looked at the shots in a dispersion pattern with the best and worst results. However, the shots chosen in those dispersion patterns have nothing to do with where the player aimed, just where the ball ended up. If a player aims directly at a bunker in the middle of a fairway, the “good results” will all land in the fairway and the “bad results” will land in the bunker. Sure, this might mean that the target is “consequential,” but it offers little useful information about strategy: who is going to aim straight at a bunker?!?
If we’re trying to create a system to help us know where we should aim, we need to focus on accurate and inaccurate shots, not just good and bad results. To do that, we need to recalculate these maps using accuracy as our central variable.
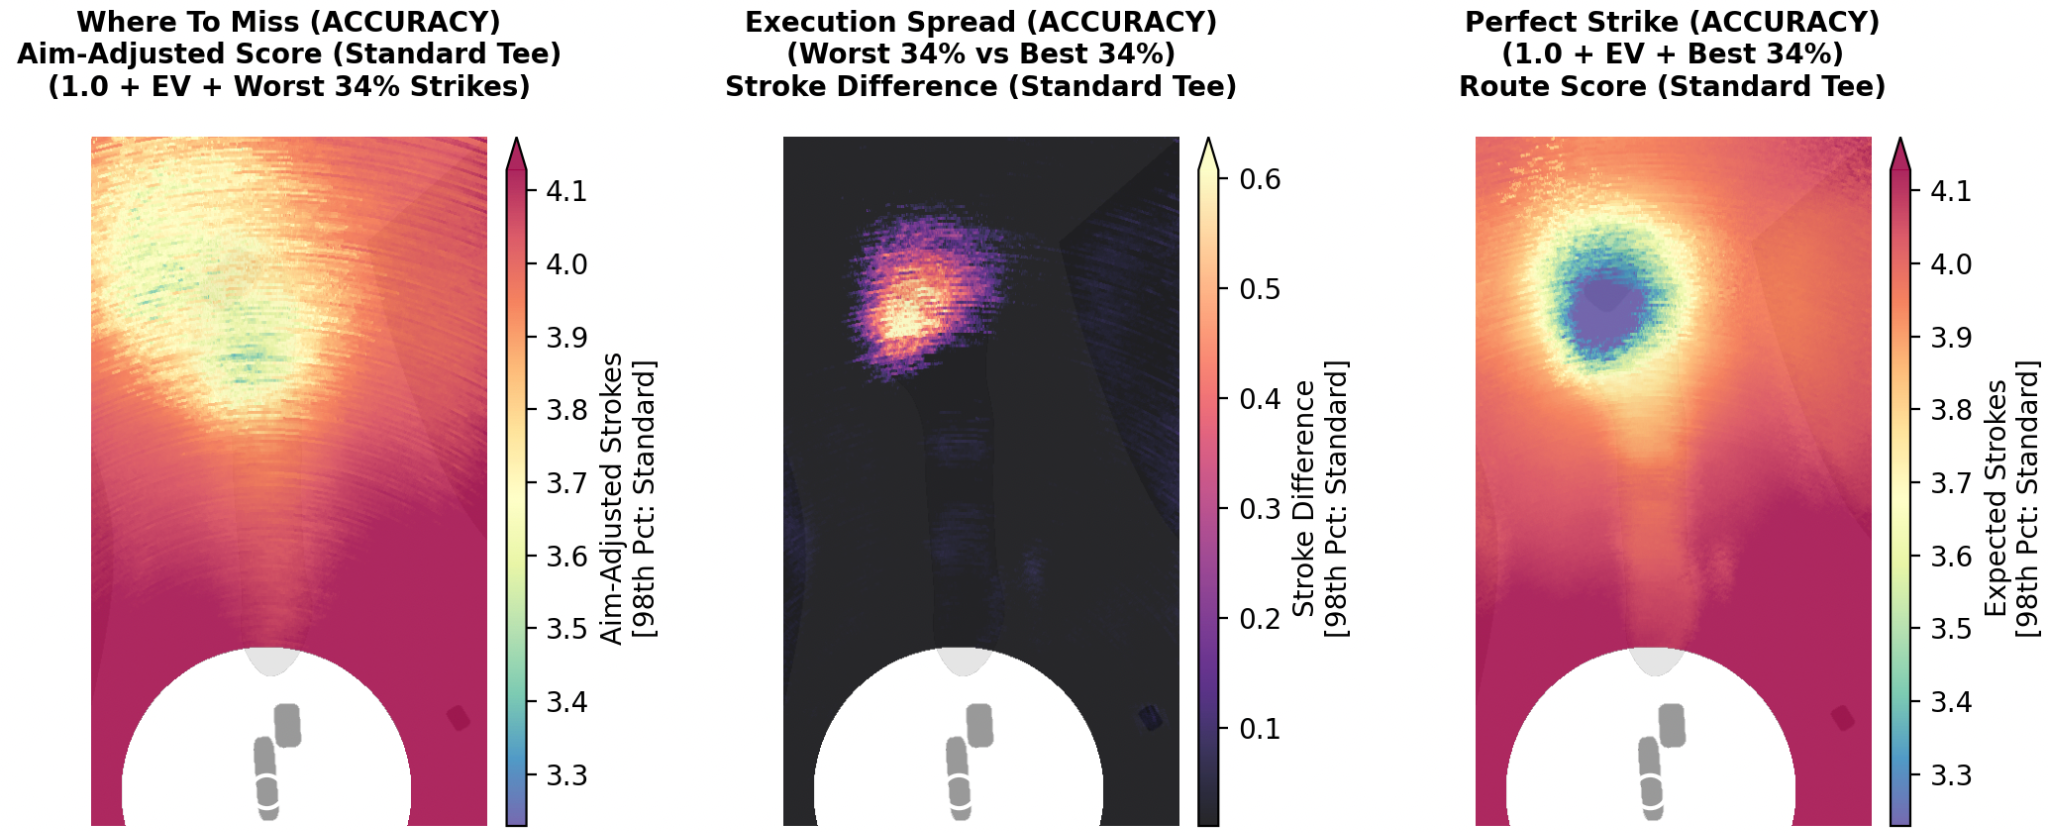
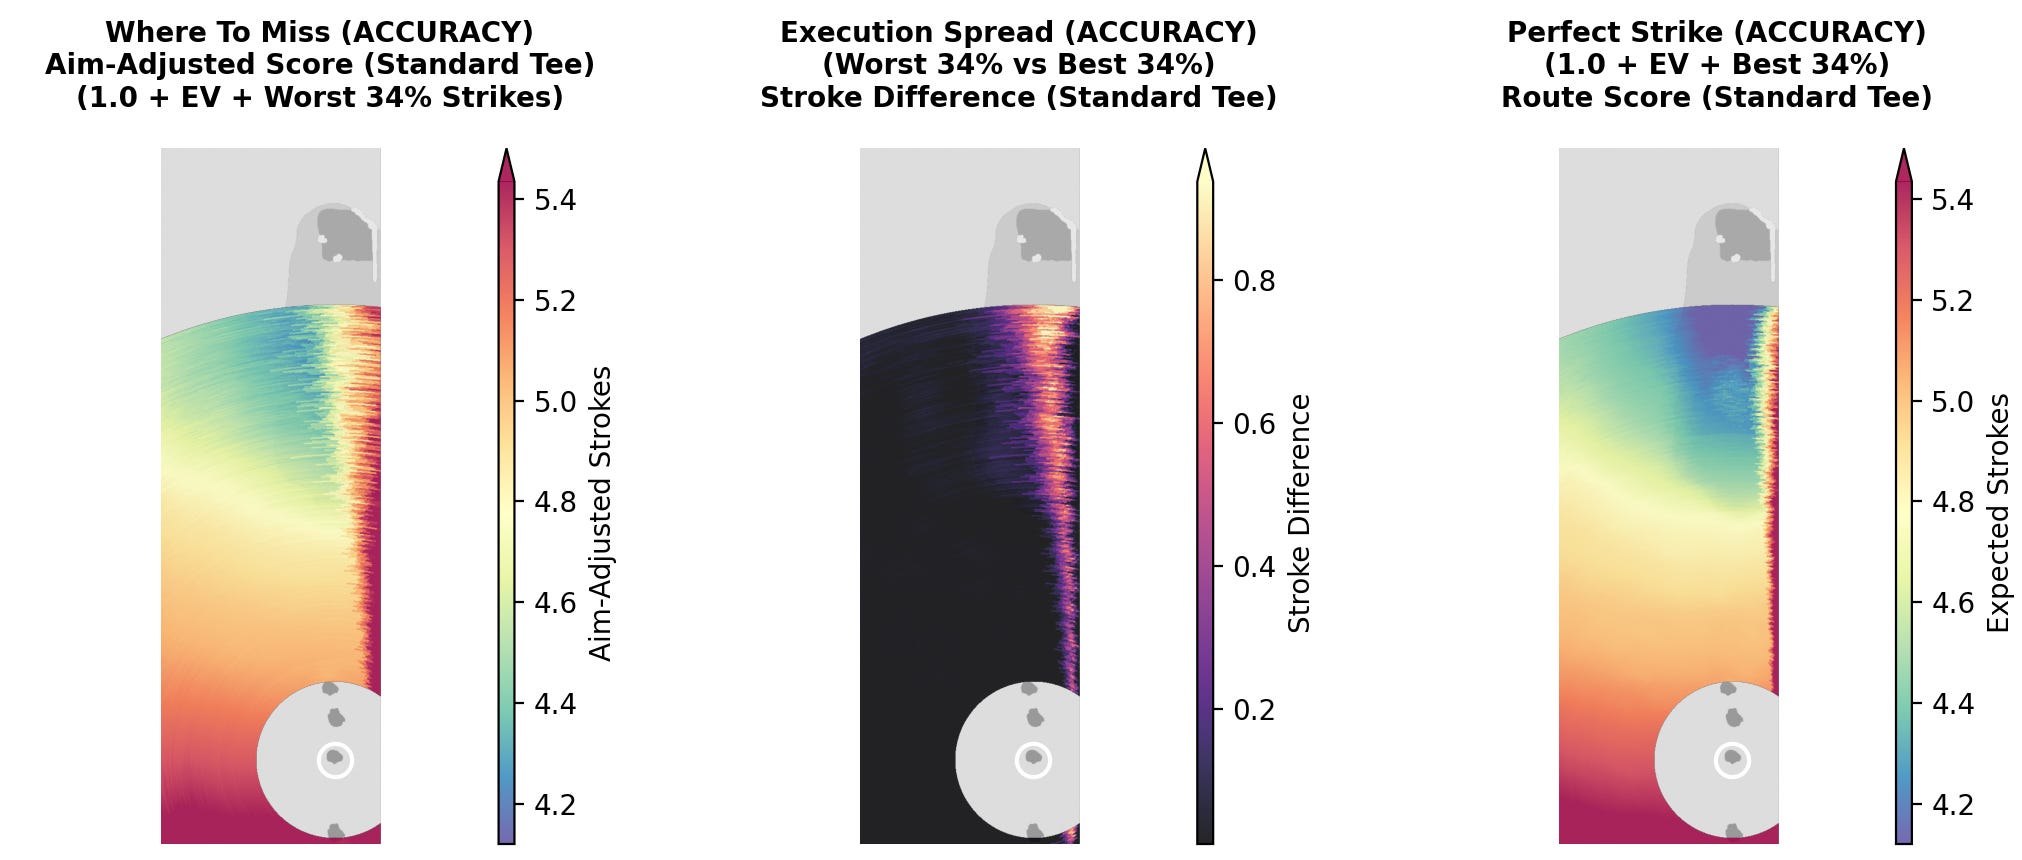
When we recalculate the results using accuracy the new illustrations look like this:
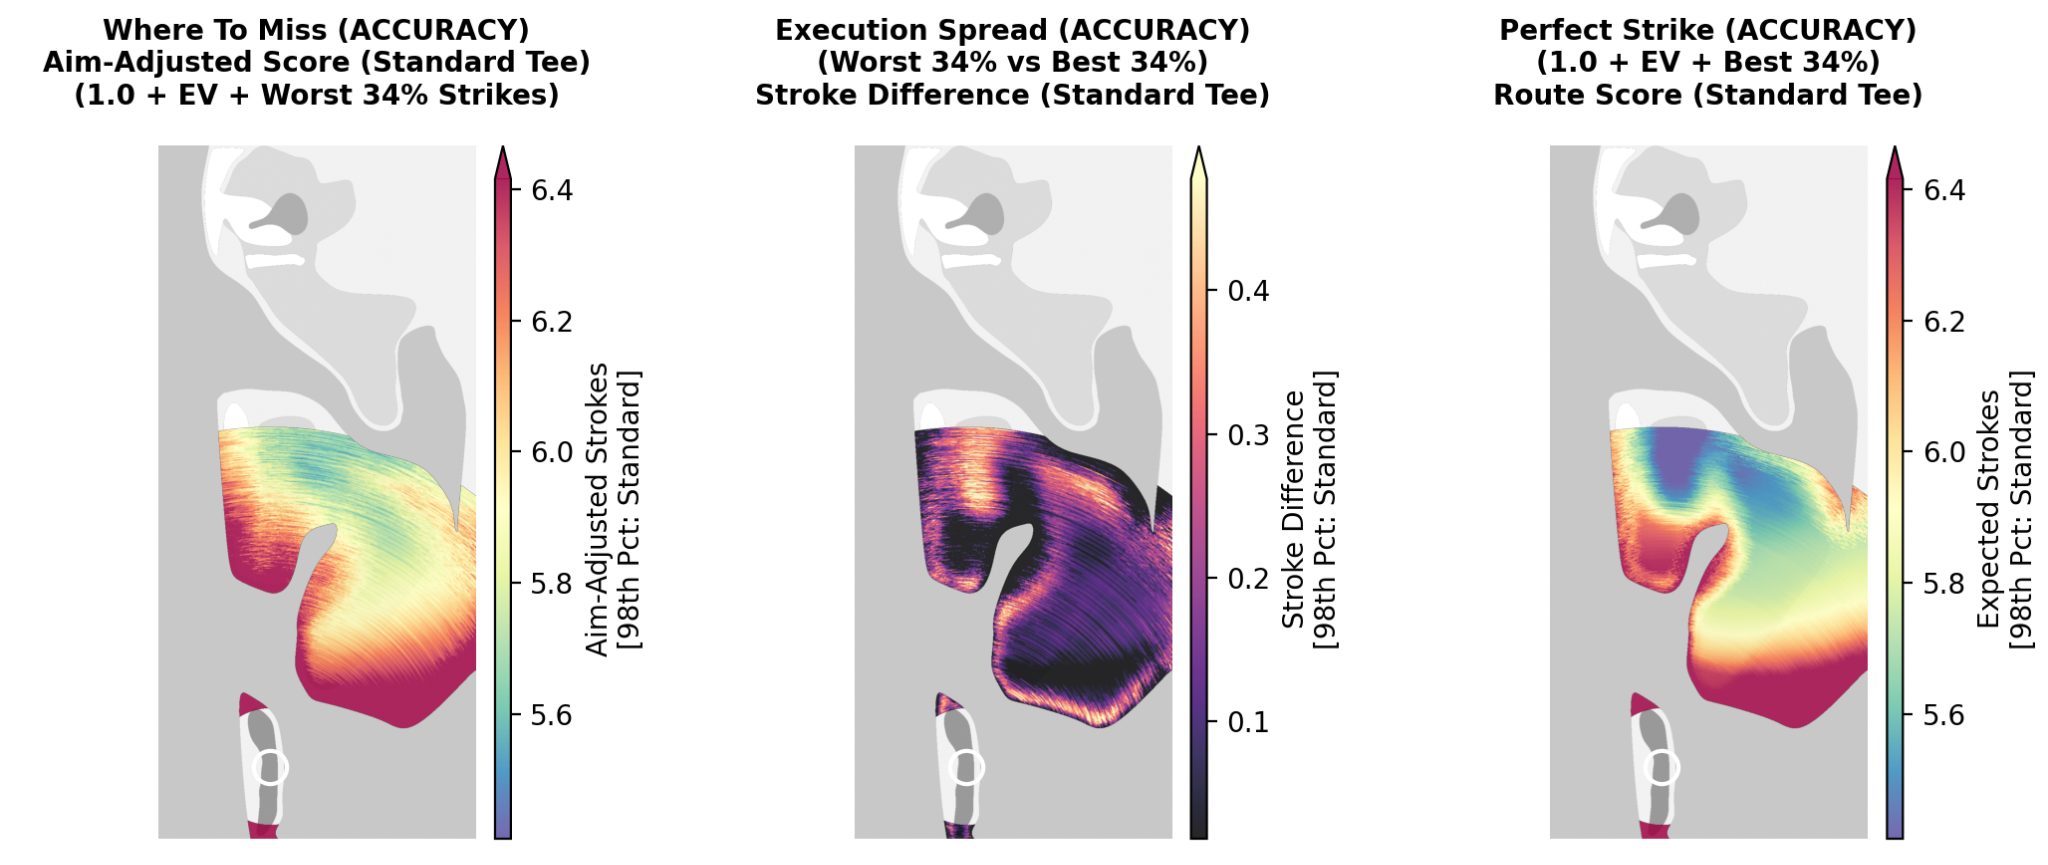
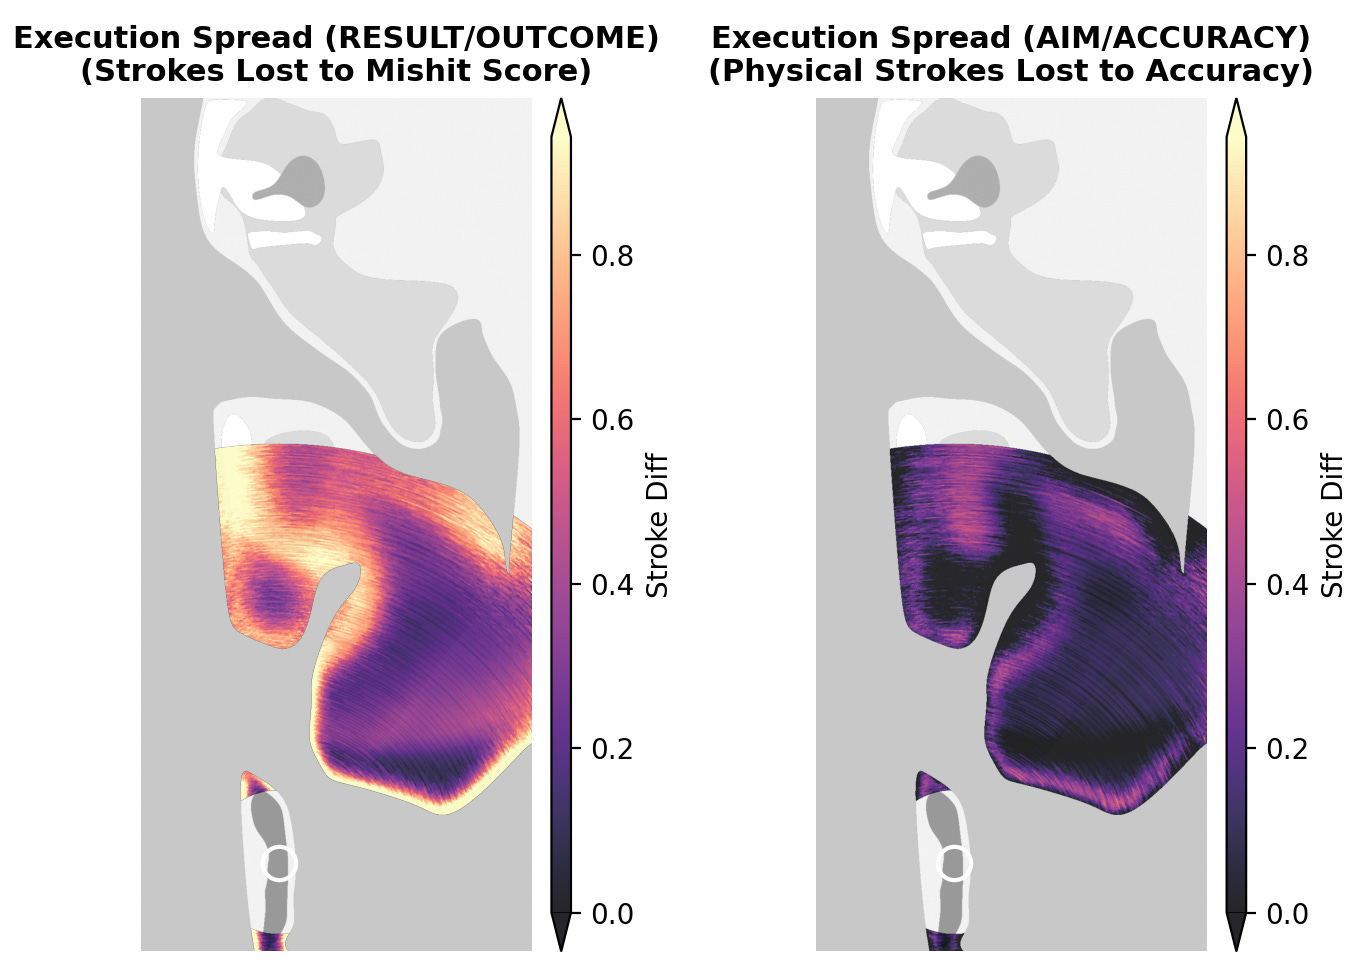
While the two sets of maps look relatively similar, there are significant differences. The most striking is the island fairway on the “Execution Spread” map. By shifting our focus to accuracy this target suddenly becomes the most consequential area for the tee shot!
On the “Where To Miss” map we also see a nontrivial difference, revealing much more forgiveness when aiming at the gap between the fairways. There is also a clearer general correlation between targeting the fairway and having a good outcome. Obviously we should expect this, but I still found the level of difference surprising.
We have fairly significant differences in our results, which poses a conundrum: since there are two different ways to judge a “good shot,” which analysis should we use? In a sense, the accuracy-based framework measures skill – carrying the ball as close to the intended target as possible. Conversely, the results-based framework can highlight luck, at least insofar as the best results aren’t actually next to the target.
Since we have two different frameworks with different results,they can help us to understand strategy. Here’s how we can illustrate some intuitions about golf by using the two versions of these maps together.
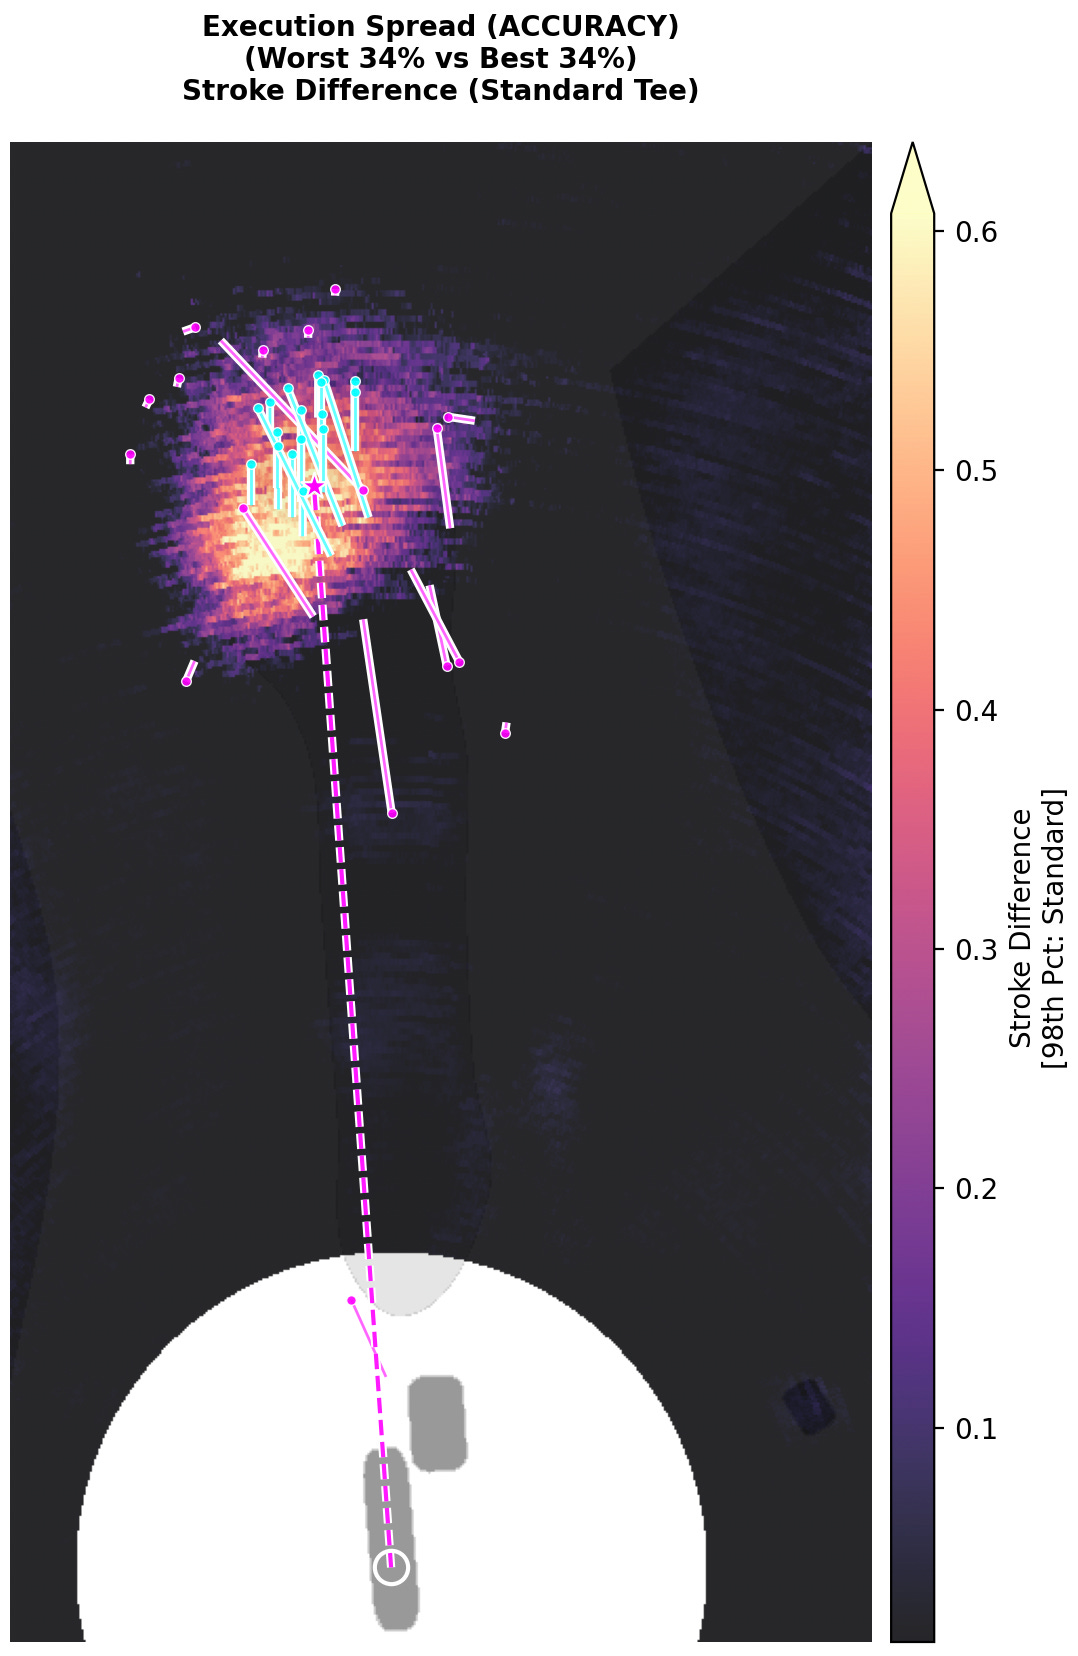
If we look at the “Execution Spread” maps for both the results-based and accuracy-base outcomes, we can click to see which shots get counted as “good” (cyan) and which shots get counted as “bad” (magenta):
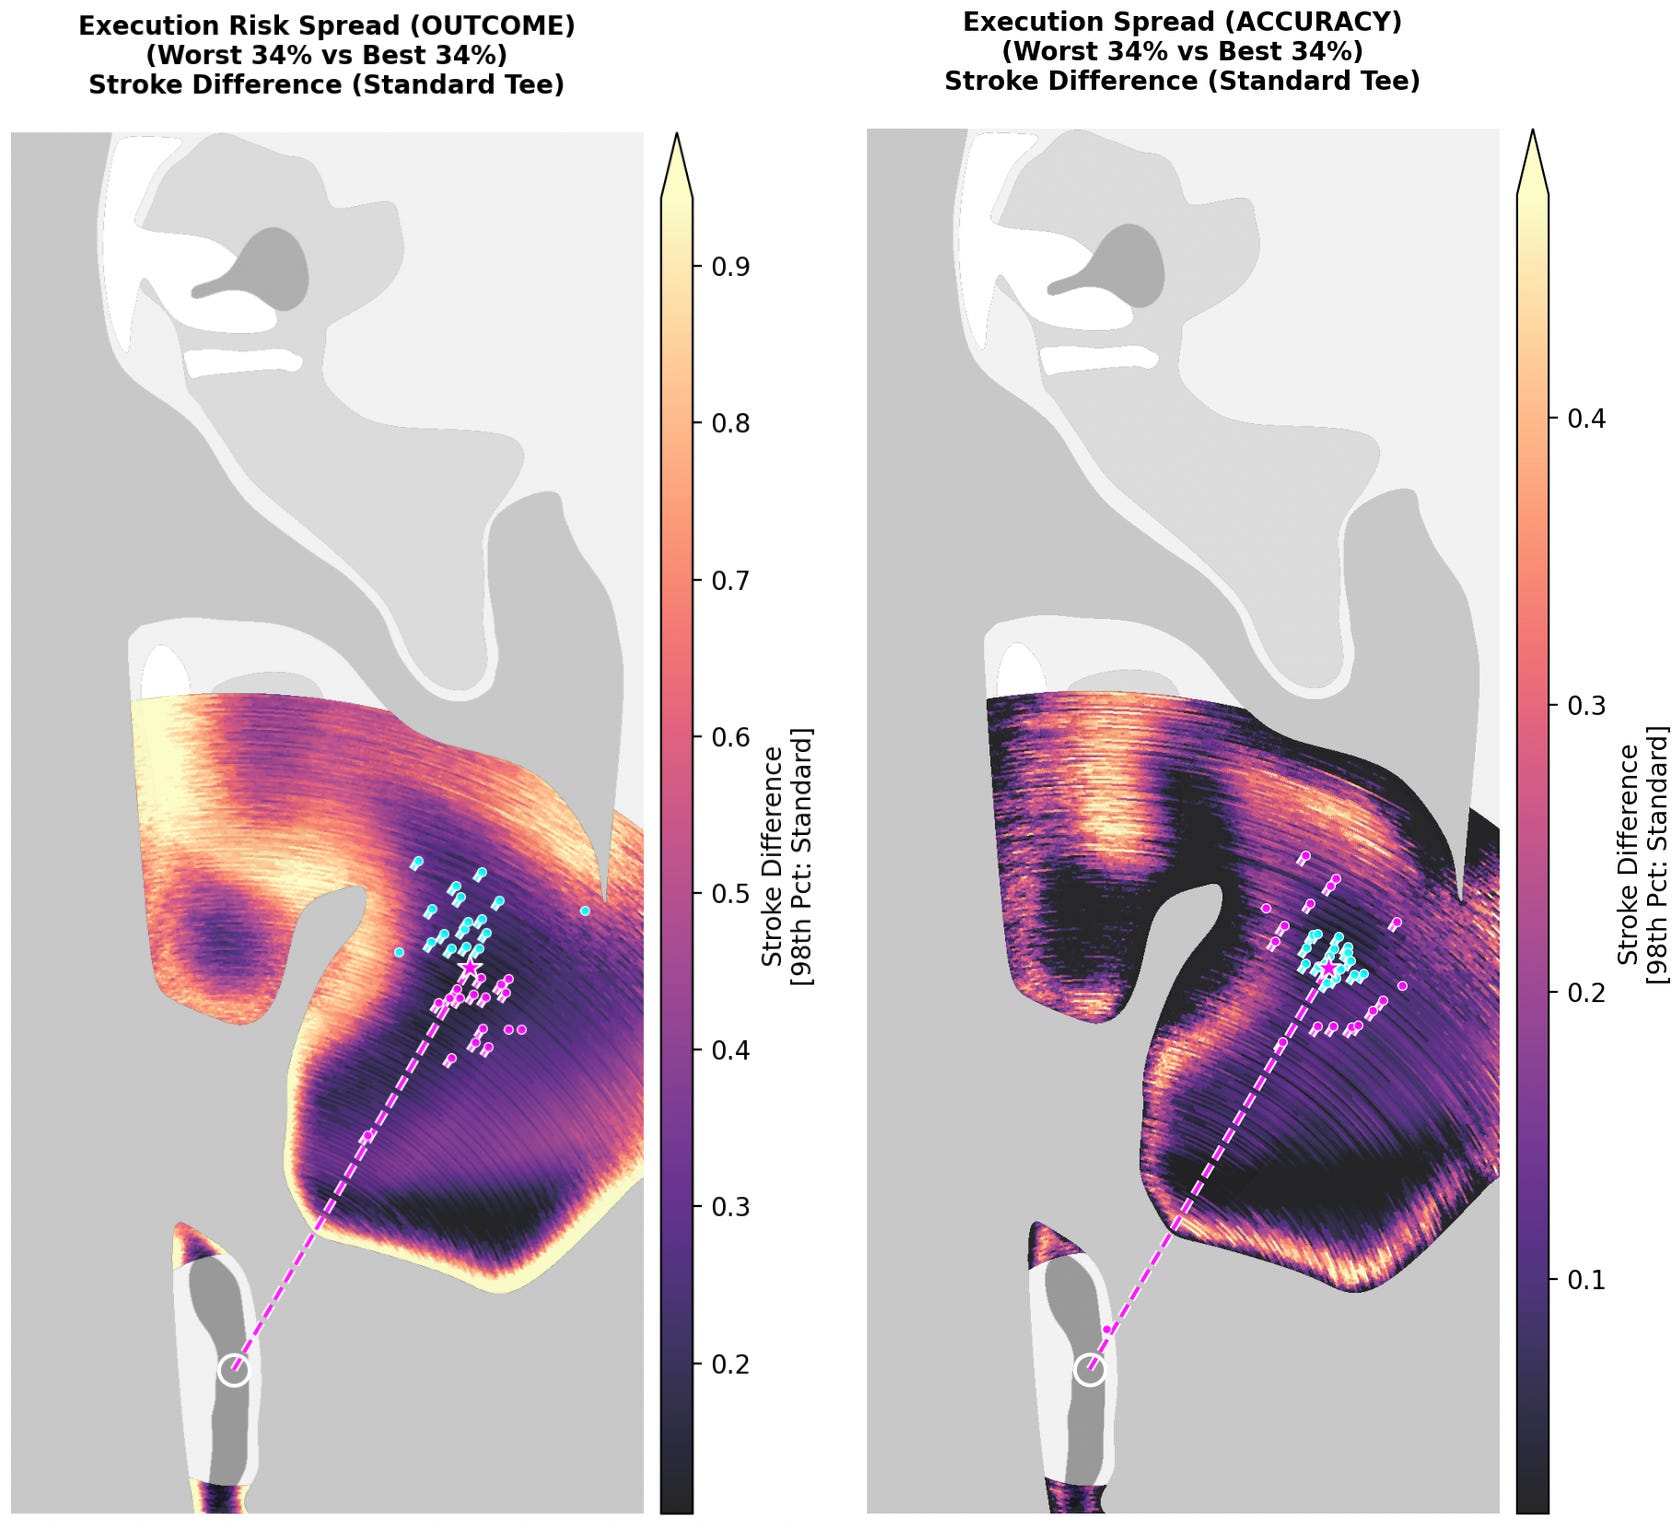
I think the similarities of outcomes here can help visualize clear bailout zones. On both maps, the darker areas are places where extremely different results lead to fairly similar expected scores. In the target location above, we know that neither luck nor skill will have a huge impact on our outcomes. Again, we know this because our target on the maps above is the darkest color (indicating low-influence areas). While obvious, defining bailout zones in a technical sense can help us find overlooked uninteresting areas on a golf course, which might benefit from a redesign.
This visualization also clearly shows the vast difference between these two competing views. The map on the left arguably highlights the “lucky” and “unlucky” shots, whereas the map on the right shows the most accurate and inaccurate ones. Ironically though, the accuracy map counts some of the “best” results – in the fairway and closest to the hole – as “bad” shots. It doesn’t allow for a “good miss” to just be a bonus for the player, which is almost always strategically relevant to where we choose to play the ball.
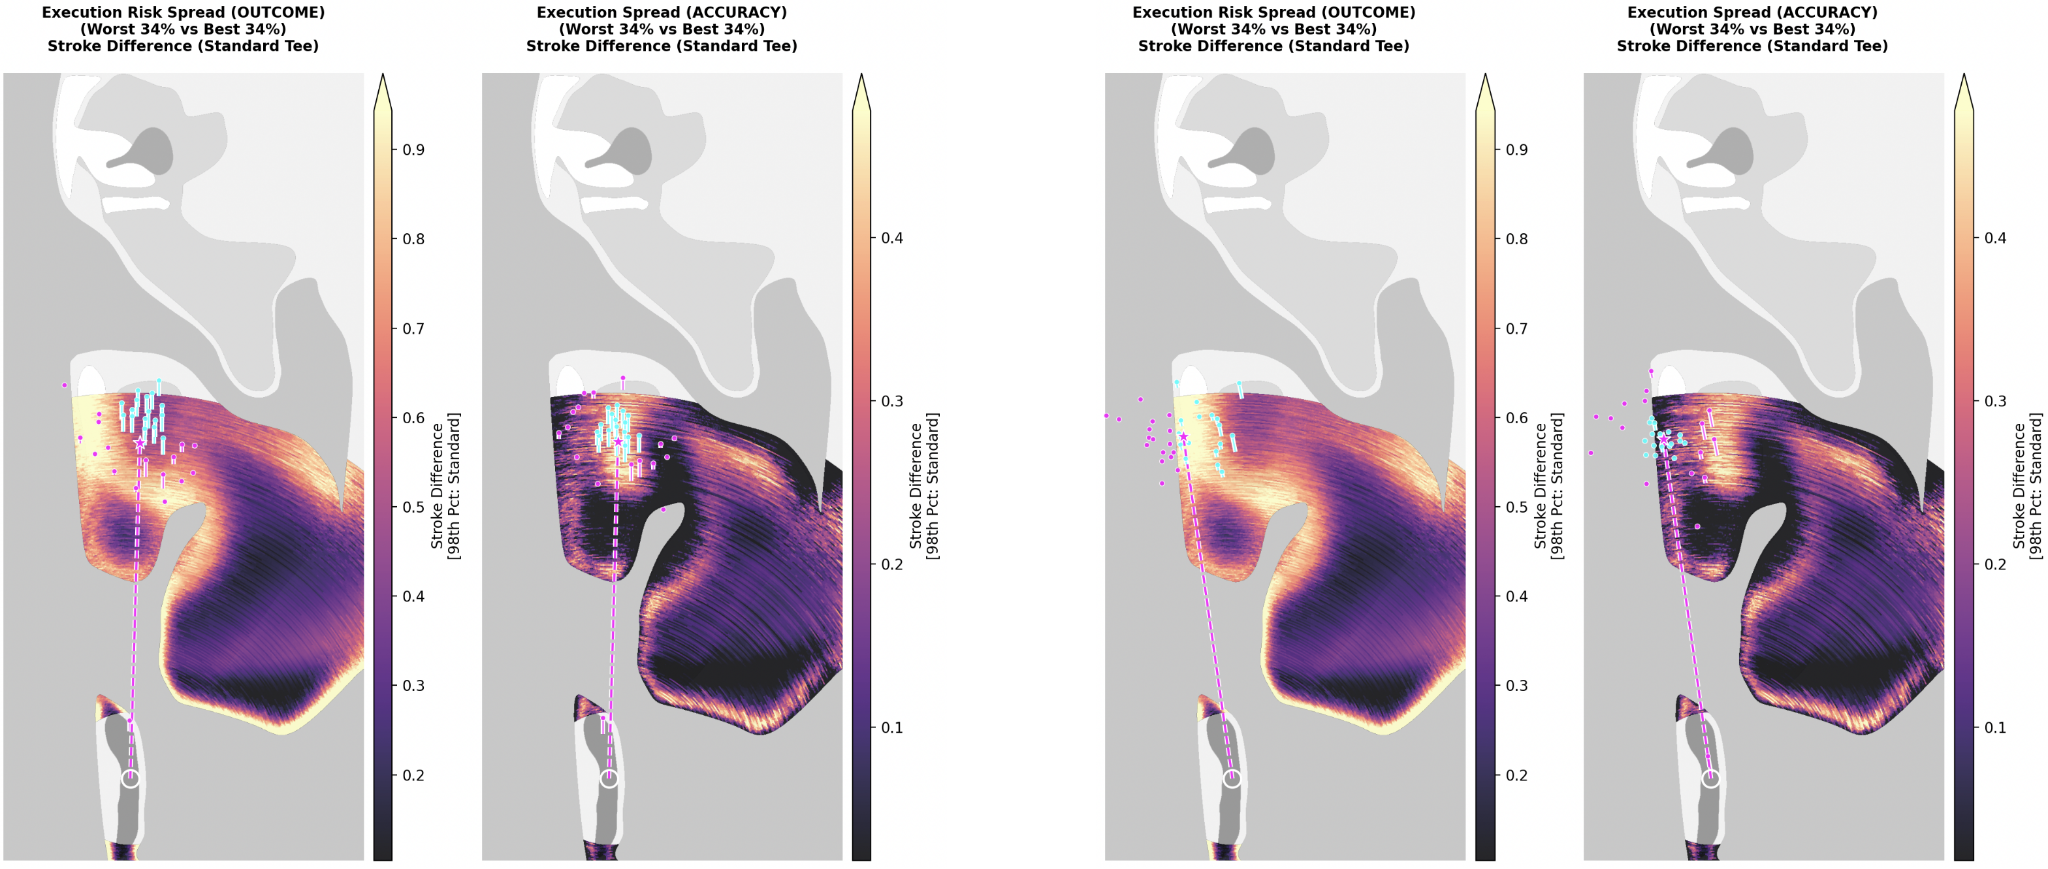
Our maps look completely different when we are playing toward a risky area. Looking at our hole through the results-oriented framework (Figure 3), the impact of a “good shot” paradoxically increases when aiming away from the fairway. This may seem odd, but again, this is the influence of lucky results: the shots that somehow avoided the water.
This result does not appear when we look at the accuracy-oriented framework (Figure 4), for the obvious reason that aiming at the water is a terrible idea! Both accurate and inaccurate shots will end up in the channel, which means their expected scores aren’t that different.
This map illustrates that, very obviously, aiming at the island fairway will have the most consequential results. That highly consequential section on the island fairway area in Figure 2, I think, helps us identify areas that constitute a “hero shot.” With an accuracy-based framework, areas of low significance surrounded by areas of high significance mean any kind of miss is heavily penalized. If that target offers significant benefits, players can justify that risk.
The polar opposite of a hero shot is a “hit and hope” shot, where accuracy and optimal results don’t necessarily correlate. This brings us back to the first article in this series, where I discussed whether or not a bunkered green with a helpful kicker is “fair.”

If there is an optimal strategy that does not directly reward accuracy, then we have a kind of contradiction. If everyone uses this optimal target, the result is essentially random scores. The game of golf starts to resemble a game of poker. The “best” player doesn’t always win, but the player who plays the most optimal strategy should still win disproportionately often.
While I don’t really want to rehash the tenets of luck game design here (I covered that topic in “Luck in Golf”), I do want to briefly articulate why these “unfair” holes can still be good golf design. Golf holes with nontrivial amounts of luck involved can be incredibly fun.
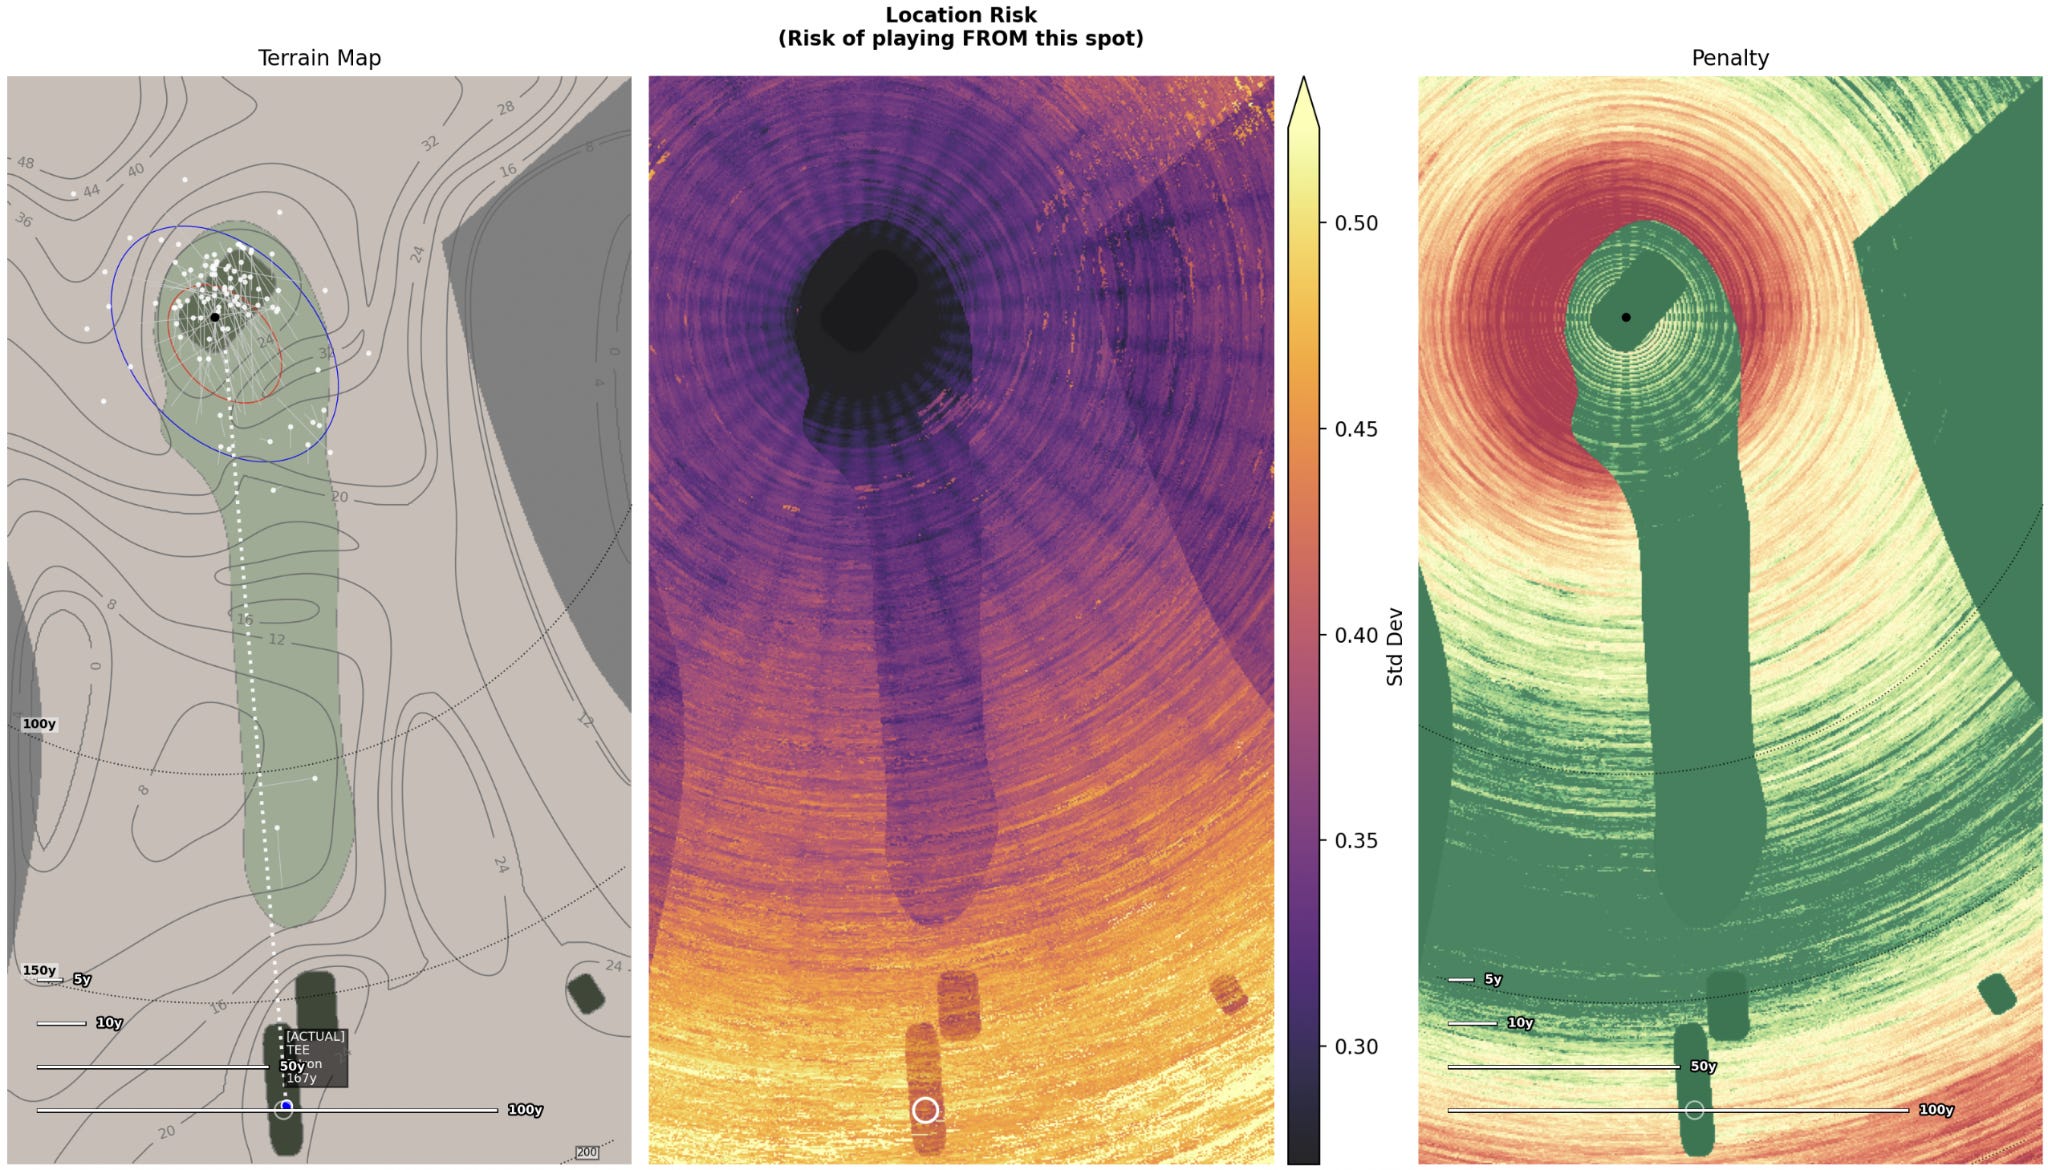

The fourth at Dunaverty GC is a textbook punchbowl that equates to a roll of the dice. Some might consider this “unfair,” but author Jim Hartsell thinks this hole is exceptional:
NLU Film Room: Dunaverty Golf Club3
The fourth at Dunaverty is my favorite hole in the world… When you get over this hill, and you see this green, there’s just nothing else like it really… But, I mean, all you really want to do is just get it over [the ridge], just barely over.
The hole is completely blind. Players have effectively no chance at placing a shot exactly where they need it to be; they can’t even see the target. At the same time, the punchbowl is narrow enough that very bad shots will still be punished, so there is still some skill required.

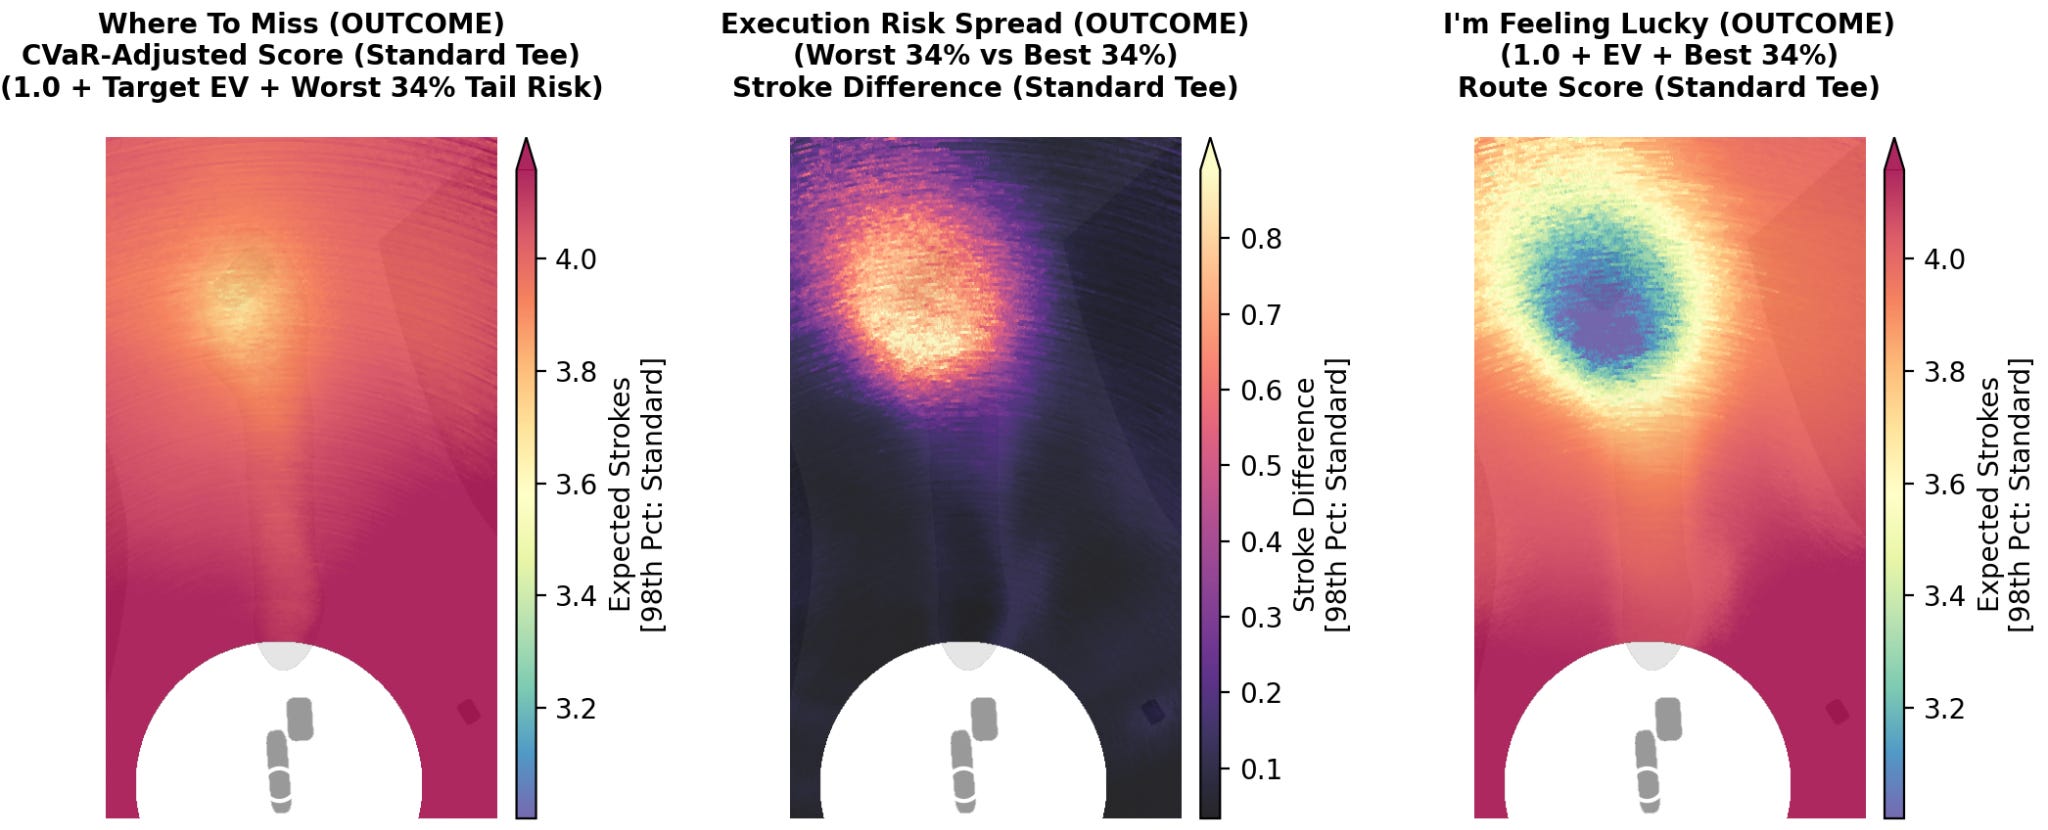
The pattern we see here is notably different from the hero shot. If we net the two frameworks, we can see the influence of luck at Dunaverty is much stronger than on our Lido hole.
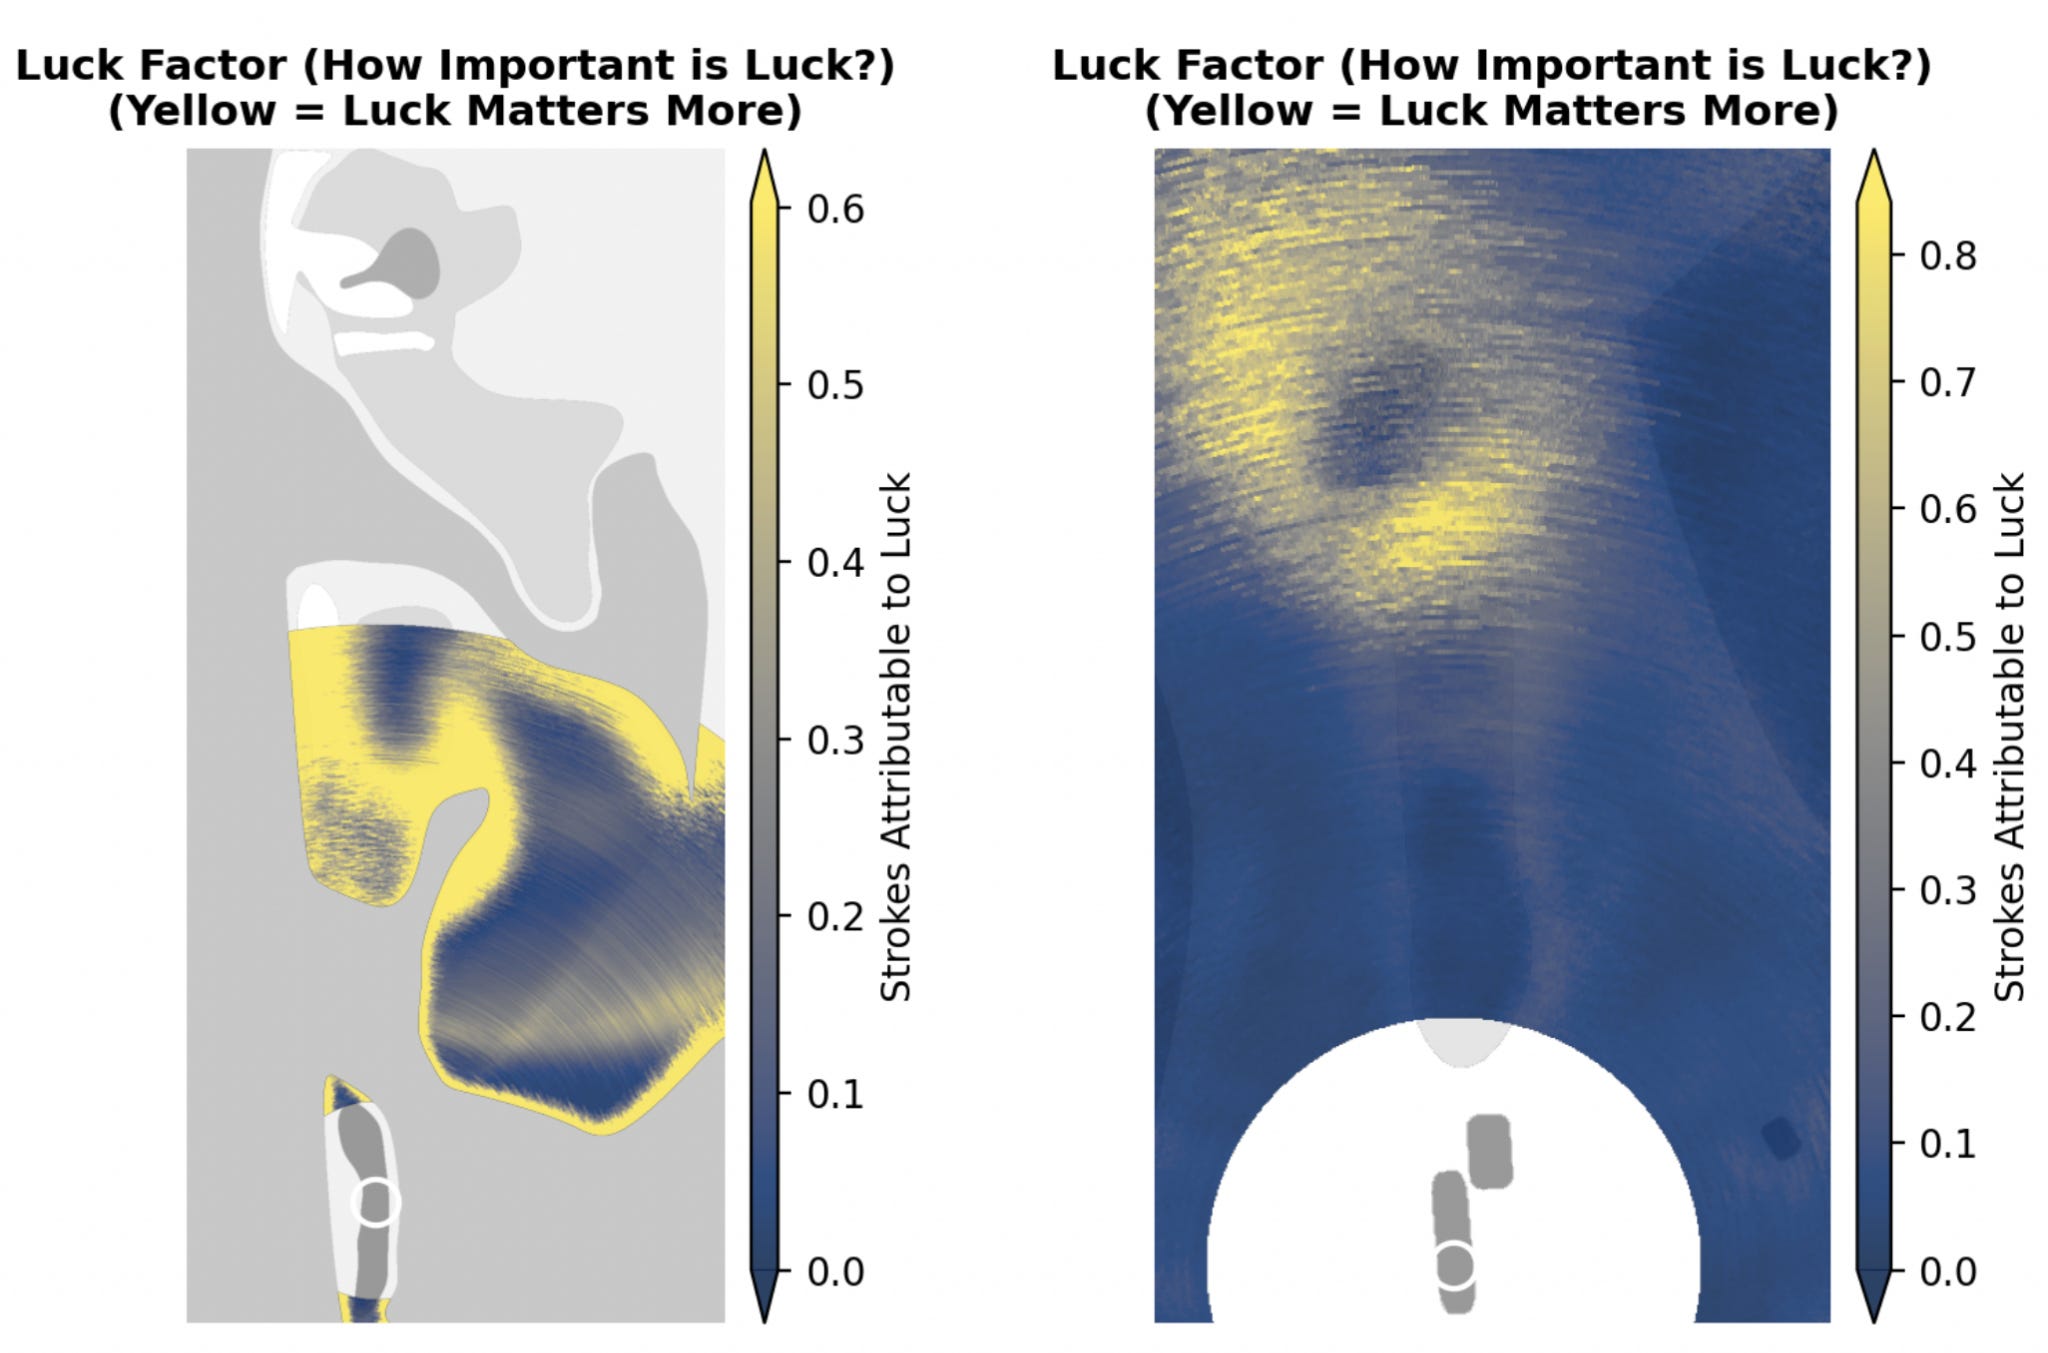
The “Luck Factor” map nets our two frameworks together to highlight where luck is impactful. When accuracy dictates success, any “lucky” shots perfectly align with accurate shots. Where those two measures diverge, the best results are the inaccurate shots that just ended up in a good spot.
When we look at the Channel hole map, we see that the gradient on the island fairway is extremely sharp. The punchbowl at Dunaverty, in contrast, is much blurrier, meaning that luck still influences most areas around the green. Importantly though, the influence of luck drops somewhat when aiming directly at the hole. Accurate players will be rewarded, but only in the long run, over many rounds. That said, the hole allows for a huge amount of variance from day to day. A lucky miss could easily win there and often does.4
The philosophical differences between using a results-focused framework and an accuracy-focused framework inevitably conflict – it’s why we fight about fairness – but both frameworks align on at least one strategic element: the “press your luck” strategy.
Here, we can look at the fourth hole at Woking to see why this is effective. This hole is heavily influenced by a press your luck strategy. I discuss Woking at length in the first post about the Architecture Visualizer, where we saw how the strokes-to-hole penalty is lowest in the upper right corner of the hole’s fairway:
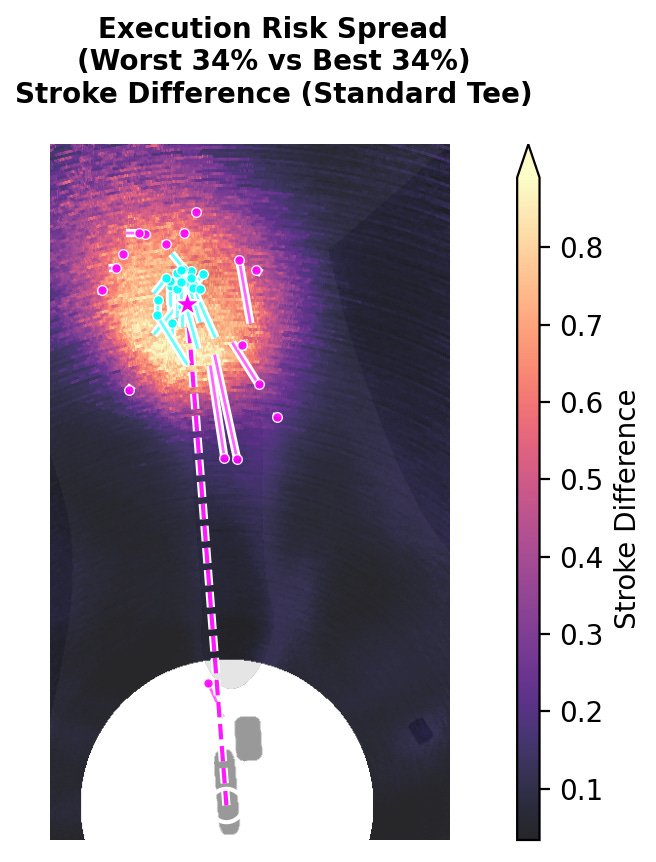
Reaching the right side of the fairway provides a nontrivial advantage on the hole. If we look at the result of our Execution Risk Spread analysis, the press your luck strategy becomes clear:
In both cases, the primary concern is the out-of-bounds on the right. Our results-focused analysis shows that aiming for the top-right corners is great if you hit a good shot, but disastrous if you hit a bad one. The accuracy-focused analysis is similar, though it advises a bit more caution at the out-of-bounds line. In both frameworks, trying to thread the needle between the bunkers and OB carries roughly a 50% failure rate:
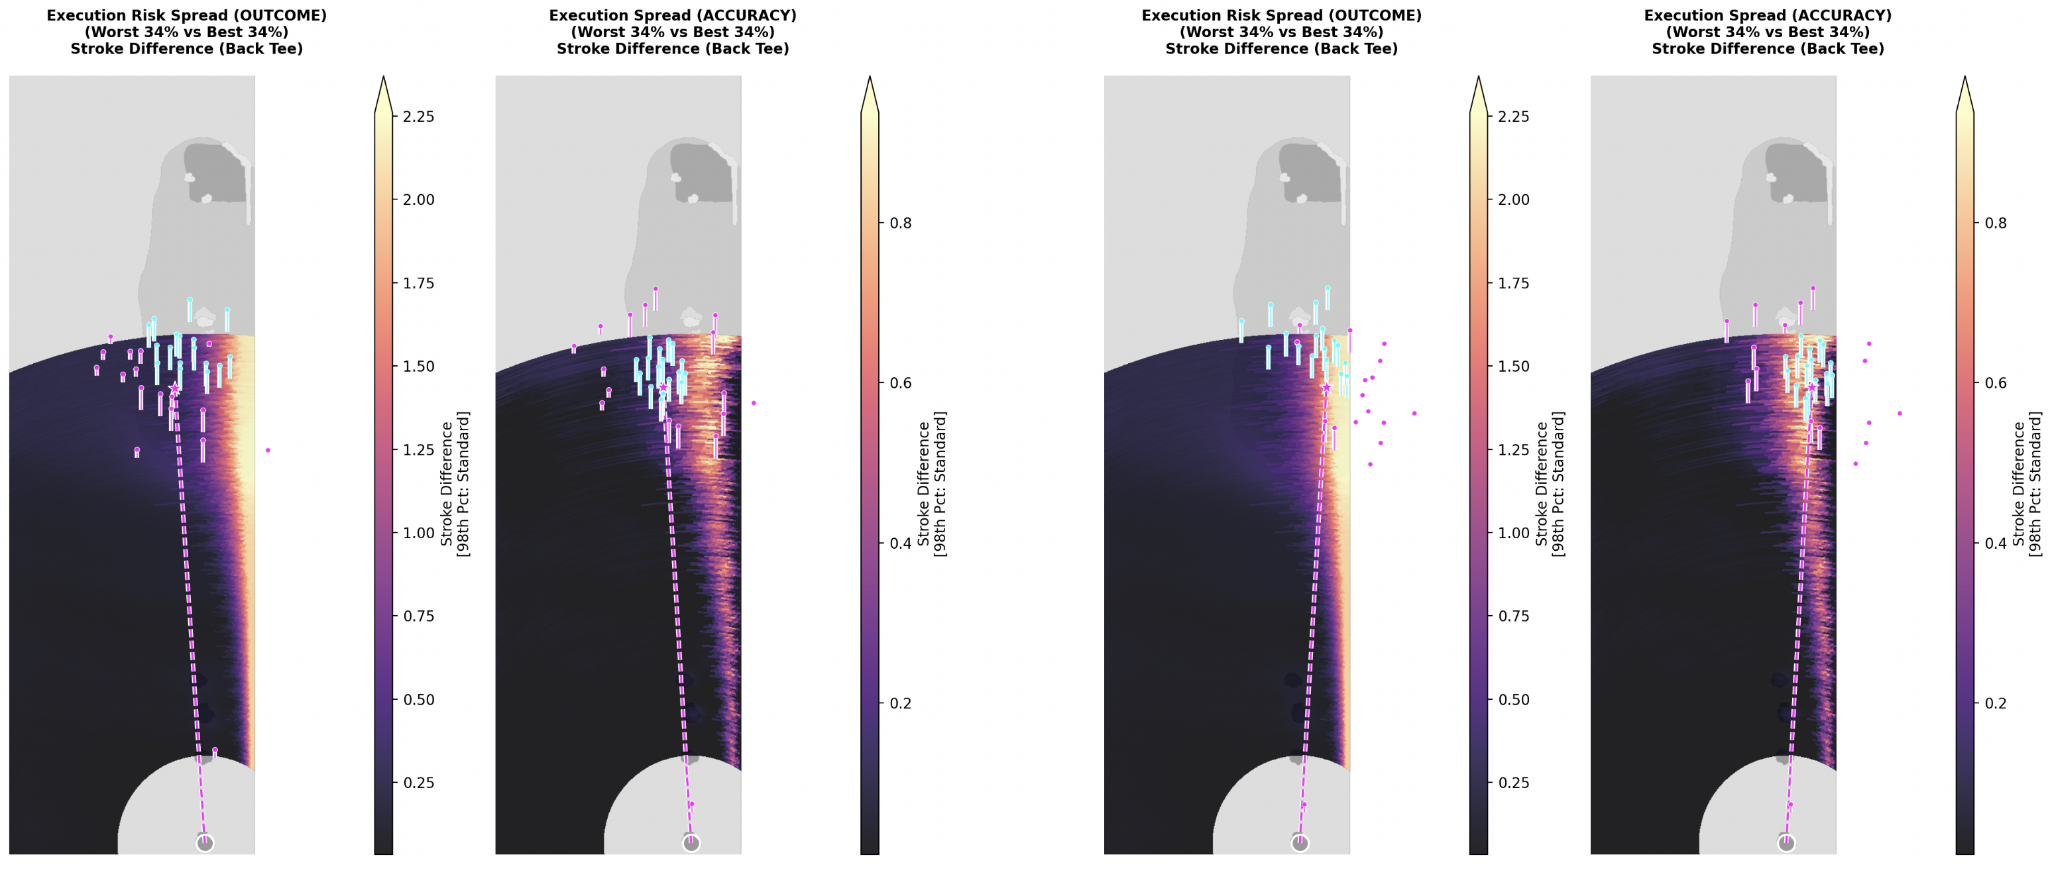
This means from both perspectives, if you’re playing it safe, keep it left. But if you are playing for the lowest score, you might as well aim for the gap and roll the dice.
I think the fact that a press your luck strategy appeases both a results-focused crowd and an accuracy-focused crowd explains why it’s one of the most common strategic design features in golf. Wherever you find strategic golf, you’ll find holes where the optimal position flirts with a penal hazard. It provides strategic goals and lets players dictate their own risk tolerance – something the all-or-nothing island fairway does not allow.
Ultimately, this “press your luck” compromise might be the only solution to the fairness debate. Different people simply prefer different game design elements, and that’s perfectly fine. Different types of players want different things. In fact, game designers have identified various categories of players that all want different things from gameplay. I’ve discussed this briefly before, but I think it’s worth taking another look at the work of Skaff Elias and Richard Garfield:
I like to divide players into different categories. Two of the categories I like to think about are innovation and honing. Innovators are players who play games and they like to explore the new strategies. So, they like to learn new games and they like to explore the big strategic ideas of the game… but after a little while the Innovator has more and more of a difficult time innovating and the Honer takes over. The Honer is the person who likes to play with the percentages and really study the opening moves, and memorize word lists and Scrabble and percentages in poker.
High luck games have a better chance of satisfying the Innovator for longer because they look for these novel situations, and over time most games are still owned by the Honer but it’ll take more time for it to get to that state.
— Garfield 2013: 15:35-17:505
A lot of people play to get into, sort of, the flow, sort of a meditative state… So, the Innovators and Honers comes from this point of view that everybody’s always playing to improve their play, which is just not true. A lot of people are. Some people are playing just to have fun…. Typically, when I play Hearts now, I’m flowing, which means that I’m exercising skill, and it’s fun to exercise a skill which I’m good at, but I’m not necessarily doing either: I’m not innovating and I’m not honing, I’m just playing….
Spectating is the other… I think a lot of people just want to do crap to see what happens. There’s a lot of games like Munchkin… where the people are just constantly doing a lot of things. They’re not innovating, because there’s really not much to innovate, and they’re not honing their skills, and they’re not even enjoying exercising a skill they’re good at. They’re just doing random stuff and sort of seeing what happens, and that’s enjoyable. And they’re the sort of players who, when there’s a card out there that does something really wacky and you can’t predict it, they’ll do it, because they want to see what happens.
So those are my four categories: Innovators, Honers, Flow State, and Spectators.
— Garfield 2012: 33:22-35:566
It makes sense, then, that if different categories want different things from a golf course, we’re going to have strong disagreements about what constitutes “good” design.
Honing-focused players want winners determined by tests of trainable skill. They advocate strongly for an accuracy-based framework to define a “good shot.” For these players, inaccurate shots should not be rewarded and features that allow lucky misses could undermine the outcome.
Innovator-type players are much more focused on strategic elements – especially those featuring strong dispersion pattern transformations. Innovators are exactly the type of players who would want to aim straight at a fairway bunker if they’ve figured out that it produces the best overall results. Potential “good misses” are simply part of strategy decision-making.
Then there are folks who just want to get into a flow state, which likely represents a vast majority of players. They should be much more open to “hit and hope” strategies where the player isn’t entirely in control. If we’re just playing golf to enjoy the act of playing golf, things like optimizing for score aren’t really important.
The Spectator-type player will likely be the first player to swing for the fences to try and pull off a heroic shot. They will always aim for the island fairway on the Channel hole; it’s not even a question. Why wouldn’t they? It’s the most fun shot because it’s the most consequential shot. A course that does not feature over-the-top elements will likely seem boring to them, whether or not the course they are playing is technically challenging.
In the end, I’ve focused on variance as an element of golf design because I think these features can be explicitly identified. We can map them programmatically, and use this process to improve the strategy on courses that need it. If we know what types of players we want to attract, we can shape that course in ways they find exciting. It takes a deep dive in variance to understand these dynamics, and I hope this series was a worthwhile look at the subject.
This may be the end of this series on variance in golf design, but
this is not the end to me asking you to share this post with
the nerd golf community and anyone else who cares
about game-design in golf. It really helps.
While I work on this golf design theory on my own,
I’m open to consulting on any golf design project you might be involved in.
Please reach out if you are interested in collaborating.
Execution Risk Spread map with the both frameworks set to the same scale shows how much less variance an accuracy-based framework has overall: