![]()

django-xbench
Lightweight Django middleware for APM-style request profiling
Measure DB vs App time and query count with near-zero configuration.
Why django-xbench?
- 🔍 DevTools visibility: See DB vs app/serialization time in Chrome DevTools via
Server-Timing. - 🚀 Zero-agent: No daemon, no SaaS — just one Django middleware.
- 🧩 Drop-in: Near-zero configuration (add middleware and go).
- 🔒 Privacy-first: Exposes timing + query counts only (no query contents stored).
Goal: make performance bottlenecks “visible” (DB vs app/serialization) without heavyweight APM.
Here's how django-xbench exposes request timing breakdown using the Server-Timing header:
Adds Server-Timing and X-Bench-Queries headers and optionally logs per-request metrics.
Features
- ✅ Measures total request time and DB time (via
connection.execute_wrapper) - ✅ Calculates app time (= total - db)
- ✅ Counts DB queries
- ✅ Adds response headers:
Server-Timing: xbench-total;dur=..., xbench-db;dur=..., xbench-app;dur=...X-Bench-Queries: <int>
- ✅ Optional logging:
[XBENCH] GET /path | xbench_total=...ms xbench_db=...ms xbench_app=...ms q=...
- ✅ Slow endpoint aggregation (in-memory, per process) + simple dashboard (experimental)
- ✅ Tested with
pytest+pytest-django
Installation
pip install django-xbench
For local development (this repository):
Quickstart
- Add middleware in your
settings.py:
MIDDLEWARE = [
    # Recommended: place near the top to approximate end-to-end server time
    # (includes other middleware overhead).
    "django_xbench.middleware.XBenchMiddleware",

    # ... other middleware ...
]
- Run your server and hit any endpoint:
In your project:
python manage.py runserver
curl -I http://127.0.0.1:8000/<your-endpoint>/
In this repo (demo):
# macOS / Linux
export DJANGO_SECRET_KEY="dev"
python -m examples.manage runserver --noreload
curl -I http://127.0.0.1:8000/db-heavy/
# Windows PowerShell
$env:DJANGO_SECRET_KEY="dev"
python -m examples.manage runserver --noreload
curl -I http://127.0.0.1:8000/db-heavy/
You should see headers similar to:
Server-Timing: xbench-total;dur=12.345, xbench-db;dur=1.234, xbench-app;dur=11.111
X-Bench-Queries: 3
Output
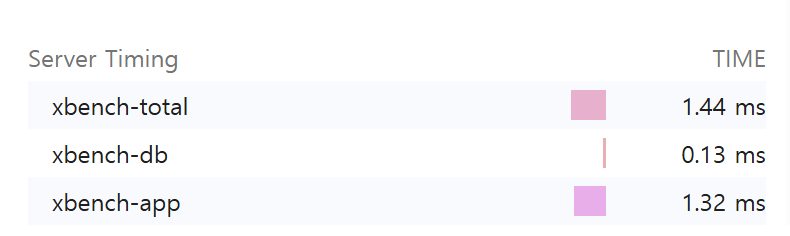
Server-Timing
Example:
Server-Timing: xbench-total;dur=52.300, xbench-db;dur=14.100, xbench-app;dur=38.200
xbench-total: whole request durationxbench-db: total DB time measured by wrapperxbench-app:max(0, total - db)(serialization/template/python time etc.)
You can inspect this in Chrome DevTools → Network → Timing
(or any browser that supports the Server-Timing spec).
Query count header
Configuration
django-xbench supports two configuration styles.
Preferred: XBENCH dict
Use a single XBENCH dictionary to keep settings compact and grouped:
XBENCH = {
    "ENABLED": True,       # default: True
    "LOG": False,          # default: False
    "LOG_LEVEL": "info",   # "info" or "debug"
    "SLOW_AGG": False,     # default: False
}
Legacy (still supported)
Older flat settings are still supported:
XBENCH_ENABLED = True
XBENCH_LOG_ENABLED = True
XBENCH_LOG_LEVEL = "debug"
XBENCH_SLOW_AGG_ENABLED = True
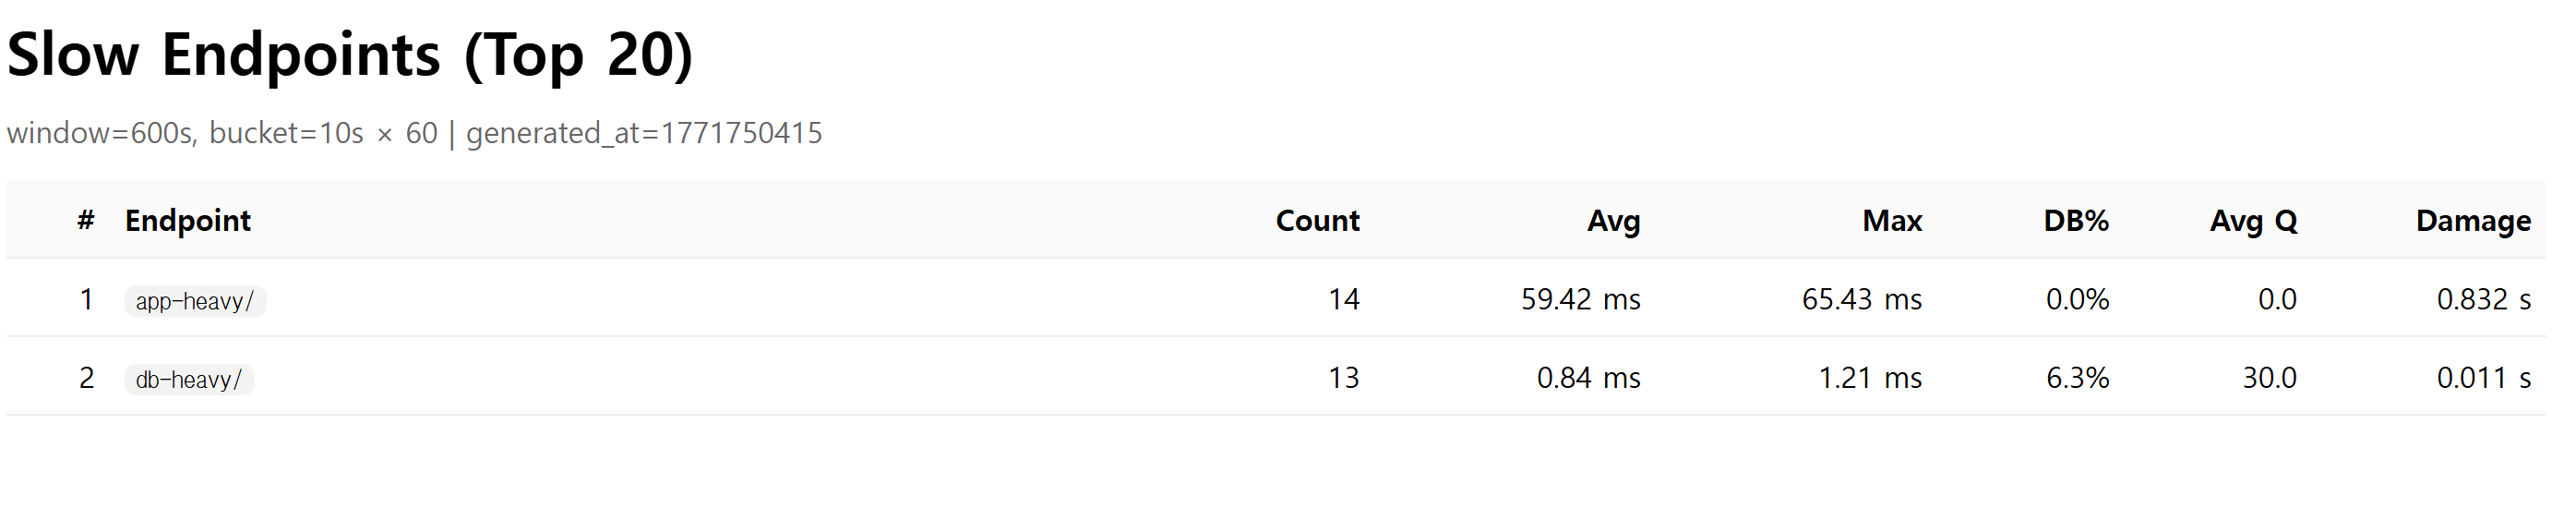
Slow endpoint dashboard (experimental)
This feature keeps an in-memory rolling window of endpoint timings (per process) and shows the slowest endpoints by "damage" (total accumulated latency).
Enable aggregation
XBENCH = {"SLOW_AGG": True}
Expose developer endpoints (do not expose publicly)
In your project's urls.py:
from django.urls import include, path

urlpatterns = [
    # ... your urls ...
    path("__xbench__/", include("django_xbench.slowagg.urls")),
]
Endpoints
- JSON snapshot:
GET /__xbench__/slow/?n=20 - HTML dashboard:
GET /__xbench__/slow/ui/?n=20
Notes
- Aggregation is in-memory per process. If you run multiple workers/processes, each one has its own rolling window.
- Intended for debugging / internal visibility, not as a full distributed APM.
- DB%: db_total / total
- Avg Q: average DB queries per request
- Damage: total accumulated latency in the window (sum of durations)
No data yet?
The dashboard only shows data after requests occur.
If you see "No data yet":
- Make sure
SLOW_AGGis enabled - Hit some endpoints (e.g.
/db-heavy/) - Refresh the dashboard
If using Django runserver with auto-reload, aggregation resets on reload.
Advanced tuning (optional)
XBENCH = {
    "SLOW_AGG": True,
    "SLOW_BUCKET_SECONDS": 10,   # bucket size in seconds
    "SLOW_BUCKET_COUNT": 60,     # number of buckets (window = bucket_seconds * bucket_count)
    "SLOW_ENDPOINT_CAP": 200,    # max unique endpoints per bucket (overflow goes to "__other__")
}
Development
Run tests
Note: this repo includes a bundled
examples/Django project used bypytest-django. In CI, we setPYTHONPATH=examplesto ensureexamples.config.settingscan be imported reliably.
If you want to see logs while testing:
Demo project (bundled)
This repository includes an examples/ Django project for manual testing.
Run it from the repository root:
# macOS / Linux
export DJANGO_SECRET_KEY="dev"
python -m examples.manage runserver --noreload
# Windows PowerShell
$env:DJANGO_SECRET_KEY="dev"
python -m examples.manage runserver --noreload
Try a few endpoints:
curl -I http://127.0.0.1:8000/db-heavy/
curl -I http://127.0.0.1:8000/app-heavy/
curl -I http://127.0.0.1:8000/admin/login/
Compatibility
- Python: 3.9+
- Django: 3.2+ (tested on 5.2)
Roadmap
- DRF serialization time breakdown (view/serializer timing)
- More robust
Server-Timingmerging (preserve existing metrics) - Docs: real-world examples (N+1 detection demo endpoints)
- Slow endpoint dashboard: auto-refresh UI and better filtering
Contributing
Issues and PRs are welcome.
If you propose new metrics, please include:
- minimal reproducible example
- tests
- documentation update
License
MIT