AIOps Platform for Intelligent Kubernetes Remediation







Kubernaut closes the loop from Kubernetes alert to automated remediation. It operates in two modes: autonomously — detecting signals, investigating root causes, and executing fixes end-to-end without human involvement — and interactively — letting operators join an in-progress investigation via MCP or A2A, guide the agent, and approve remediations in real time. The LLM-powered agent uses native Go client-go bindings against the Kubernetes API, Prometheus, and log endpoints to investigate, select a remediation workflow, and execute the fix — or escalate to a human with a full RCA when it can't. See the full documentation for architecture, installation, and usage guides.
screen-recording-small.mp4
See autonomous mode demo (non-interactive)
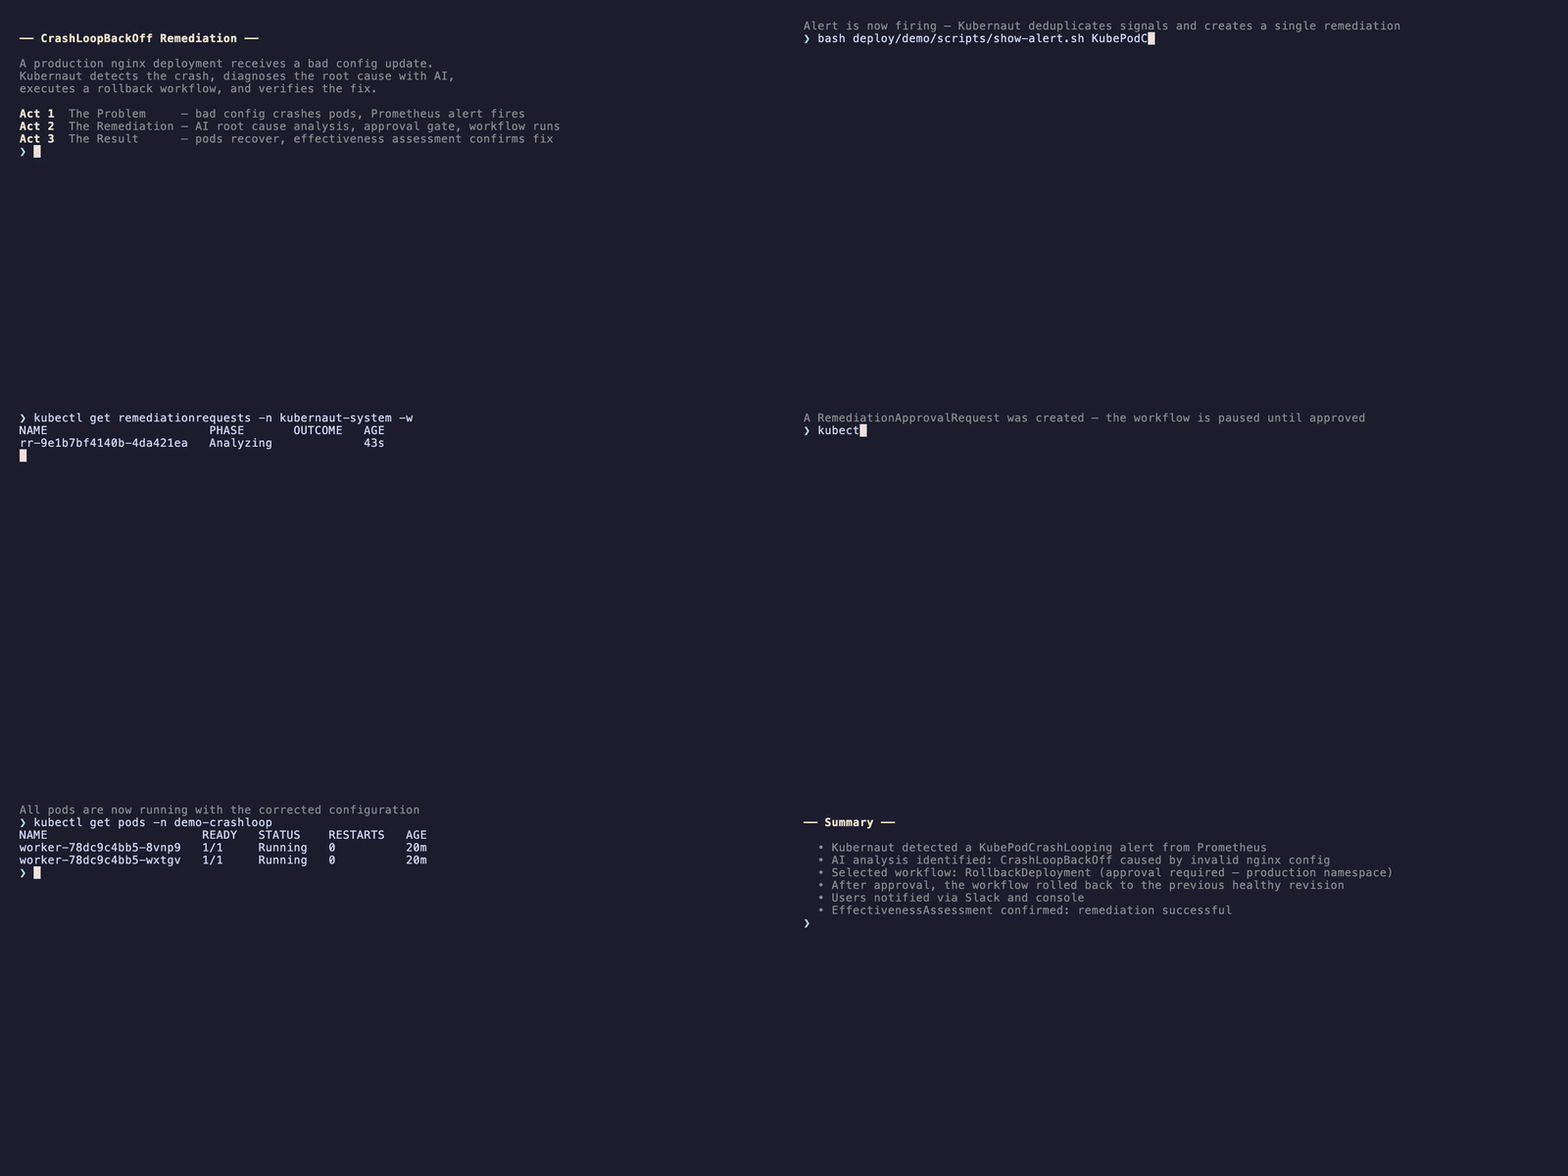
This is 1 of 37 runnable scenarios in kubernaut-demo-scenarios — clone it and run any of them against your own cluster.
Why
Kubernetes operators spend hours manually triaging alerts, diagnosing root causes from scattered logs and metrics, and executing remediation steps from runbooks that drift out of date. The response depends on tribal knowledge, human availability, and often happens at 3am.
Rule-based remediation tools help with known, deterministic problems — "if X, do Y." But when the same symptom has multiple root causes, or the right fix depends on context the rule can't see, they fall short.
Kubernaut bridges that gap. It uses an LLM agent that investigates the actual root cause through native Go bindings against the Kubernetes API and observability stack, selects the right remediation from a workflow catalog, executes it, and verifies the fix worked — escalating to humans only when it should. Rule-based tools are thermostats. Kubernaut is a diagnostician that also adjusts the thermostat.
Why Kubernaut? — full comparison with rule-based tools
What It Can Triage & Fix
Validated against 37 runnable scenarios covering real-world Kubernetes failure modes:
| Category | Examples |
|---|---|
| Workload failures | Crash loops, stuck rollouts, memory leaks/escalation, SLO error-budget burn |
| Resource & capacity | HPA maxed out, PDB deadlocks, PVC capacity exhaustion (forecasted), DB connection pool saturation |
| Infrastructure | Node failures, PVC/StatefulSet binding failures, scheduling taints, OCP operator/build/RBAC/SCC violations |
| Networking & delivery | NetworkPolicy misconfigurations, Istio authorization failures, GitOps drift, cert-manager failures |
| Complex root-cause chains | Cross-namespace dependency tracing, cascading multi-service failures, prioritizing causation over severity, filtering unrelated noise |
| Safety & reasoning robustness | Prompt-injection detection (shadow agent), resistance to misleading alert descriptions, duplicate-alert suppression |
See the full scenario catalog for exact alerts, fault injection, and remediation workflows per scenario.
What It Does
- Detects — Ingests Prometheus AlertManager alerts and Kubernetes Events, validates resource scope, and deduplicates by fingerprint
- Triages — Resolves signal severity through a multi-tier pipeline (firing alerts, Prometheus rule evaluation, LLM-based triage) and derives grounded signal names from infrastructure context
- Investigates — Performs live root cause analysis using Kubernetes inspection tools, configurable observability toolsets (Prometheus, etc.), and remediation history. Runs autonomously end-to-end, or interactively with an operator guiding the investigation in real time via MCP tools or A2A sessions
- Integrates — Exposes MCP and A2A (Agent-to-Agent) protocol endpoints through the API Frontend, enabling external agents, UIs, and automation to interact with Kubernaut via OIDC-authenticated sessions. Operators can take over autonomous sessions mid-flight, review findings, and approve next steps
- Remediates — Selects and executes a workflow from a searchable catalog via Tekton Pipelines, Kubernetes Jobs, or Ansible (AWX/AAP), with optional human approval gates
- Closes the loop — Notifies the team (Slack, webhook), evaluates whether the fix worked via health checks, alert resolution, and spec hash drift detection, and feeds effectiveness scores back into future investigations
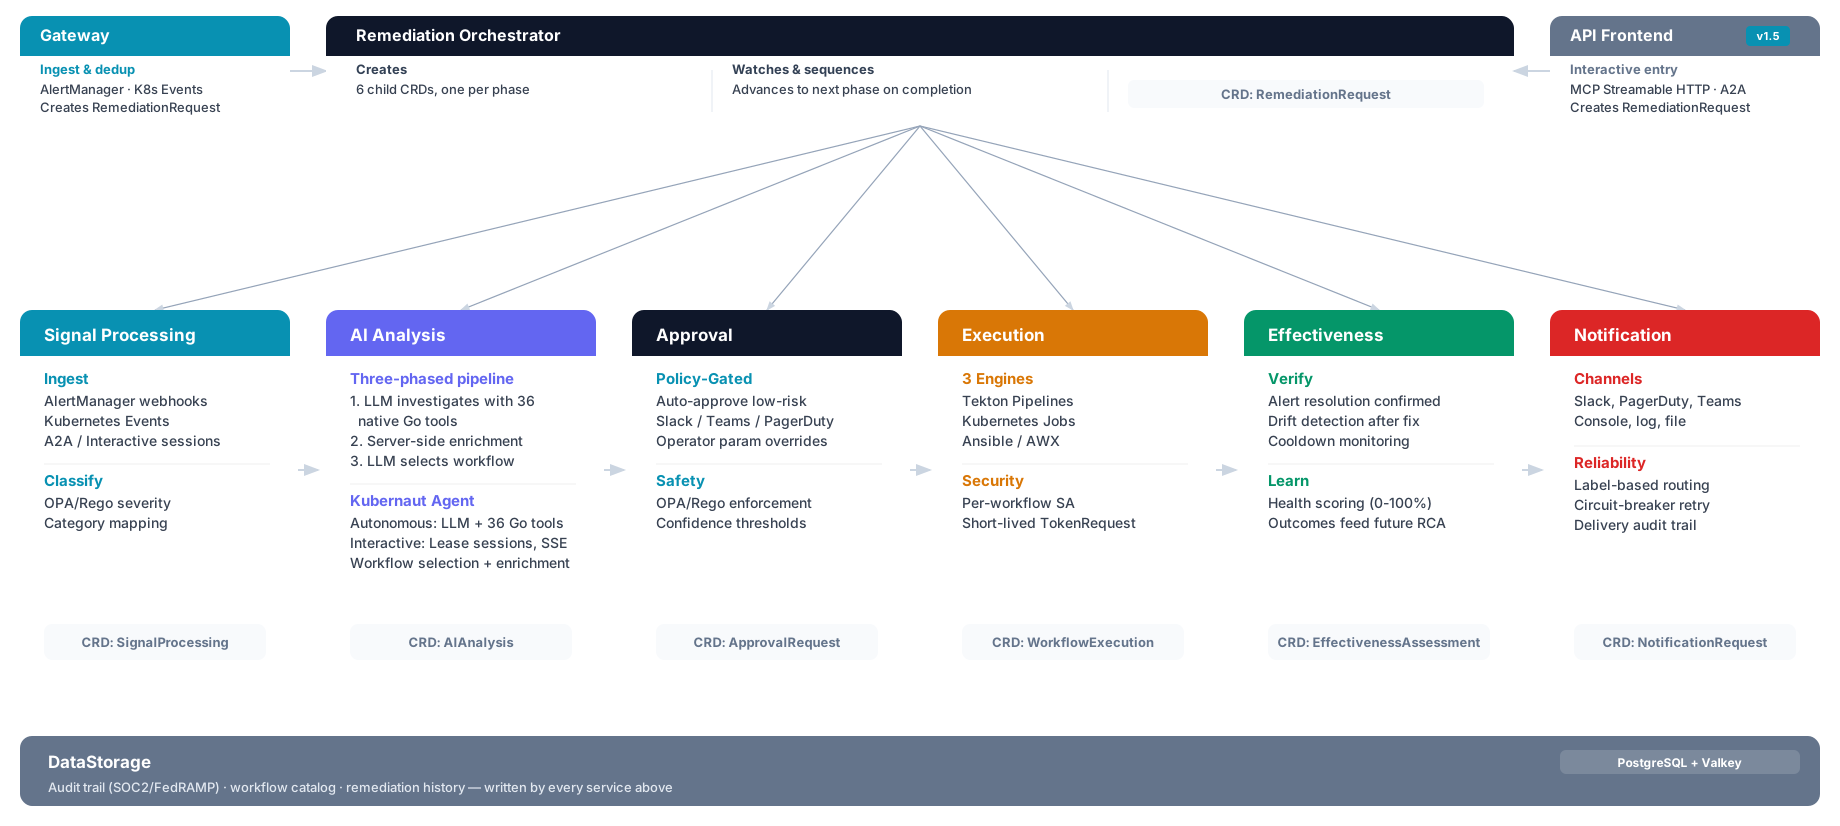
Services
| Service | Path | Description |
|---|---|---|
| Gateway | cmd/gateway |
Signal ingestion — AlertManager webhooks and Kubernetes Events |
| Signal Processing | cmd/signalprocessing |
Signal enrichment, deduplication, and routing |
| Remediation Orchestrator | cmd/remediationorchestrator |
CRD lifecycle orchestration across the pipeline |
| AI Analysis | cmd/aianalysis |
Investigation controller — dispatches to Kubernaut Agent |
| Kubernaut Agent | cmd/kubernautagent |
LLM-powered RCA, workflow selection, and MCP tool execution |
| API Frontend | cmd/apifrontend |
External protocol layer — MCP, A2A, OIDC auth, severity triage |
| Workflow Execution | cmd/workflowexecution |
Tekton Pipeline / Job / Ansible execution engine |
| Data Storage | cmd/datastorage |
Workflow catalog, audit trail, and persistence (PostgreSQL) |
| Notification | cmd/notification |
Slack, webhook, and console notification delivery |
| Effectiveness Monitor | cmd/effectivenessmonitor |
Post-remediation health checks and effectiveness scoring |
| Auth Webhook | cmd/authwebhook |
Kubernetes authentication webhook for service identity |
Roadmap
v1.6 — Fleet Remediation & ITSM (in progress)
- Fleet operations — Multi-cluster remediation orchestration through a pluggable scope-checking adapter: Red Hat ACM/OCM for ACM shops, or a control-plane-free mode backed by the built-in Fleet Metadata Cache (FMC) for GitOps and standalone clusters — with Rancher and Clusterpedia adapters architected for other vendor fleet platforms (#54)
- ServiceNow incident triage — Consume ServiceNow incidents as signals through the API Frontend, enabling Kubernaut to investigate and remediate ITSM tickets alongside Kubernetes alerts (#1338)
Full roadmap — for released features, see the CHANGELOG.
Installation
See the Installation Guide for prerequisites, configuration, and deployment instructions.
Signed & Verified
Every container image published to quay.io/kubernaut-ai is keylessly signed with
Cosign (Sigstore/Fulcio/Rekor) and carries a
SLSA build provenance attestation plus a CycloneDX SBOM attestation,
generated entirely inside GitHub Actions via OIDC — no long-lived signing keys involved.
See .github/workflows/release.yml for the full pipeline.
Verify any image before you pull it:
# Resolve the latest published release. GitHub's `releases/latest` endpoint always
# excludes drafts and pre-releases, so this never resolves to an -rcN build.
VERSION=$(curl -fsSL https://api.github.com/repos/jordigilh/kubernaut/releases/latest | grep -o '"tag_name": *"[^"]*"' | cut -d'"' -f4)

# Verify the signature (keyless, tied to this repo's release workflow)
cosign verify quay.io/kubernaut-ai/gateway:${VERSION} \
  --certificate-identity-regexp "https://github.com/jordigilh/kubernaut/.github/workflows/release.yml@.*" \
  --certificate-oidc-issuer "https://token.actions.githubusercontent.com"

# Verify the SLSA build provenance attestation
cosign verify-attestation quay.io/kubernaut-ai/gateway:${VERSION} \
  --type slsaprovenance \
  --certificate-identity-regexp "https://github.com/jordigilh/kubernaut/.github/workflows/release.yml@.*" \
  --certificate-oidc-issuer "https://token.actions.githubusercontent.com"
Security posture is tracked continuously via OpenSSF Scorecard (badge above) and CodeQL static analysis. Found a vulnerability? See SECURITY.md for our disclosure process.
Documentation
| Resource | Link |
|---|---|
| User & Operator Guide | jordigilh.github.io/kubernaut-docs |
| Architecture Overview | Architecture |
| Developer Guide | docs/DEVELOPER_GUIDE.md |
| Must-Gather Diagnostics | cmd/must-gather/README.md |
Related Repositories
| Repository | Description |
|---|---|
| kubernaut-operator | OLM operator — deploys and manages Kubernaut services on OpenShift |
| kubernaut-console | Kubernaut Console — web UI for interactive investigation and remediation |
| kubernaut-docs | Documentation website (MkDocs Material) |
| kubernaut-demo-scenarios | Demo scenarios, scripts, and recordings |
Development
make build-all                    # Build all services
make test-tier-unit               # Run unit tests (all services)
make test-integration-apifrontend # Run integration tests for a service
make test-e2e-apifrontend         # Run E2E tests for a service (Kind cluster)
make test-all-gateway             # Run all test tiers for a service
make lint                         # Run golangci-lint across the monorepo
We use Ginkgo/Gomega BDD for testing and follow a strict TDD workflow with a defense-in-depth testing pyramid (unit, integration, E2E). See the Developer Guide for environment setup, build targets, and test commands.
Contributing
See CONTRIBUTING.md for guidelines. In short: create a feature branch, implement with tests, update docs, and open a PR.
License
Apache License 2.0 — see LICENSE.
Issues: GitHub Issues · Discussions: GitHub Discussions
Kubernaut — From alert to remediation, intelligently.