
Principles of DevOps Demo
In this project we demo a couple of techniques informed by the three pillars of DevOps: flow, feedback, and continual experimentation.
Table of contents
- General Setup
- Run microservices locally
- Microservice architecture explained
- Online A/B test
- KPI logging with Graphite and Grafana
- Continuous integration in the cloud
Setup
This demo was developed and tested on OSX - it should therefore run just as well on Linux operating systems.
For OSX Docker installation instructions, visit https://docs.docker.com/docker-for-mac/install/.
For how to install and work with Docker (a central component of this sample project) on Windows please follow the instructions here: https://docs.docker.com/docker-for-windows/.
Make certain you have Docker installed in a recent version:
$ docker --version
Docker version 17.12.0-ce, build c97c6d6
I recommend using Anaconda Python 3 which is straightfoward to use and maintain virtual environment with: https://www.anaconda.com/download/.
Create a virtual environment:
$ conda create -n devops python=3.6 --yes
Activate the virtual environment:
Install high-level DevOps-specific frameworks:
$ pip install -r requirements.txt
Run tests for greetings service
Install greetings requirements
$ pip install pytest
$ pip install -r greetings/requirements.txt
Run tests
$ python -m pytest greetings -k tests
Test services locally
To build all Docker images:
Now run the services locally:
To see all Docker containers that the above command starts:
To shut all services down again:
A tour of our services
Now that our services are running (docker-compose up)
let us take a look at the various services we have and how they interact.
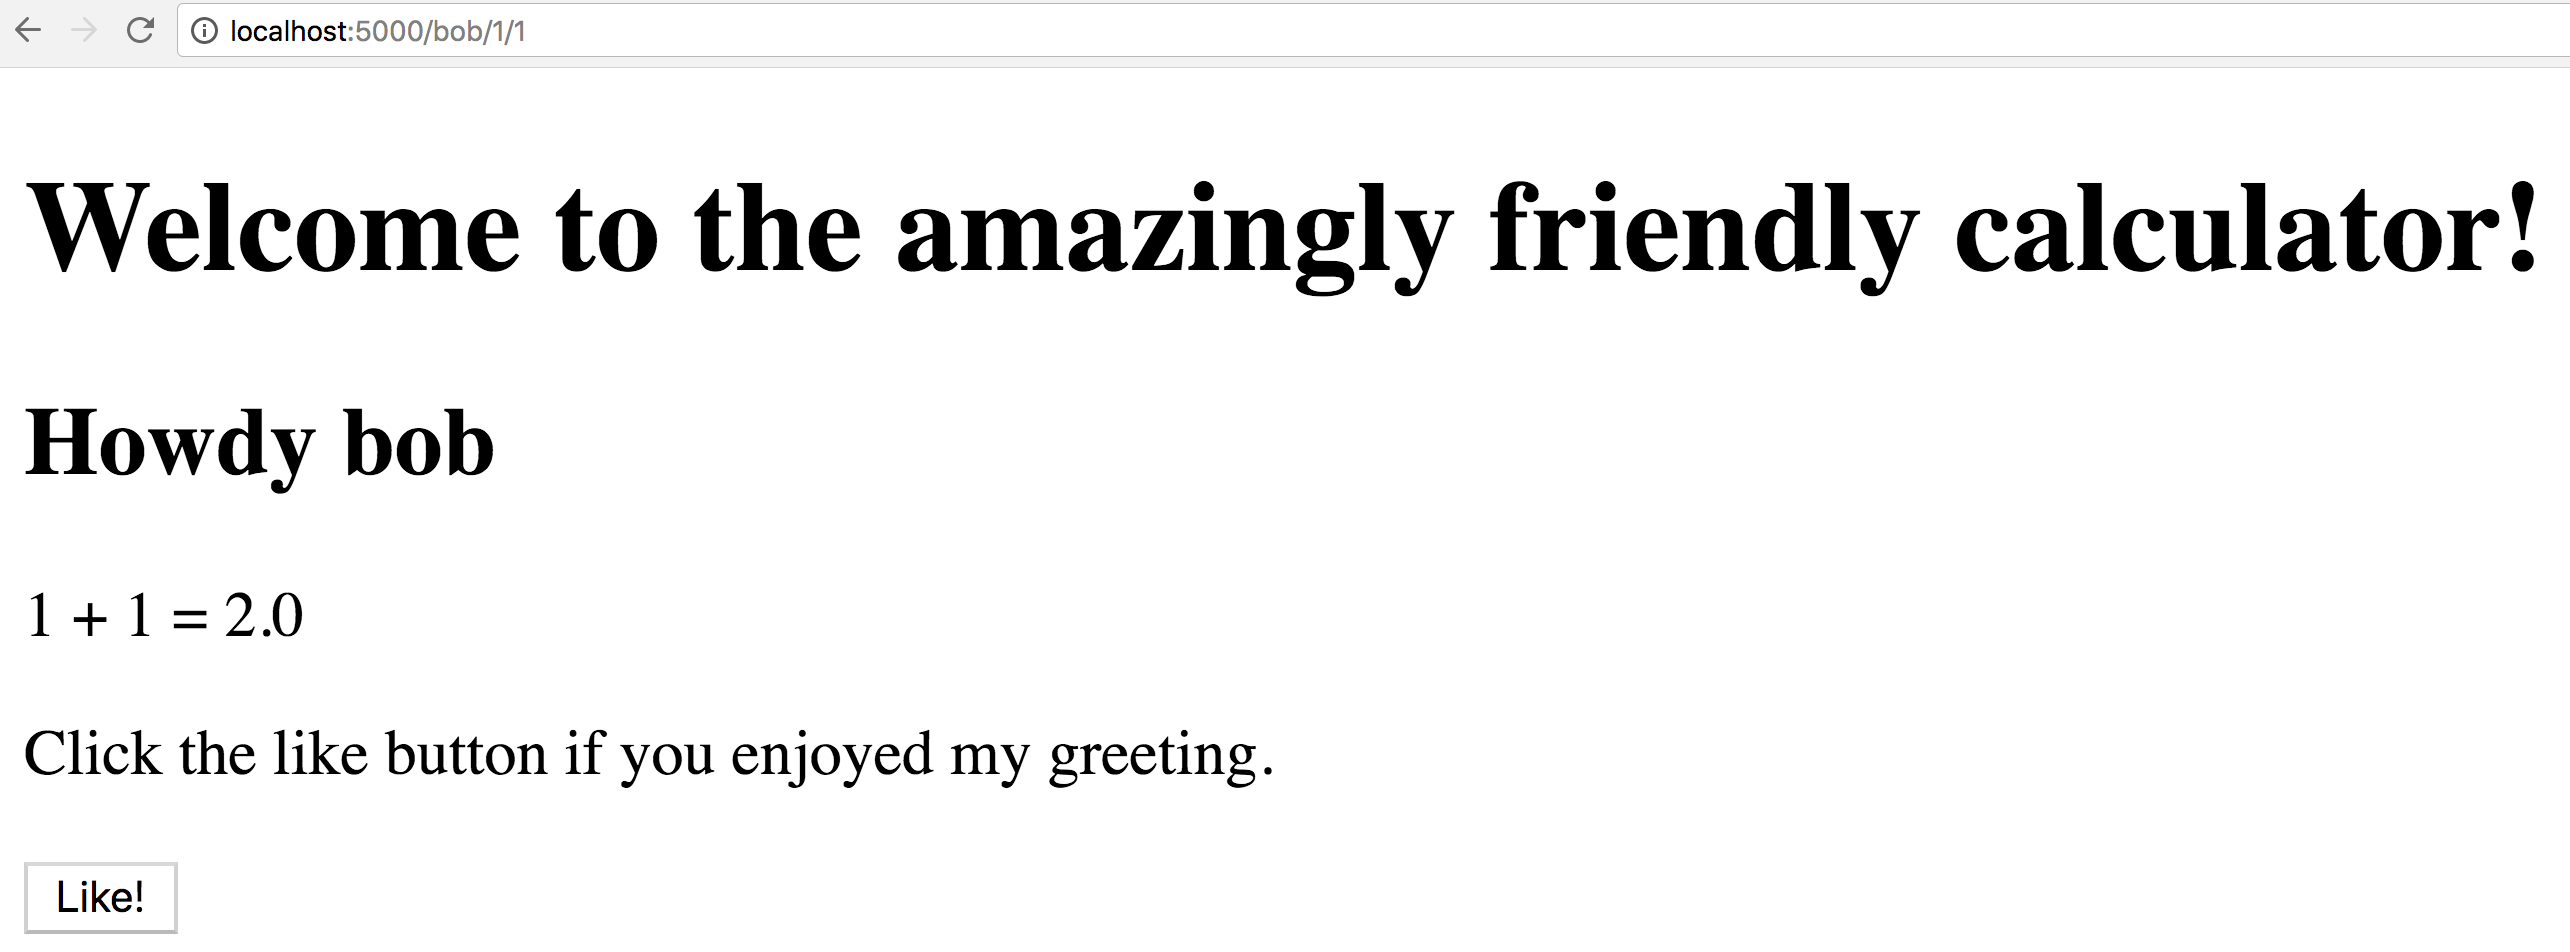
Imagine we worked on an exciting new app - a really friendly calculator. Our calculator implements all the important arithmetic operations and presents the results together with a friendly personalized greeting.
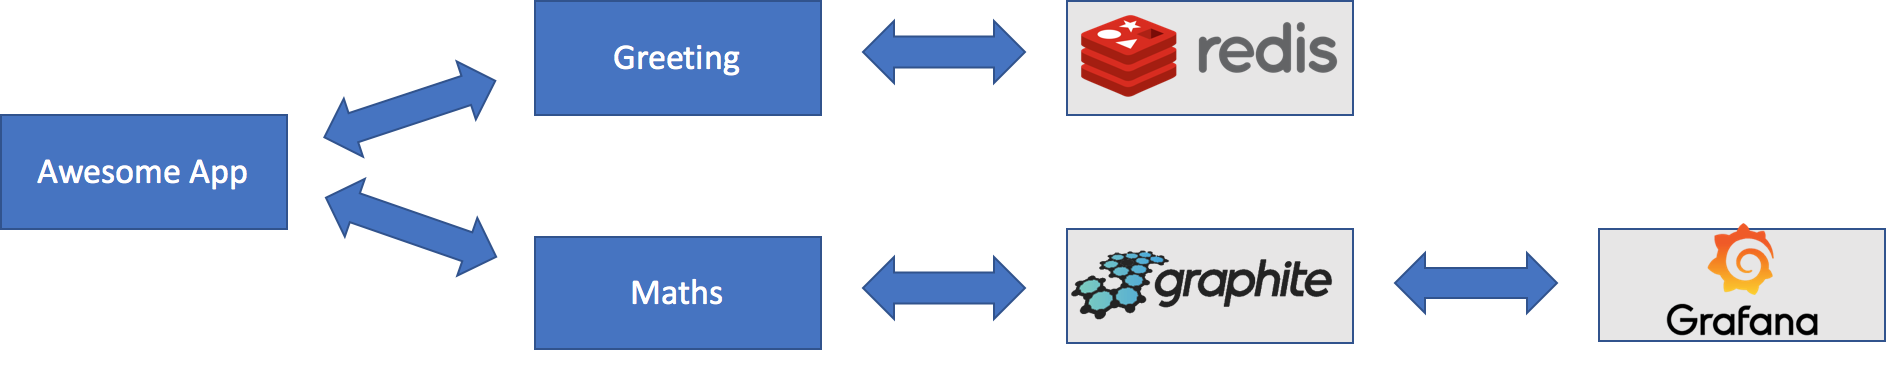
Our calculator app therefore has three main components: A main app with a user interface (this is our Awesome App), a greetings module that generates a personal greeting based on the user's first name, and a mathematics module that implements all desired arithmetic operations.
Now suppose that our organization is already fairly big with numerous developers constantly improving each of these three components. To reduce friction between the developers and allow overall faster development we already broke up our three components into three microservices.
Note that our docker-compose.yml file describes this structure in detail.
Awesome App
Our Awesome App (the main app interface) implements a simple endpoint
(see awesome_app/awesome_app/app.py) which forwards the user's
name to the greetings service and the input variables to the maths service.
Once the greetings and maths services respond, the awesome_app service
fills all the information it has into an interface template
(awesome_app/awesome_app/templates/index.html) to be displayed in the user's browser.
Greetings
Our greetings service takes the user's name and returns a personalized greeting.

Note that the greetings service is reachable at the address http://localhost:5002 whereas
the awesome app service is reachable at a different address http://localhost:5000.
Greetings are likely a matter of personal taste.
The team working on the greetings service has therefore implemented an online
A/B test (greetings/greetings/service.py) which adapts the applied greeting
to the user's taste:
The awesome_app interface presents a Like button that sends a POST request to the
greeting service thus sending a signal that the user enjoyed the greeting they were presented
with. The greetings service then stores this positive signal in a Redis backend
(a popular, fast key-value data store used in numerous web applications akin to ours)
by incrementing the respective greeting counter by one.
Upon requesting a personalized greeting from our greeting service we return the
best-performing greeting 90% of the time (exploitation).
For 10% of the greeting requests we return a randomly chosen personalized
greeting in order to explore whether the user's preference has changed (exploration).
See greetings/greetings/service.py for details.
Also check the terminal window where we started our services where the greetings
service informs us about the number of observed Like signals for each greeting
and the personalization strategy (exploration / exploitation) used.

Mathematics
Our mathematics service implements the arithmetic operations desired by our users
(see maths/maths/service.py).

The team maintaining the mathematics service is interested in seeing which arithmetic operations our users are most interested in. To this end, they attached their service to a StatsD / Graphite service which allows them to easily monitor the number of times each arithmetic operation is invoked. Here the team increments a corresponding counter every time an arithmetic operation is invoked.
This now allows our mathematics team to monitor in real-time service-level metrics in their Graphite web interface:

The dashboard tool Grafana offers a more up-to-date look than Graphite and presents a plethora of dashboard widgets to make all metrics collected through StatsD / Graphite accessible for everyone.
To log into the Grafana dashboard in this sample app, use username admin and password admin.
Click on "Add Datasource" and add our Graphite service as follows:

For how to create dashboards in Grafana please refer to the documentation of the Grafana project:
http://docs.grafana.org/features/datasources/graphite/
Continuous Testing / Integration
We use TravisCI to run tests every time we push code changes to our GitHub repository.
For details on what tests we run and we integrate with TravisCI see the file .travis.yml.
Be aware that we run both small unit tests (greetings/greetings/test_greetings.py) in the
TravisCI cloud and more involved integration tests (integration_tests/test_awesome_app.py)
where we open a headless (windowless) Google Chrome browser, navigate to our Awesome App interface,
and check that the browser sees what we expect to see - all in the TravisCI cloud.
This integration of GitHub with TravisCI presents our developers with rapid feedback on their work (in line with the second way of DevOps).