
transforming confocal microscopy imaging data of retinal vasculature into 3d animation
Advisor: Christine Young, MA, CMI, FAMI
Defense Committee: Rex Twedt III, MS and Leah Lebowicz, MS, EdD, CMI
Content Expert: Gregory W. Schwartz, PhD
Acknowledgements: Special thanks to the Vesalius Trust for their financial support of this project in the form of a Research Grant for Visual Communication in the Health Sciences. Thanks also to Dr. Amani Fawzi for her contribution of relevant diabetic retionpathy clinical imaging for use in the final animation.
RESEARCH QUESTIONs
How can ImageJ and Materialise Mimics be used for segmentation and 3D reconstruction of retinal vasculature confocal microscopy imaging data?
How can the resulting 3D model be used effectively in pre-production storyboard visualization and a 3D animation to communicate dysregulation of neurovascular coupling in diabetic retinopathy to the scientific and clinical research community?
BACKGROUND
According to the American Diabetes Association, diabetic retinopathy is a prevalent disease seen in just over a third of patients with type 1 and type 2 diabetes mellitus (Solomon et al., 2017). Vision loss is a characteristic of the disease, which is considered to be a neurovascular complication of diabetes (Solomon et al., 2017). The retina’s blood flow and blood vessel density are tightly regulated in response to the activity of photoreceptors, glial cells, and the numerous neural cell types that compose the retina to deliver oxygen and nutrients in response to metabolic needs (Nesper et al., 2019). Control of blood flow in such a way is called functional hyperemia or neurovascular coupling and is a cornerstone of the central nervous system’s regulation of blood flow (Kur et al., 2012; Kwan et al., 2020). Higher synaptic activity leads to vasodilation and increased blood flow, likely in response to higher metabolic oxygen needs (Kornfield & Newman, 2014).
sTORYBOARDS
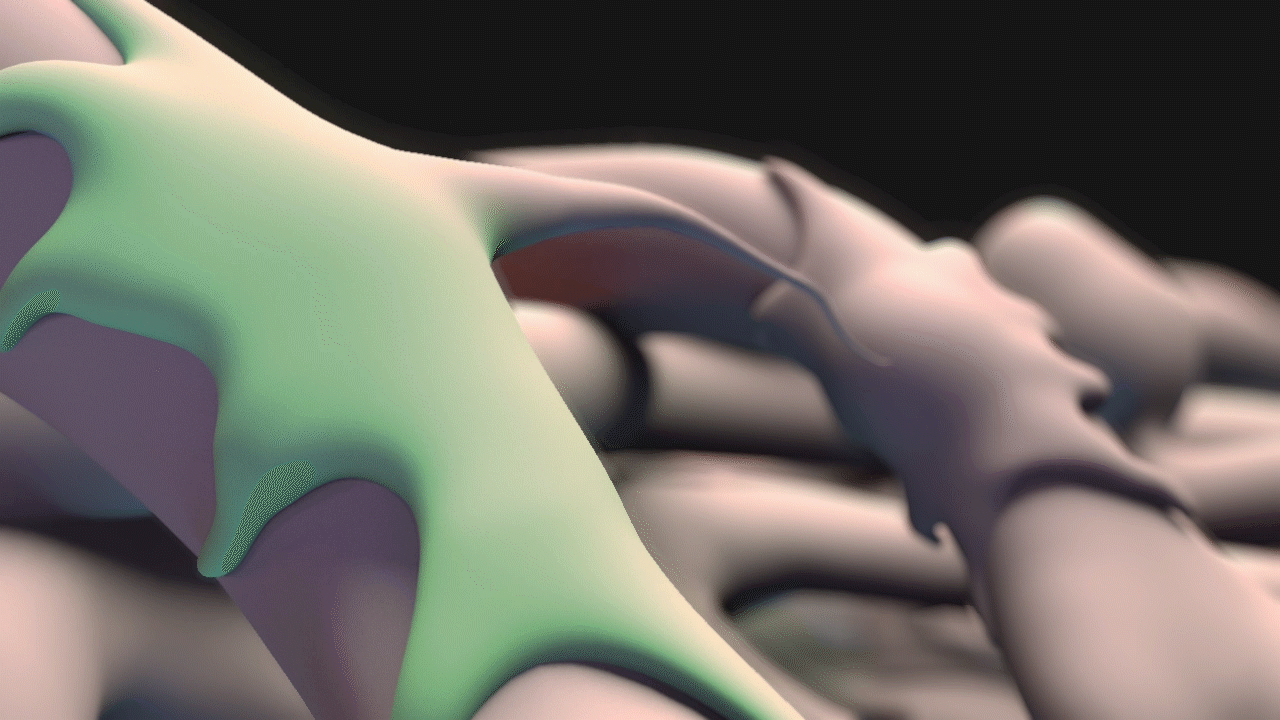
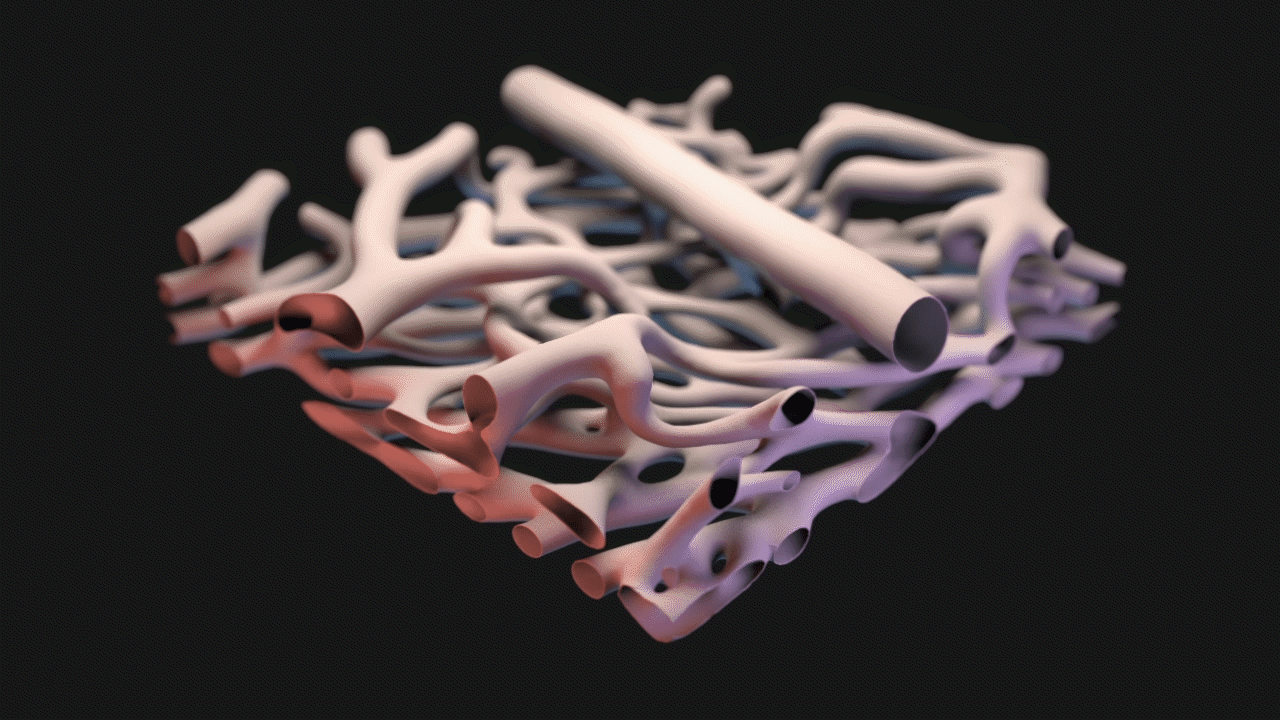
3D Model Created from Confocal Microscopy
Starting with confocal microscopy images provided by Dr. Schwartz, a TIFF image stack was generated. The TIFF images were segmented in Materialise Mimics to generate an STL model that was remeshed in ZBrush, seen below.
ANIMATIC STAGE
Animation for this project was completed in 3DS Max. For the animatic phase, I focused on use of near-final models for accurate timing and motion. The final narration was also complete and incorporated into the animatic phase. DOF and color changes to suggest calcium propagation or structures were done in After Effects. See stills and GIFs from the animatic phase below.
STILLS
significance + impact
Because confocal microscopy is capable of capturing data in three dimensions, it is a useful and effective tool for creating data-driven visualizations. Utilizing ImageJ and Materialise Mimics to take the dataset from the scope to a 3D model that can be fully visualized from all angles is a workflow replicable by scientists and visualization specialists alike.
Diabetic retinopathy, a disease disrupting neurovascular coupling, is growing in prevalence with the increase in diabetes mellitus in the US (Centers for Disease Control and Prevention (CDC), 2020). Visualization of diabetic retinopathy’s pathological processes is important in securing funding to further assist in the efforts against the leading cause of new cases of blindness in US adults.
DOWNLOADS
To learn more about this research or its resulting workflow, please see the links below to download PDF versions of my research poster and methods.