There has been a major pick-up in solar panel imports into Africa over the last 12 months – a shift that is likely to impact almost every country on the continent.
26 Aug 2025
11 Minutes Read
Summary
The latest data provides evidence that a solar pick-up is happening at scale in many countries in Africa.
Solar is not new to Africa. For more than two decades, solar has helped improve lives across Africa, in rural schools and hospitals, pay-as-you-go in homes, street lighting, water pumping, mini-grids and more. However, South Africa and Egypt are currently the only countries with installed solar capacity measured in gigawatts, rather than megawatts. That could be about to change.
The first evidence of a take-off in solar in Africa is now here:
- The last 12 months saw a big rise in Africa’s solar panel imports. Imports from China rose 60% in the last 12 months to 15,032 MW. Over the last two years, the imports of solar panels outside of South Africa have nearly tripled from 3,734 MW to 11,248 MW.
- The rise happened across Africa. 20 countries set a new record for the imports of solar panels in the 12 months to June 2025. 25 countries imported at least 100 MW, up from 15 countries 12 months before.
- These solar panels will provide a lot of electricity. The solar panels imported into Sierra Leone in the last 12 months, if installed, would generate electricity equivalent to 61% of the total reported 2023 electricity generation, significantly adding to electricity supply. They would add electricity equivalent to over 5% to total reported electricity generation in 16 countries.
- Solar panel imports will reduce fuel imports. The savings from avoiding diesel can repay the cost of a solar panel within six months in Nigeria, and even less in other countries. In nine of the top ten solar panel importers, the import value of refined petroleum eclipses the import value of solar panels by a factor of between 30 to 107.
This surge is still in its early days. Pakistan experienced an immense solar boom in the last two years, but Africa is not the next Pakistan – yet. However, change happens quickly. And the first evidence is now here.
Initial analysis suggests the growth may be driven more in distributed solar than in utility-scale solar.
The Chinese solar export data used in this report is an important source of data, but it is only a partial view. More detailed and localised research is needed to fully track solar’s rise in Africa.
The take-off of solar in Africa is a pivotal moment. This report is a call to action, urging stronger research, analysis and reporting on solar’s rise – to ensure the world’s cheapest electricity source, fulfills its vast potential to transform the African continent.
Bottom-up energy transitions fueled by cheap solar are no longer a choice – they’re our future. Tracking these additions is what makes the difference between a messy shift and an organised, accelerated one. When you don’t track, you lose time and opportunities. Pakistan’s experience shows this clearly; Africa’s transition will happen regardless, but with timely data it can be more equitable, planned, and inclusive.

Muhammad Mustafa Amjad
Program Director, Renewables First
The latest solar panel import data
This section takes the latest export data from China’s customs data, to quantify and analyse the import of solar panels into African countries.
The vast majority of Africa’s solar panels come from Chinese imports. That is because China produced 80% of the world’s solar panels in 2024, and is by far the biggest exporter.
Africa depends heavily on imports because domestic solar panel manufacturing is still limited. Morocco recently doubled manufacturing to 1 GW per year, and South Africa has a similar capacity, and there are much smaller manufacturing lines in some countries including Egypt and Nigeria. There are three gigawatt-scale projects in Egypt coming online soon which will begin to change the balance: EliTe Solar (3 GW starting in September 2025), Sunrev Solar (2 GW in 2026) and Masdar (4 GW but no start date yet announced).
The last 12 months saw a big rise in Africa’s solar panel imports
Africa’s solar panel imports set a new record in the 12 months to June 2025, reaching 15,032 MW — a 60% increase on the 9,379 MW imported in the preceding 12 months.
The last time imports surged was in 2023, when South Africa solar imports picked up as the power crisis hit its peak. However, this time is different – much of the pick-up in the last 12 months happened outside of South Africa.
In the last two years, the imports of solar panels have tripled outside of South Africa. They rose from 3,734 MW in the 12 months to June 2023, to 11,248 MW in the 12 months to June 2025.
The increase in imports is more than a single month spike. Monthly imports jumped to a record in December 2024, but have consistently elevated since. While the December surge initially raised questions — potentially driven by Chinese manufacturers meeting year-end sales targets — the data now indicates this is part of a broader, structural trend.
The rise happened in most countries across Africa
The surge in solar is happening across the continent. Twenty countries set new records for solar panel imports in the 12 months to June 2025. All those had imports of at least 30 MW; a further seven countries also set a record, but for much smaller volumes.
The growth rate in some countries was very high. Algeria rose 33-fold in the 12 months to June 2025, compared to the previous 12 months. Zambia rose eightfold, Botswana sevenfold, Sudan sixfold, and Liberia, DRC, Benin, Angola and Ethiopia all more than tripled.
Perhaps the biggest surprise in the data is that 25 countries imported 100 MW or more – up from 15 countries 12 months before.
South Africa remained the biggest solar importer in the 12 months to June 2025. Nigeria was second, overtaking Egypt in the last 12 months, and Algeria rose to third place.
These solar panels will provide a lot of electricity
The volume of solar panels imported over the past 12 months has the potential to significantly increase power generation in many African countries.
If all solar panels imported into Sierra Leone in the last 12 months alone were installed, they would be able to generate electricity equivalent to 61% of reported electricity generation in 2023, the latest available data. For Chad, it would be 49%. In five other countries, imports in total could add electricity equivalent to more than 10% of reported 2023 generation – Liberia (25%), Somalia (15%), Eritrea (15%), Togo (11%), Benin (10%). Altogether, 16 countries would see an increase of at least 5%. Africa in total is only 2%, however, because the rates in South Africa and Egypt are very low, which together account for over half the electricity generation.
Since the total electricity generation is often underestimated in Sub-Saharan Africa, these percentages may be inflated. The generation from Ember’s Electricity Data Explorer (which for these countries is primarily sourced from EIA data, mostly for 2023) excludes non-grid generation; diesel generators add a lot in many countries.
However, Africa is not the new Pakistan – yet. The scale of solar imports into Africa is still nowhere that of Pakistan, which has recently seen one of the steepest rises in solar deployment of any country in the world. In the 12 months to June 2025, Pakistan imported more solar panels than the whole African continent did, despite having one-sixth of the population.
Change happens quickly though. In Pakistan, the imports tripled in just 12 months. The rise of solar in Africa has started in earnest, and it’s more than possible this rise is just the beginning.
More solar panel imports will actually lower total imports
Solar panel imports are a fraction of oil imports. The value of imports of refined petroleum is between 30 to 107 times as large as the import value of solar panels for all of the top ten solar panel importers, except for Algeria.
Many of these solar panels will directly replace diesel generation – and therefore replace oil imports. Wood Mackenzie research from 2022 estimated 17 countries had more diesel generator capacity than on-grid power plant capacity – with 28 GW in Nigeria, 10 GW in Ghana and 8 GW in Kenya. In the last 12 months alone, solar panel imports into these countries was 1.7 GW, 0.3 GW and 0.5 GW respectively.
A solar panel can pay back imported diesel within months. In Nigeria, a 420 Watt solar panel retails for around $60 USD ($0.14 USD/watt), and would produce 550 KWh in a year. At the current diesel price of $0.66 USD per litre, $60 USD of diesel would make only 275 KWh of electricity, implying a payback time of just six months. Even with the recent diesel price rises in Nigeria, diesel is twice as expensive in many other African countries, meaning an even shorter payback period elsewhere. These calculations reflect only the solar panel cost, excluding additional costs for fixtures, inverters and installation.
Of course, the value of solar for African countries is not only in diesel replacement, but also in enabling economic growth through more reliable, cleaner and cheaper electricity access.
How to track Africa’s solar growth
Further evidence is urgently needed to understand this shift, especially as it has the possibility to escalate even faster in a very short time period.
This report provides significant new evidence of a very recent and sizable step-up of solar in Africa, across most countries, and of the scale that could significantly expand the electricity systems of many countries.
This final section of the report looks at how to understand the Chinese customs data – on which this report is based – and how other research can help add further evidence to understand how much solar is being installed and where.
What the Chinese customs data does – and does not – tell us
The Chinese customs data (GACC) has been used by Ember – and other research organisations – to track solar panel exports, including being a vital source to track Pakistan’s solar boom.
Generally, the data seems to be quite accurate, although it is hard to be sure. There are two parts to calculate the solar imports: the solar panel export values by GACC, and the InfoLink Consulting Group price which Ember uses to convert GACC value data into capacity data.
One key thing to look out for is sometimes exports do not mean imports. In some cases some panels may be re-exported – either by road to neighbouring countries – or reshipped for tariff avoidance or tax avoidance.
When looking at export data, we need to understand the time-gap from exporting the panels to installing the panels. Much of the solar capacity in this report will not be installed yet, and may not even be in the country yet. First, there is a one-to-two month shipping time from China to Africa. Second, the solar panels are not immediately installed, they are often put into storage: in 2023, it was estimated that 80 GW of solar panels were stocked in warehouses across the EU – over a year’s worth of installations.
The completeness of the GACC data (for every country in the world), and the up-to-date nature (released around 20th of the month for the previous month), makes it an essential source of information. It is available in Ember’s China Solar Export Explorer within two working days of the GACC data release.
Where to look for further evidence
Unfortunately, there is not one definitive piece of evidence to understand the full picture of solar growth in Africa, and much more data, research and reporting is needed.
- Annual capacity data estimates: The IEA has historic annual data and projections to 2030 for many countries. IRENA has annual data on solar additions for all countries.
- Monthly capacity data: Ember publishes monthly solar and wind capacity additions from government sources – but South Africa is the only country in Africa that is seemingly available.
- Electricity generation data: Ember tracks monthly generation data for six African countries (although only four report solar generation). Even where generation data is provided, it often excludes rooftop generation.
- Government registration data: Some countries have registration schemes for connecting solar, however often these are sidelined. For example, in Pakistan, 16 GW of solar panels were imported during 2024, but only 1.2 GW registered to the government’s net metering scheme. The government only requires net metered additions to be registered; there is no need to register if it is for self consumption or off the grid.
- Utility scale projects: Historically, more utility solar than distributed solar has been installed in Africa (16 GW versus 6 GW by 2024, according to the IEA). Global Energy Monitor tracks utility solar projects (>1 MW), and their data shows 10 GW are announced to come online in 2025 (their next update will be published in February 2026). However, an internal analysis of satellite data by Ember shows most have yet to start construction.
- Satellite data: Transition Zero uses satellite data to track solar projects. Their August 2025 update shows just one new Africa project (outside of South Africa) has been identified during 2025.
It is hard at this stage to know how much of the solar installed will be utility versus distributed. It is clear tracking utility projects will be important.
However, in Pakistan almost all the solar was distributed, and many of the drivers there – frequent power outages, high electricity prices, high diesel prices, access to cheap Chinese solar panels and year-round sunshine – are found in many African countries.
Therefore, it is likely part of the recent surge is coming from distributed solar. A quick scan of satellite images already shows solar panels on many shops, offices, churches, government buildings and small factories across many African cities, even in smaller capitals like Monrovia.
One lesson from Pakistan is the time delay and analysis of understanding solar’s growth. Earlier warnings could have better guided government actions – for example, to promote batteries to better help integrate and add value to solar or to prepare the grid for oncoming distributed additions by better planning future capacity needs.
Change can happen quickly. Better data and reporting are vital to understand and support this positive development opportunity for Africa.
Supporting material
Downloads
Acknowledgements
Author: Dave Jones
Contributors: Richard Black, Chelsea Bruce-Lockhart, Daan Walter, Katye Altieri, Kingsmill Bond, Kostantsa Rangelova, Libby Copsey, Matt Ewen, Rini Sucahyo, Sam Butler-Sloss, Kavya Sharma.
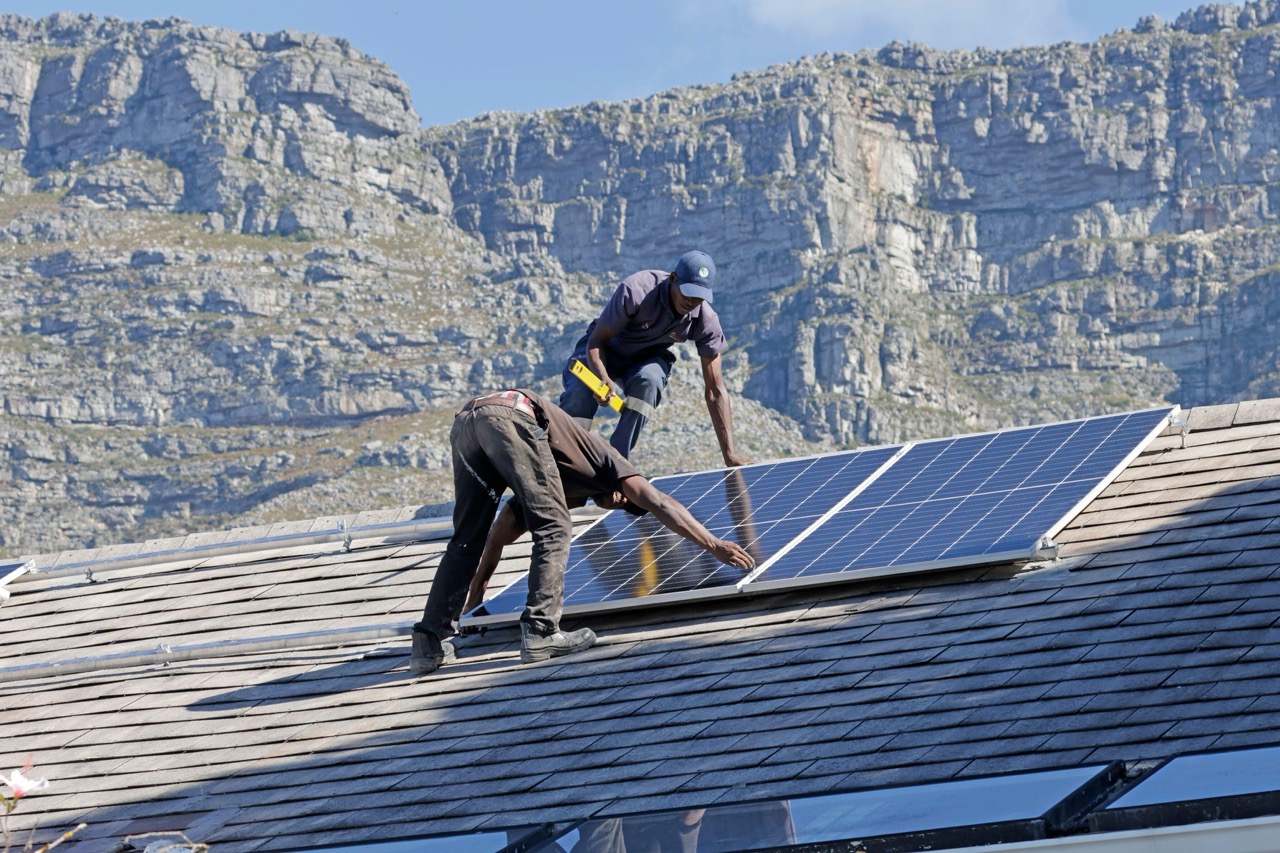
Featured Image Credits: Suretha Rous / Alamy Stock Photo