Here’s a question most people don’t ask until it’s too late: what is your AI coding assistant actually doing?
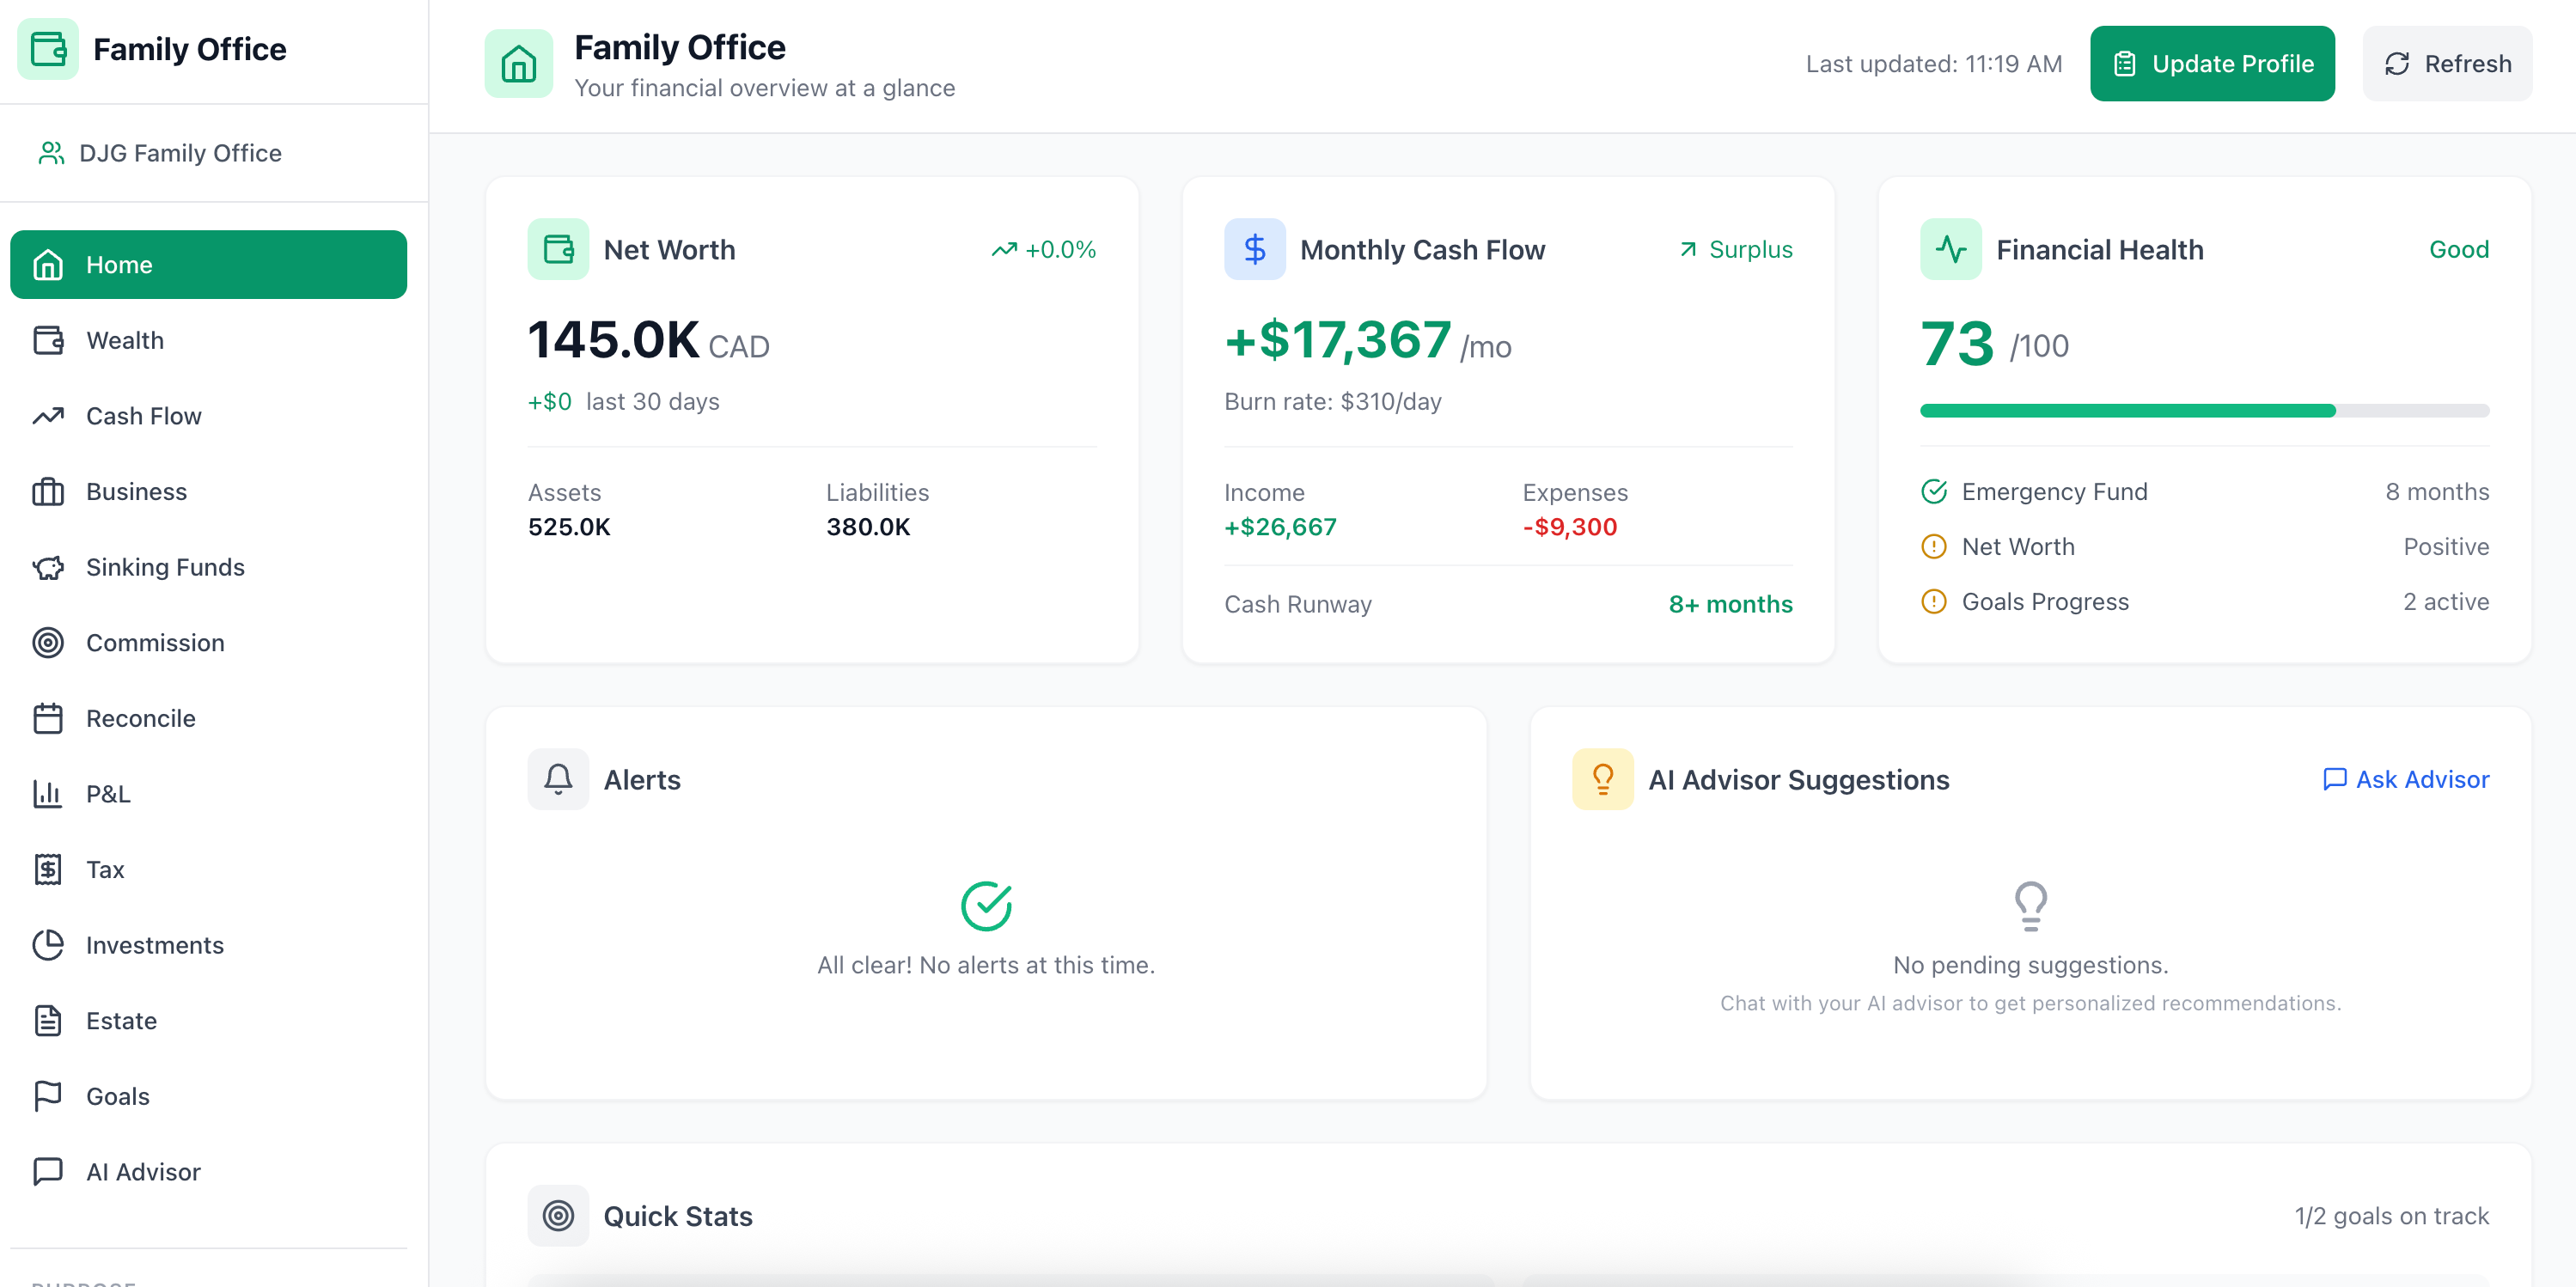
I use Claude Code as my daily driver — not just for writing code, but for building full applications, debugging complex issues, and architecting systems. One of my side projects is a Family CFO Dashboard: a personal finance system where I track goals like my daughter’s college fund, process payslips, model tax scenarios, and run “what if” projections across investments.
Screenshot of my Family CFO Dashboard. Numbers are not real :)
On a typical day, I run 20-50 conversation turns across multiple projects. That’s hundreds of prompts, tool invocations, and responses per week.
And until recently, all of that institutional knowledge vanished the moment I closed a terminal.
Think about that. The debugging session where Claude helped me fix a goal-saving bug by tracing through React state, reading error logs, and identifying a CSRF token issue. The architecture discussion where I asked Claude to design a “trickle-down” system — if I update my salary, it should automatically recalculate taxes, update net worth projections, and flag any goals that are now underfunded. The prompt where I fed it a podcast transcript about “purpose-driven wealth management” and asked it to extract actionable features for my dashboard.
All gone.
This isn’t just nostalgia. There’s real value in that data:
Prompt patterns — Which prompts consistently produce great results? Which ones need rework?
Tool usage — How is Claude actually using file reads, grep searches, and bash commands to solve problems?
Session structure — What does a productive 45-minute session look like vs. one that spins its wheels?
Cross-project learning — Are there patterns from one codebase that transfer to another?
I’m a Principal AI Architect. I spend my days helping enterprises build production AI systems with proper observability, evaluation, and monitoring. The irony of not having that for my own AI tool wasn’t lost on me.
So I built it.
My first attempt was straightforward. I wrote a Python hook (log-prompt.py) that captured every prompt I submitted to Claude Code and appended it to a markdown file.
Here’s what it looked like:
# The old approach: capture user prompts to a flat markdown file
def log_prompt(prompt: str, staging_file: Path) -> None:
    timestamp = datetime.now().strftime("%Y-%m-%d %H:%M")
    formatted_prompt = format_prompt_for_log(prompt)
    entry = f"\n`[{timestamp}]` {formatted_prompt}\n→ *[outcome pending]*\n"

    with open(staging_file, 'a') as f:
        f.write(entry)
The hook fired on UserPromptSubmit — every time I hit Enter in Claude Code. It wrote to .claude/PROMPT_LOG_STAGING.md, which I’d periodically review and promote the best prompts to a curated PROMPT_LOG.md.
The output looked like this:
# Prompt Log Staging

`[2026-01-18 14:30]` I downloaded all my payslips from my new job at ClickHouse. Analyze them and extract the data to update my financial situation...
→ *[outcome pending]*

`[2026-01-20 09:15]` Planning ahead, show me the current architecture. I want to implement trickle-down activities — if I update salary, it should recalculate taxes and impact net worth...
→ *[outcome pending]*

`[2026-01-22 21:00]` Im trying to update an existing goal and its not saving. I click on "save changes" and it just stays there...
→ *[outcome pending]*
Simple. Worked. For about two weeks.
Seven problems became obvious fast:
The staging file grew indefinitely. After two weeks of active use, it was thousands of lines. No rotation, no archival, just an ever-growing markdown file.
To keep the file readable, I truncated long prompts. But the prompts that matter most — the detailed ones with context, constraints, and examples — are exactly the ones that get cut off.
The hook only captured what I sent. What Claude did with it? What it responded? Which tools it used? None of that was recorded. I had half the conversation.
Want to find “all prompts related to tax calculations” or “every debugging session for the Goals feature”? Good luck grepping through markdown. Flat text files can’t answer analytical questions.
Prompts weren’t grouped by session. A 9-turn debugging session where I went from “goal not saving” → “showing error logs” → “CSRF token missing” → “still not working” → “hard refresh needed” → “UX still not ideal” looked like 9 disconnected entries. The narrative — the back-and-forth refinement that makes AI coding productive — was lost.
The workflow required me to manually review the staging file and annotate outcomes. I did this exactly twice before it became another task I never got to.
Each project had its own log file. There was no way to see patterns across projects — which prompt structures work universally, which tools get used most, where I waste time.
I realized I was building a toy system for a problem that had production-grade solutions.

I stepped back and recognized what I actually needed:
Structured trace capture — inputs, outputs, tool calls, timing
Session grouping — group turns into conversations
Queryable storage — filter by project, time range, tool usage
A UI for exploration — not grepping markdown files
Cross-project aggregation — one system serving all repos
This is literally what LLM observability platforms do. I’d been building a worse version of something that already exists.
To top it off, ClickHouse join forces with Langfuse, one of the leading AI/LLM Observability solutions. Was this a sign? LOL
Langfuse ticked all the boxes for my use case:
Self-hosted — Data stays on my machine. No third-party seeing my prompts, code, or project details.
Purpose-built — Traces, spans, sessions, generations — exactly the data model I need.
Web UI — Built-in dashboard for exploring sessions without writing queries.
API access — Can query programmatically for future automation.
Open source — No vendor lock-in, no usage limits, no subscription.
Building with AI tools? I publish practitioner build logs like this every two weeks — real architectures, real failures, real solutions from running 17 production AI projects.
Subscribe free to Signal over Noise and get the companion Claude Code Observability Checklist — a one-page setup reference so you don’t have to bookmark this entire post. Grab the checklist from Resources
Here’s what the system looks like:
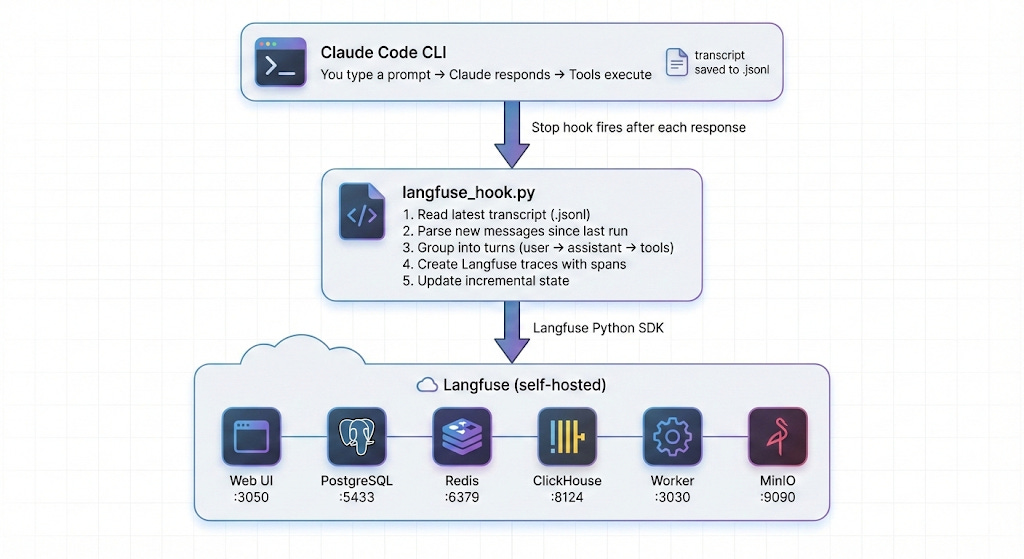
Six services. All running locally in Docker. The web UI at localhost:3050 gives you a full observability dashboard.
I’ve published a template repository with everything you need. Here’s the walkthrough.
Docker Desktop (or Docker Engine + Compose)
Python 3.11+ (3.12 recommended)
Claude Code CLI installed and working
Before you start: I keep a one-page checklist version of this setup on my Resources page. It's what I actually reference when setting this up on new machines. Subscribe free to get build logs like this in the future.
git clone https://github.com/doneyli/claude-code-langfuse-template.git ~/langfuse-local
cd ~/langfuse-local./scripts/generate-env.shThis creates a .env file with cryptographically random passwords for every service — PostgreSQL, ClickHouse, Redis, MinIO, and Langfuse’s encryption keys. It also sets up your initial user account and API keys.
The generated .env will look like:
# Auto-generated credentials
POSTGRES_PASSWORD=a7f2e9...
ENCRYPTION_KEY=4da7ae253b65e670...
NEXTAUTH_SECRET=9f07ea85e0424df5...
SALT=1ff573d1b24f42c1...
CLICKHOUSE_PASSWORD=ch_4d9a...
MINIO_ROOT_PASSWORD=minio_ae4a...
REDIS_AUTH=redis_4954...

# Langfuse project keys (used by the hook)
LANGFUSE_INIT_PROJECT_PUBLIC_KEY=pk-lf-local-claude-code
LANGFUSE_INIT_PROJECT_SECRET_KEY=sk-lf-local-...

# Your login credentials
LANGFUSE_INIT_USER_EMAIL=you@example.com
LANGFUSE_INIT_USER_PASSWORD=change-me-on-first-login
Important: Change the password on your first login to the Langfuse UI.
docker compose up -dThis pulls and starts six containers:
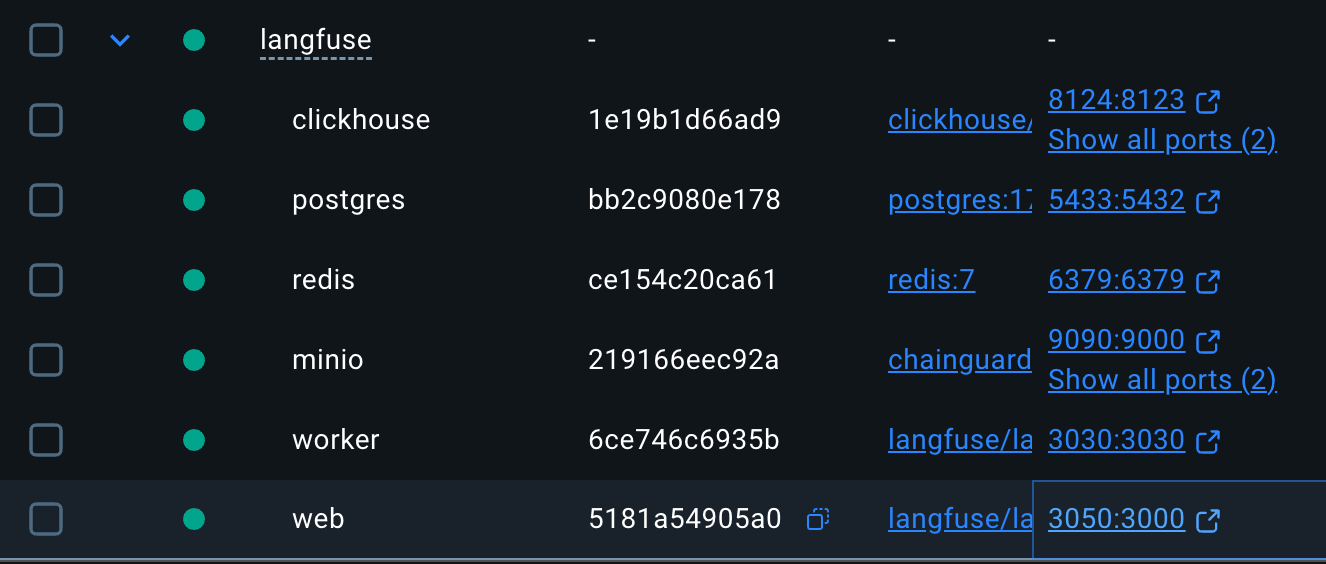
Wait for all services to be healthy:
docker compose psYou should see all six services with status Up (healthy).
Resource note: This stack uses ~4-6GB RAM. Stop it when you’re not using Claude Code:
docker compose down(data persists in Docker volumes).
curl -s http://localhost:3050/api/public/health | python3 -m json.toolExpected output:
{
    "status": "OK",
    "version": "3.x.x"
}
Open http://localhost:3050 in your browser. Log in with the email and password from your .env file.
./scripts/install-hook.shThis script does three things:
Installs the Langfuse Python SDK —
pip install langfuseCopies the hook script — Places
langfuse_hook.pyin~/.claude/hooks/Configures Claude Code settings — Adds the Stop hook and Langfuse env vars to
~/.claude/settings.json
After running, your ~/.claude/settings.json will include:
{
  "env": {
    "TRACE_TO_LANGFUSE": "true",
    "LANGFUSE_PUBLIC_KEY": "pk-lf-local-claude-code",
    "LANGFUSE_SECRET_KEY": "sk-lf-local-...",
    "LANGFUSE_HOST": "http://localhost:3050"
  },
  "hooks": {
    "Stop": [
      {
        "hooks": [
          {
            "type": "command",
            "command": "python3 ~/.claude/hooks/langfuse_hook.py"
          }
        ]
      }
    ]
  }
}
That’s it. No changes to your workflow. Open Claude Code in any project and start working:
cd ~/your-project
claude
Every conversation turn is now being captured. The hook runs silently after each response — you won’t notice it.
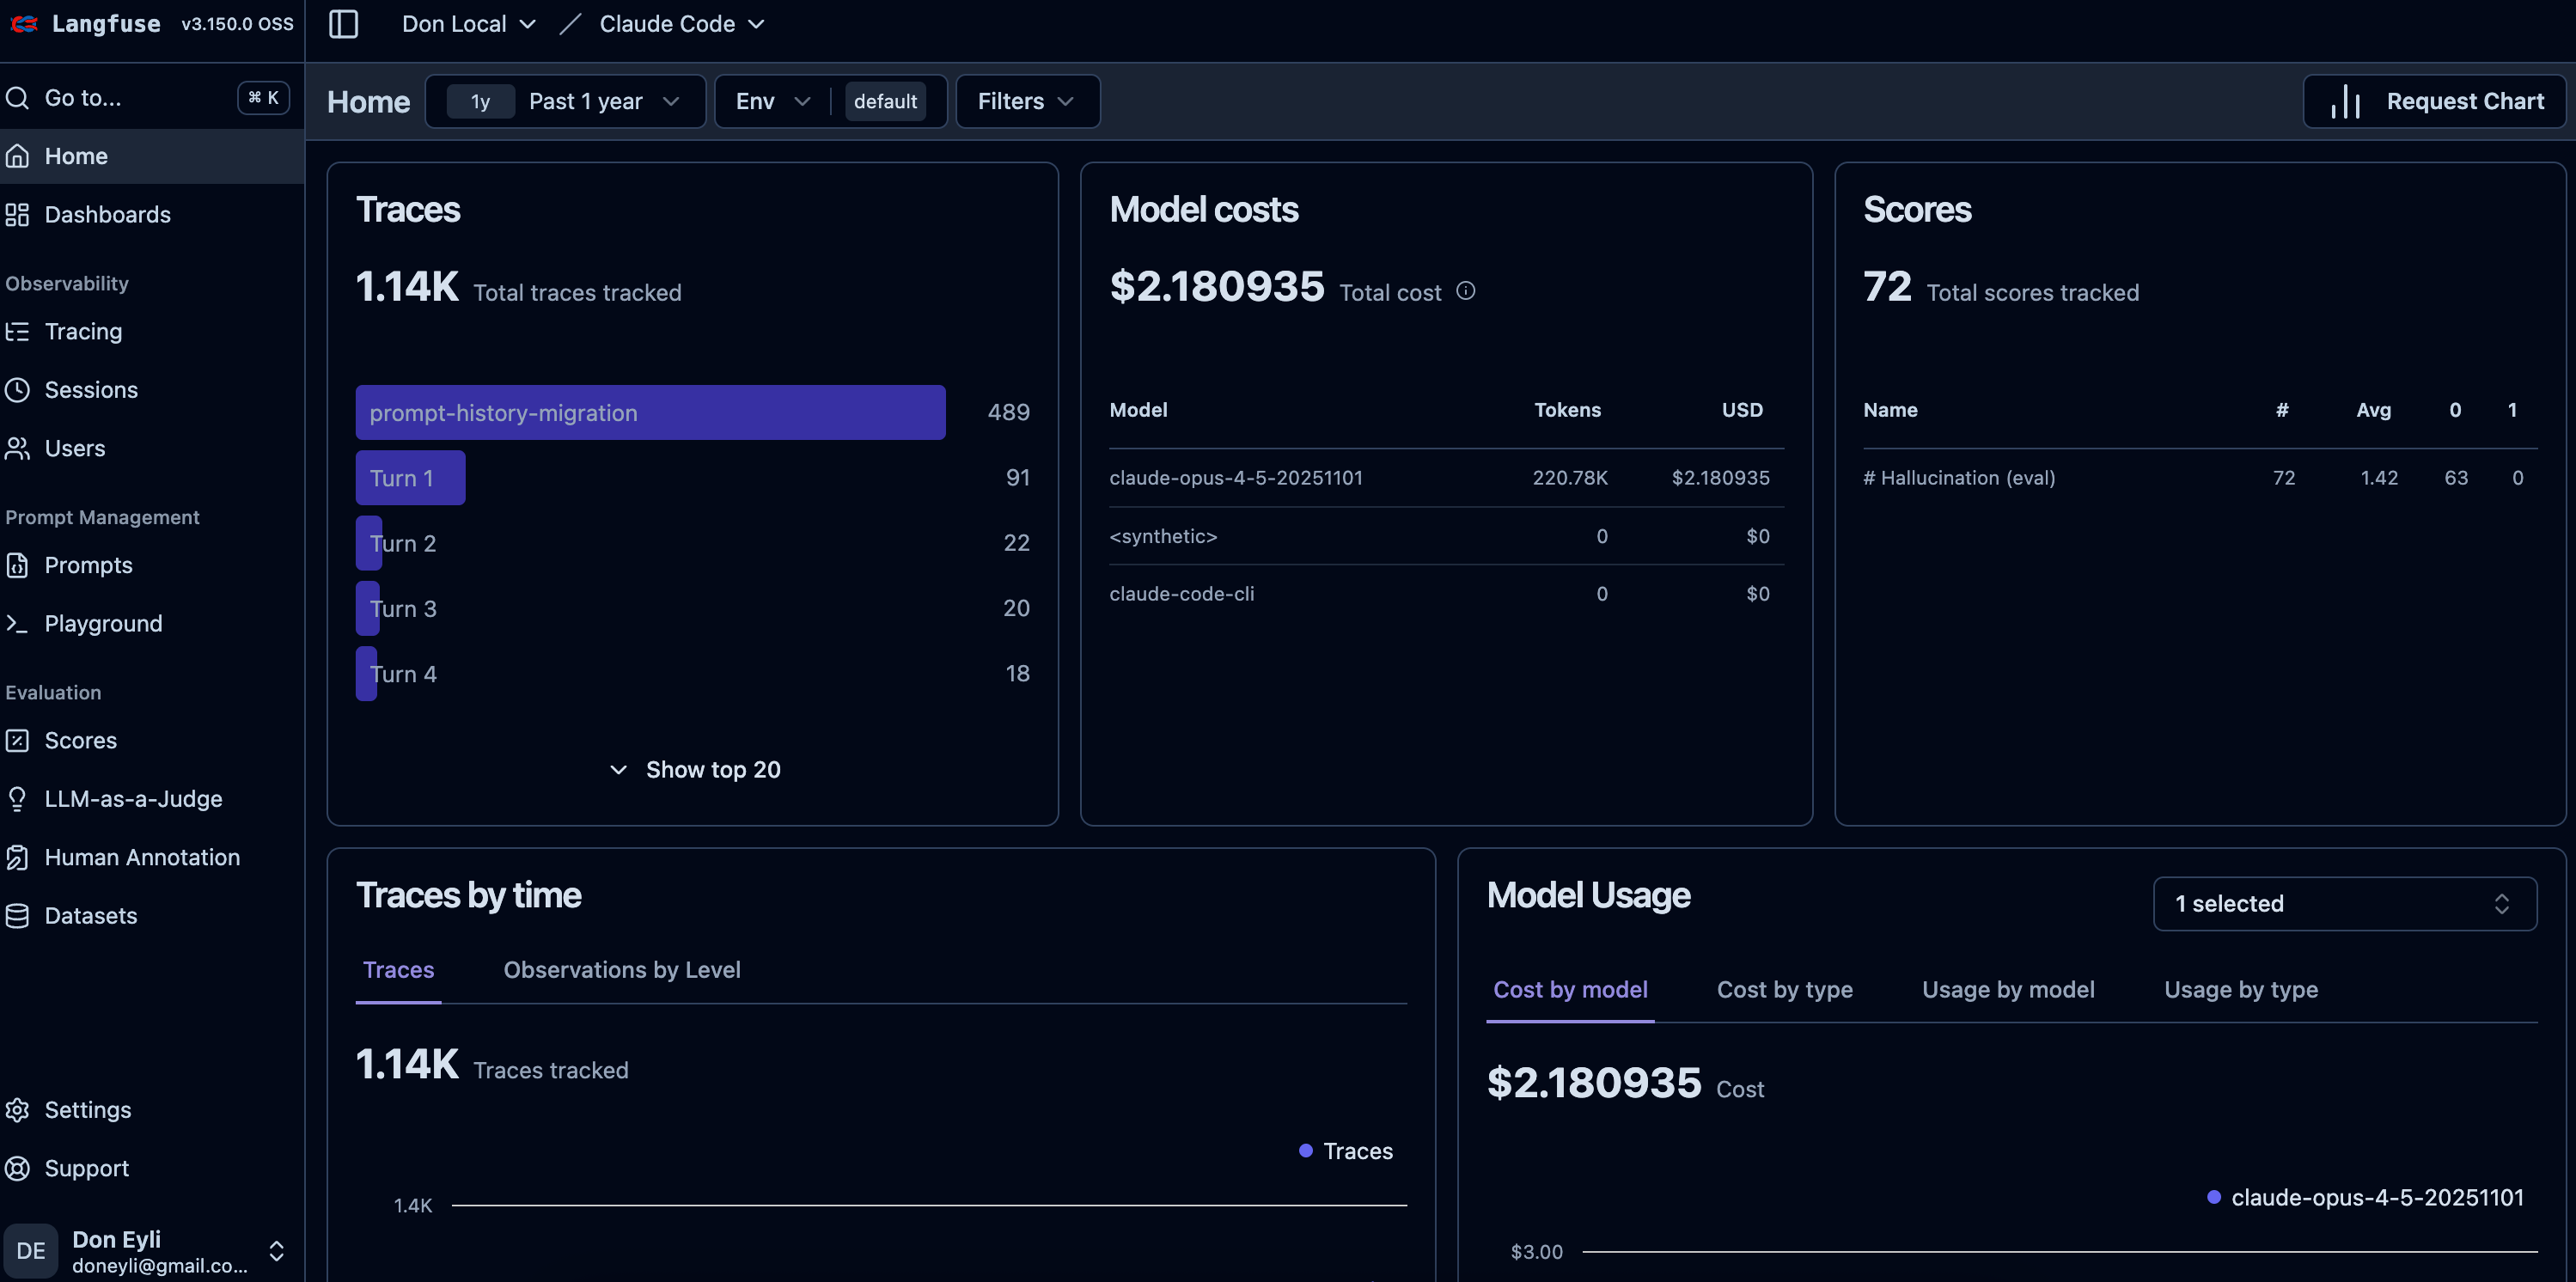
Open http://localhost:3050 and navigate to Traces.
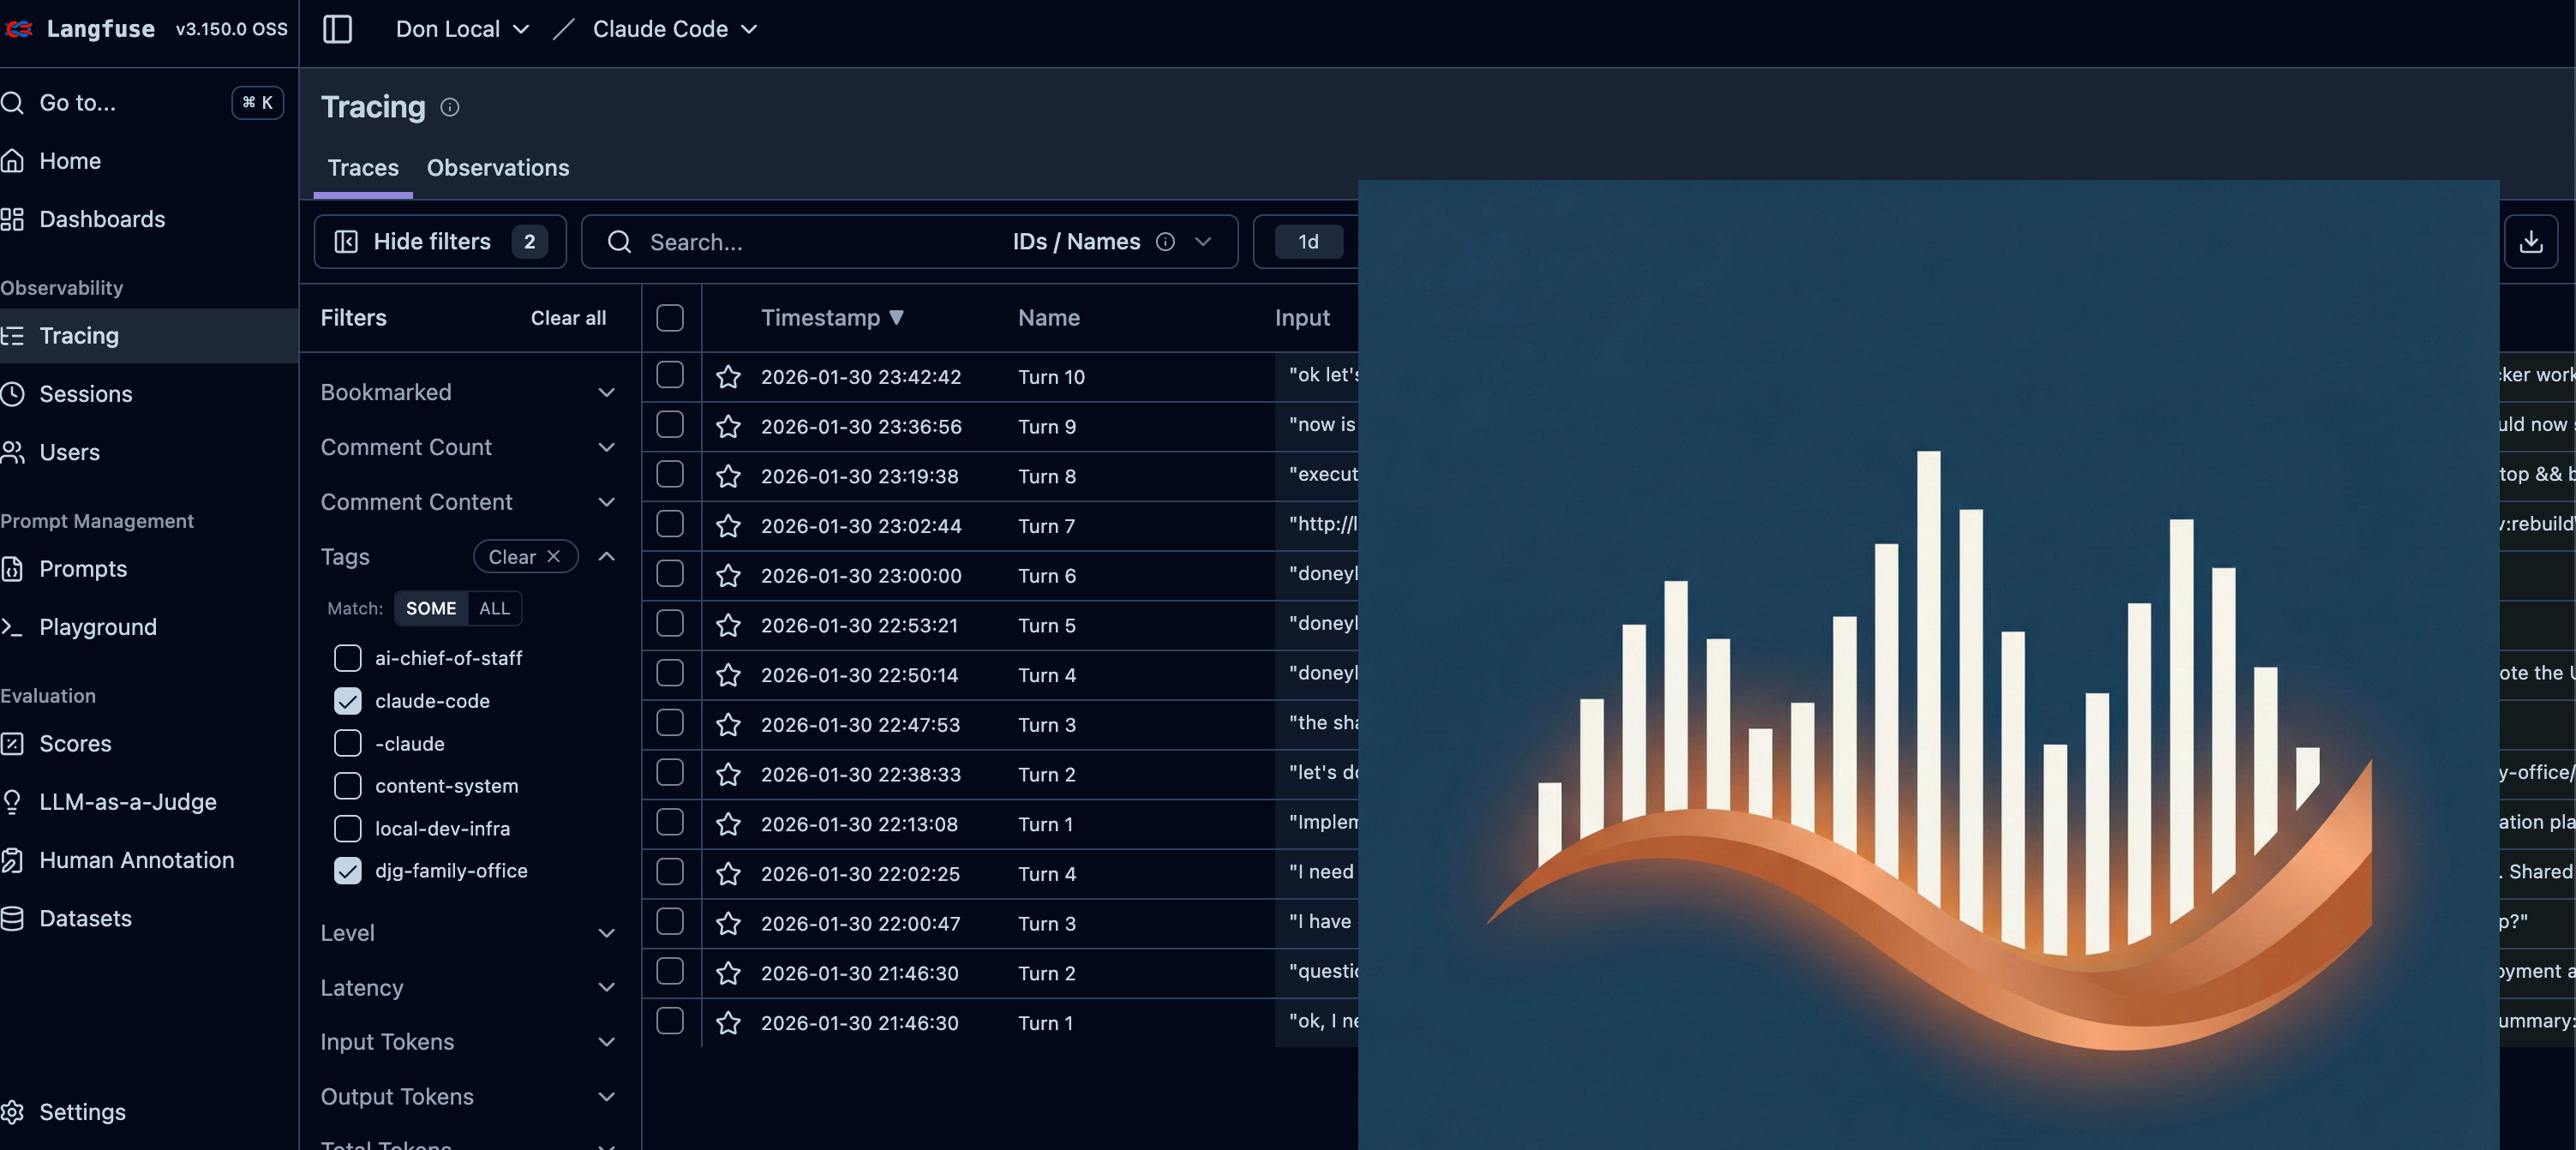
[SCREENSHOT: Langfuse traces list showing multiple conversation turns]
Click into any trace to see the full conversation turn:
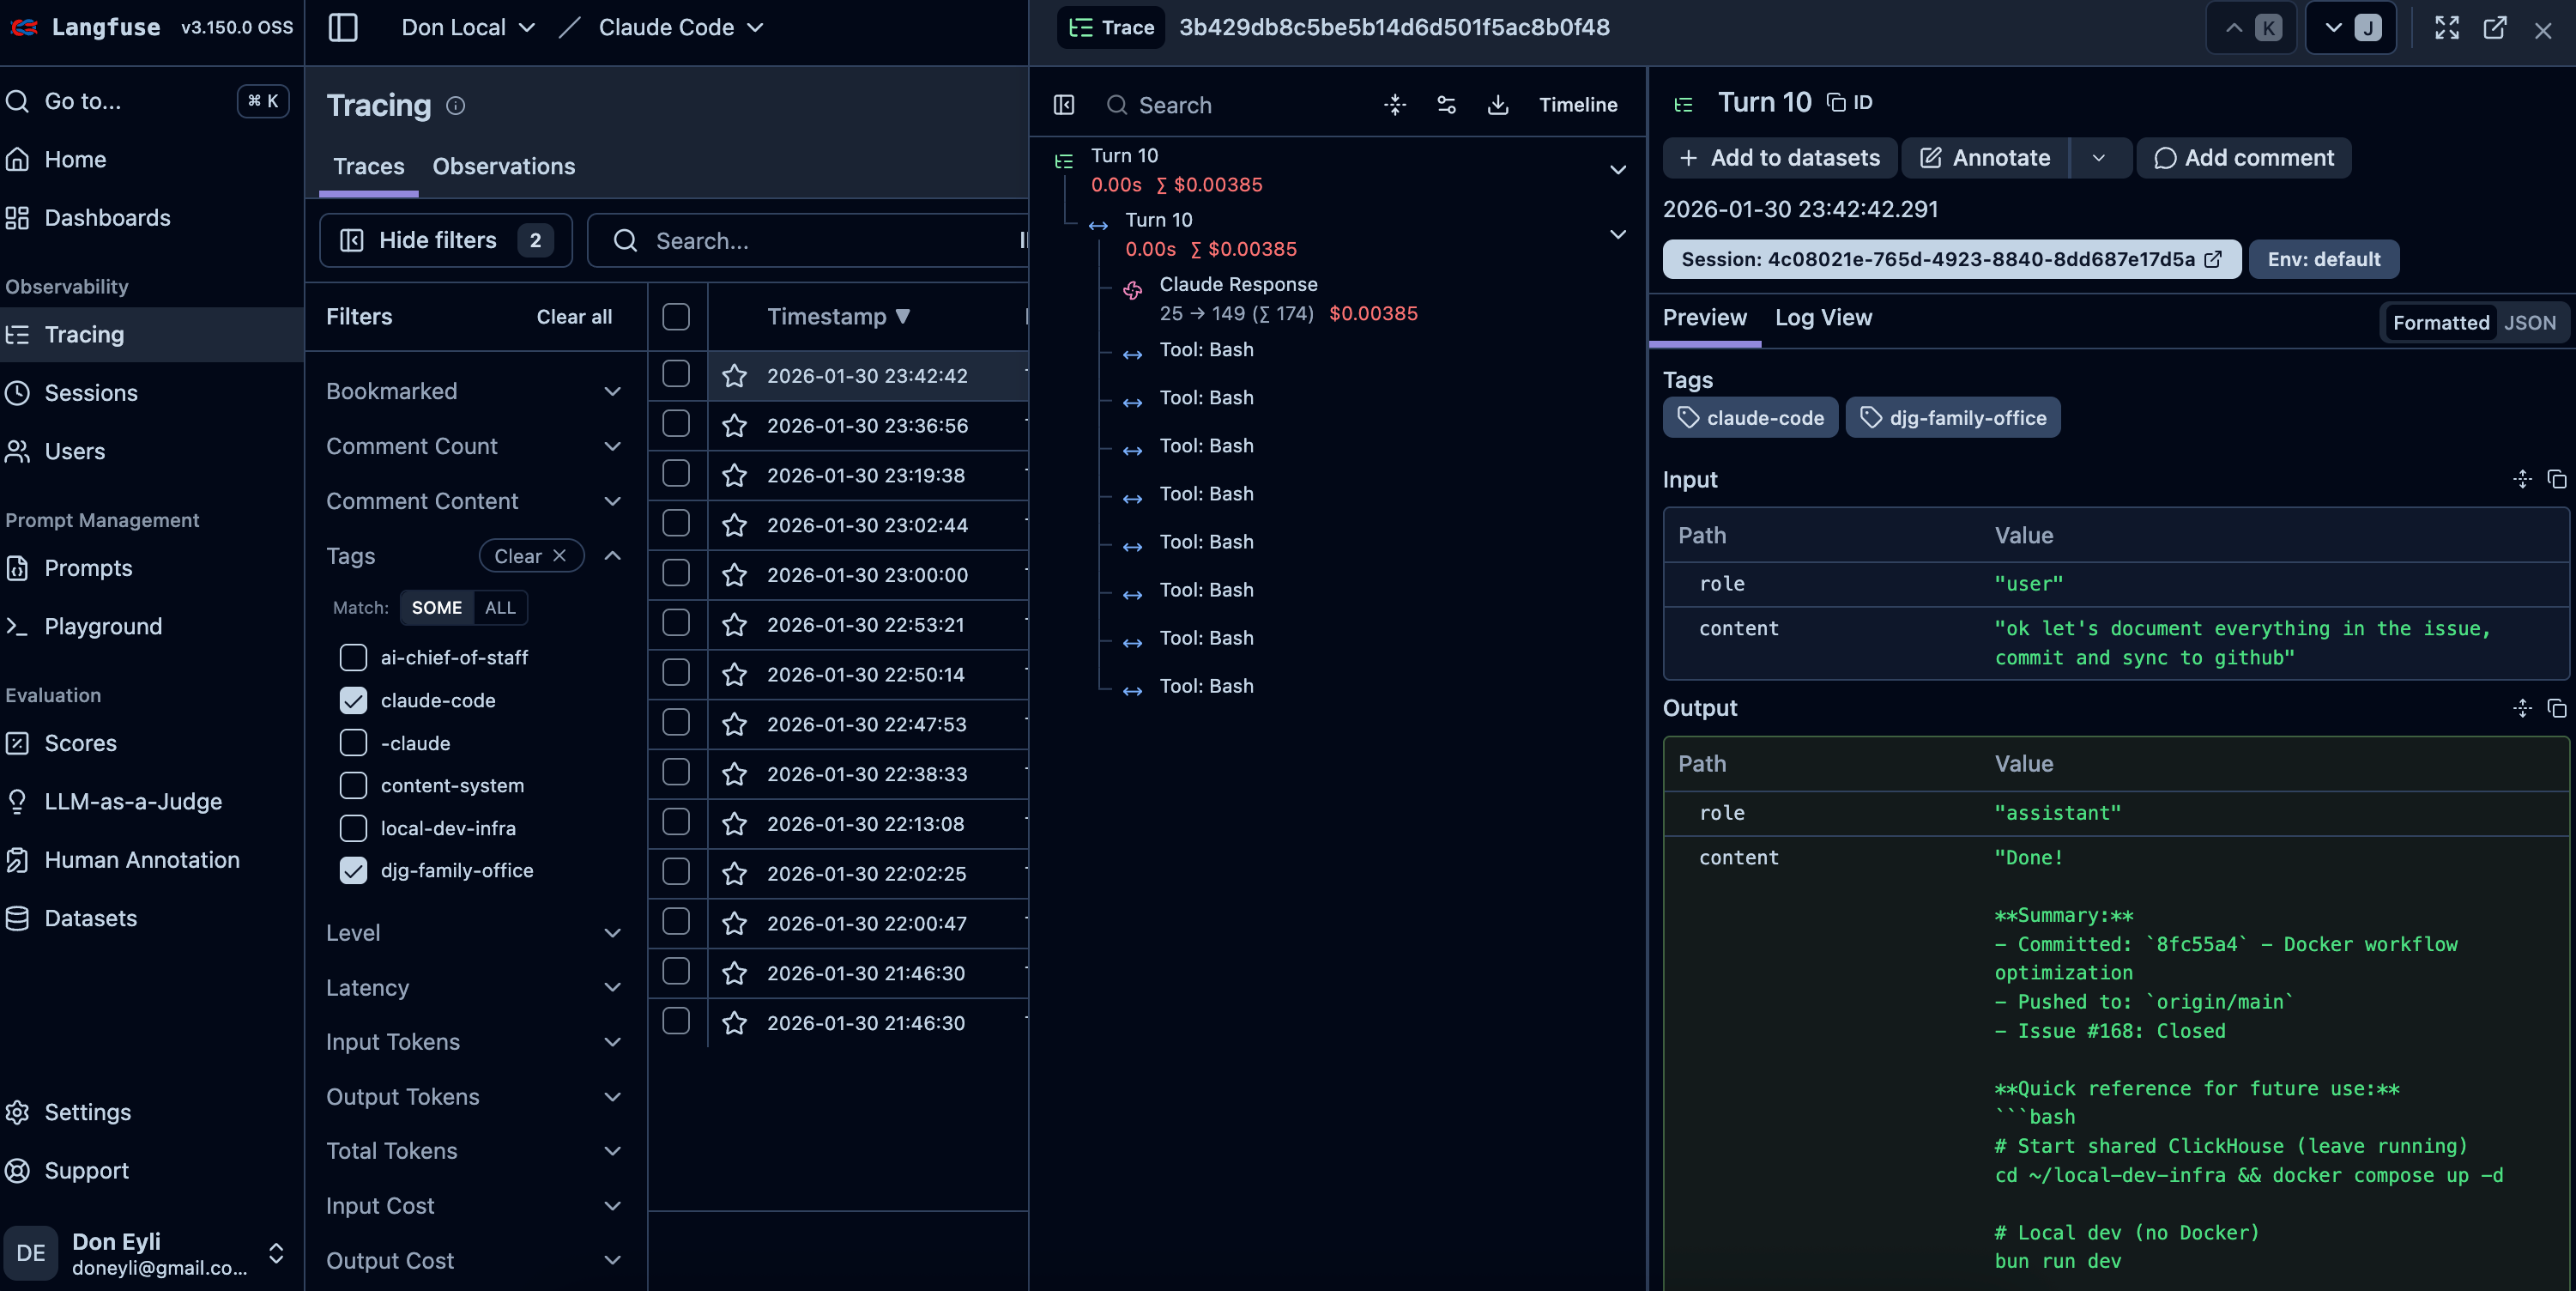
[SCREENSHOT: Single trace detail view showing user input, assistant response, and tool spans]
Each trace contains:
User prompt — Full text, no truncation
Assistant response — Complete output
Tool calls — Every Read, Write, Edit, Bash, Grep, Glob invocation with inputs and outputs
Model info — Which Claude model was used
Timing — How long the turn took
Navigate to Sessions to see grouped conversations:
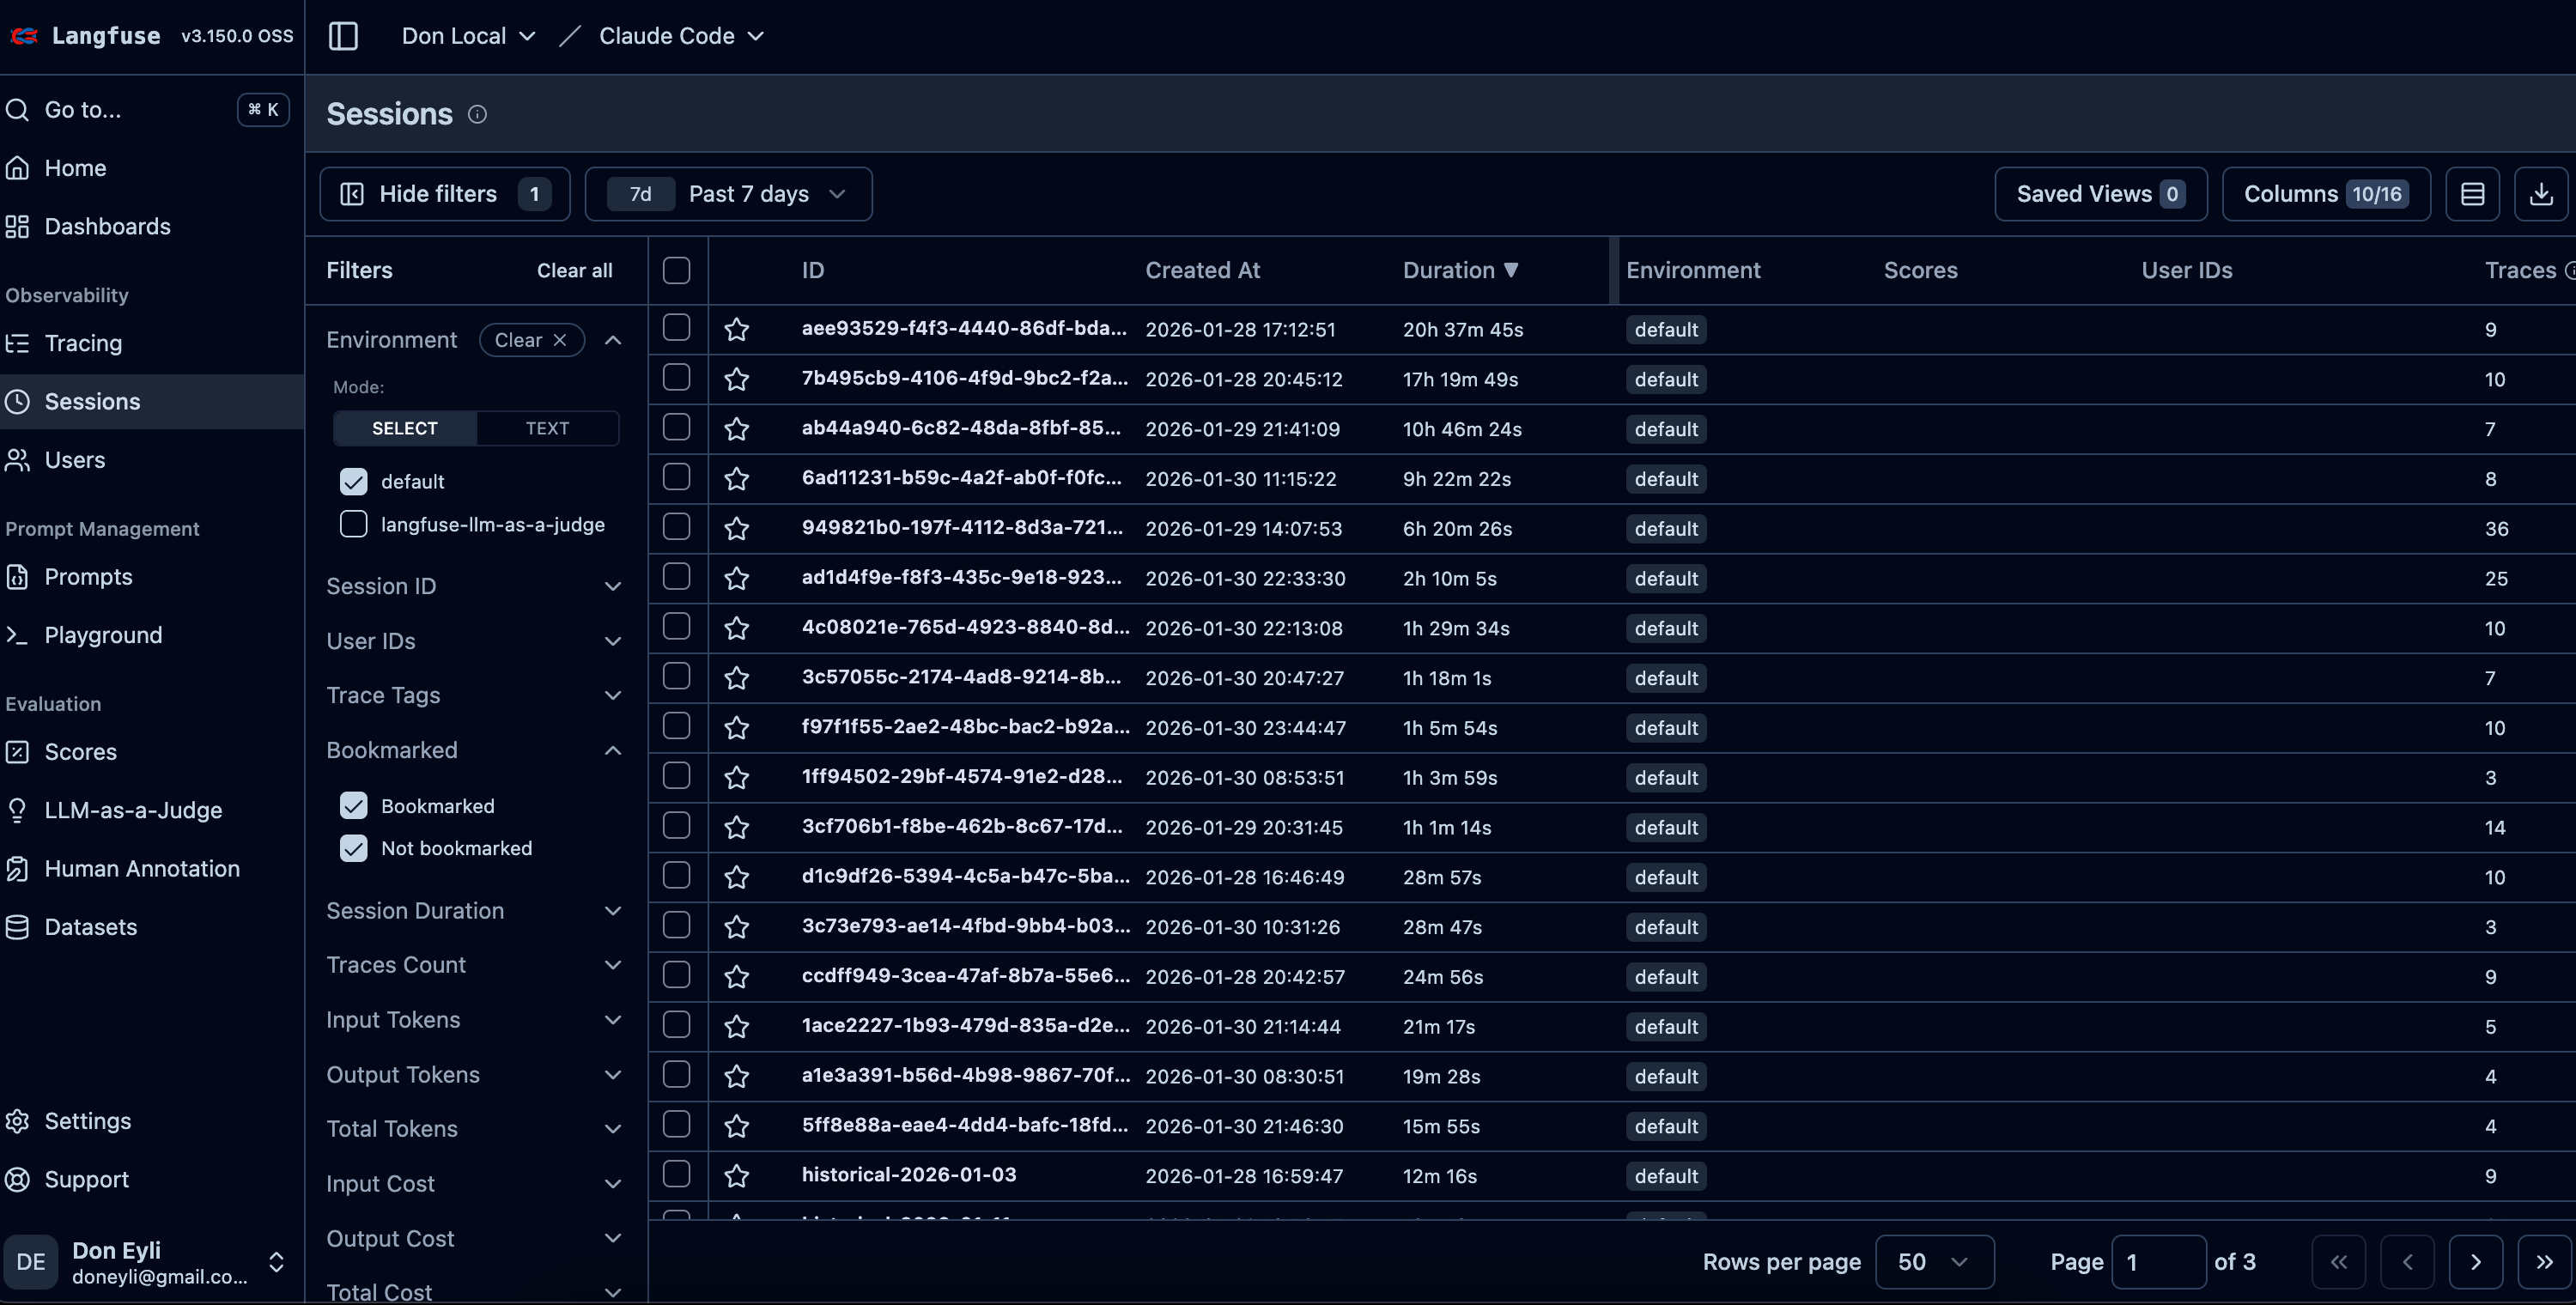
[SCREENSHOT: Sessions view showing conversations grouped by session ID]
The hook is a Python script that runs as a Claude Code “Stop hook” — it fires after every assistant response. Here’s the key logic:
Claude Code stores conversation transcripts as .jsonl files in ~/.claude/projects/<project-dir>/. The hook finds the most recently modified one:
def find_latest_transcript():
    projects_dir = Path.home() / ".claude" / "projects"
    # Find the .jsonl file with the newest modification time
    for project_dir in projects_dir.iterdir():
        for transcript_file in project_dir.glob("*.jsonl"):
            # Track the newest file across all projects
The hook tracks how far it’s read in each session using a state file (~/.claude/state/langfuse_state.json). On each run, it only processes new lines:
session_state = state.get(session_id, {})
last_line = session_state.get("last_line", 0)

lines = transcript_file.read_text().strip().split("\n")
# Only process lines[last_line:]
This means the hook runs in under a second, even after hundreds of conversation turns.
The transcript is a flat list of messages. The hook groups them into turns: user prompt → assistant response(s) → tool results.
for msg in new_messages:
    role = msg.get("type") or msg.get("message", {}).get("role")

    if role == "user":
        # New turn starts — finalize previous turn
        if current_user and current_assistants:
            create_trace(...)
        current_user = msg

    elif role == "assistant":
        # Accumulate assistant messages (may be split across multiple)
        current_assistants.append(msg)
Each turn becomes a trace with child spans:
with langfuse.start_as_current_span(name=f"Turn {turn_num}", ...):
    # Root span = the full turn

    with langfuse.start_as_current_observation(
        name="Claude Response", as_type="generation", ...
    ):
        pass  # LLM generation observation

    for tool_call in all_tool_calls:
        with langfuse.start_as_current_span(
            name=f"Tool: {tool_call['name']}", ...
        ):
            pass  # Tool invocation span
Every exception exits with code 0. The hook should never block your Claude Code session:
except Exception as e:
    log("ERROR", f"Failed to process transcript: {e}")
finally:
    langfuse.shutdown()
sys.exit(0)  # Always non-blocking
There’s an edge case the basic implementation doesn’t handle: what happens when Langfuse is down?
Maybe Docker stopped. Maybe you rebooted and forgot to start the containers. Maybe the Langfuse services crashed. In the original implementation, those traces were silently lost.
That bothered me. I’m capturing this data precisely because I want a complete record. Gaps defeat the purpose.
So I added a fallback: a local queue that catches traces when Langfuse is unreachable and drains them automatically when the connection returns.
Hook runs
    │
    ▼
Health check (2s socket timeout)
    │
    ├── UP ───► Drain queue ───► Process current turn ───► Send to Langfuse
    │
    └── DOWN ──► Parse turn ───► Queue to local JSONL
1. Fast health check
Before doing anything, the hook tests if Langfuse is reachable with a 2-second socket connection:
def check_langfuse_health(host: str, timeout: float = 2.0) -> bool:
    """Fast check if Langfuse is reachable."""
    try:
        parsed = urllib.parse.urlparse(host)
        hostname = parsed.hostname or "localhost"
        port = parsed.port or (443 if parsed.scheme == "https" else 80)

        sock = socket.socket(socket.AF_INET, socket.SOCK_STREAM)
        sock.settimeout(timeout)
        sock.connect((hostname, port))
        sock.close()
        return True
    except (socket.timeout, socket.error, OSError):
        return False
Why a raw socket instead of an HTTP request? Speed. The hook runs after every Claude response — it needs to be fast. A socket connection test completes in milliseconds when the server is up, and fails quickly (2 seconds max) when it’s not.
2. Local JSONL queue
When Langfuse is down, traces go to ~/.claude/state/pending_traces.jsonl:
QUEUE_FILE = Path.home() / ".claude" / "state" / "pending_traces.jsonl"

def queue_trace(trace_data: dict) -> None:
    """Append a trace to the local queue for later delivery."""
    trace_data["queued_at"] = datetime.now(timezone.utc).isoformat()
    QUEUE_FILE.parent.mkdir(parents=True, exist_ok=True)
    with open(QUEUE_FILE, "a") as f:
        f.write(json.dumps(trace_data) + "\n")
Each queued trace includes a queued_at timestamp so you can see how long it waited.
3. Automatic drain on reconnection
The next time Langfuse is reachable, the hook drains the queue before processing the current turn:
def drain_queue(langfuse: Langfuse) -> int:
    """Send all queued traces to Langfuse. Returns count sent."""
    if not QUEUE_FILE.exists():
        return 0

    traces = load_queued_traces()
    if not traces:
        return 0

    sent = 0
    for trace_data in traces:
        try:
            create_trace_from_data(langfuse, trace_data)
            sent += 1
        except Exception as e:
            log("ERROR", f"Failed to send queued trace: {e}")
            # Stop on first failure, preserve remaining traces
            break

    if sent == len(traces):
        # All sent successfully — clear the queue
        QUEUE_FILE.unlink()
    else:
        # Partial send — keep unsent traces
        remaining = traces[sent:]
        QUEUE_FILE.write_text("\n".join(json.dumps(t) for t in remaining) + "\n")

    return sent
Notice the conservative approach: if any trace fails to send, the hook stops and preserves the remaining queue. No data loss.
4. State still advances
Even when queuing offline, the hook advances its state (last_line, turn_count). This prevents duplicate processing — you don’t want the same traces queued multiple times if Langfuse stays down across several conversations.
I considered running a separate process that periodically retries the queue. But that adds complexity: another thing to install, another thing to monitor, another thing to fail.
The simple approach is better: the queue drains when you next use Claude Code with Langfuse running. Since I’m actively coding when traces matter, the queue drains naturally through normal usage. If I’m not coding, the traces can wait.
If you’re curious whether anything is queued:
# Count pending traces
wc -l ~/.claude/state/pending_traces.jsonl

# View queued traces (one JSON object per line)
cat ~/.claude/state/pending_traces.jsonl | python3 -m json.tool --json-lines
When Langfuse comes back up, the next Claude Code response will drain the queue automatically. You’ll see in the hook log:
2026-01-28 15:23:45 [INFO] Drained 7 traces from queue
2026-01-28 15:23:46 [INFO] Processed 1 turns in 0.8s
By default, the install script enables Langfuse globally — every project is traced. This is what I recommend.
If you have a project where you don’t want tracing (sensitive client work, for example), add this to the project’s .claude/settings.local.json:
{
  "env": {
    "TRACE_TO_LANGFUSE": "false"
  }
}
Claude Code merges project-level settings over global settings, so this override takes effect cleanly.
If you prefer to opt in per project instead of globally:
Remove the
envblock from~/.claude/settings.jsonAdd the env block to each project’s
.claude/settings.local.jsonwhere you want tracing
Once you have a few days of traces, the Langfuse dashboard becomes genuinely useful:
Every trace is tagged with the project name. Filter to see only traces from a specific codebase.
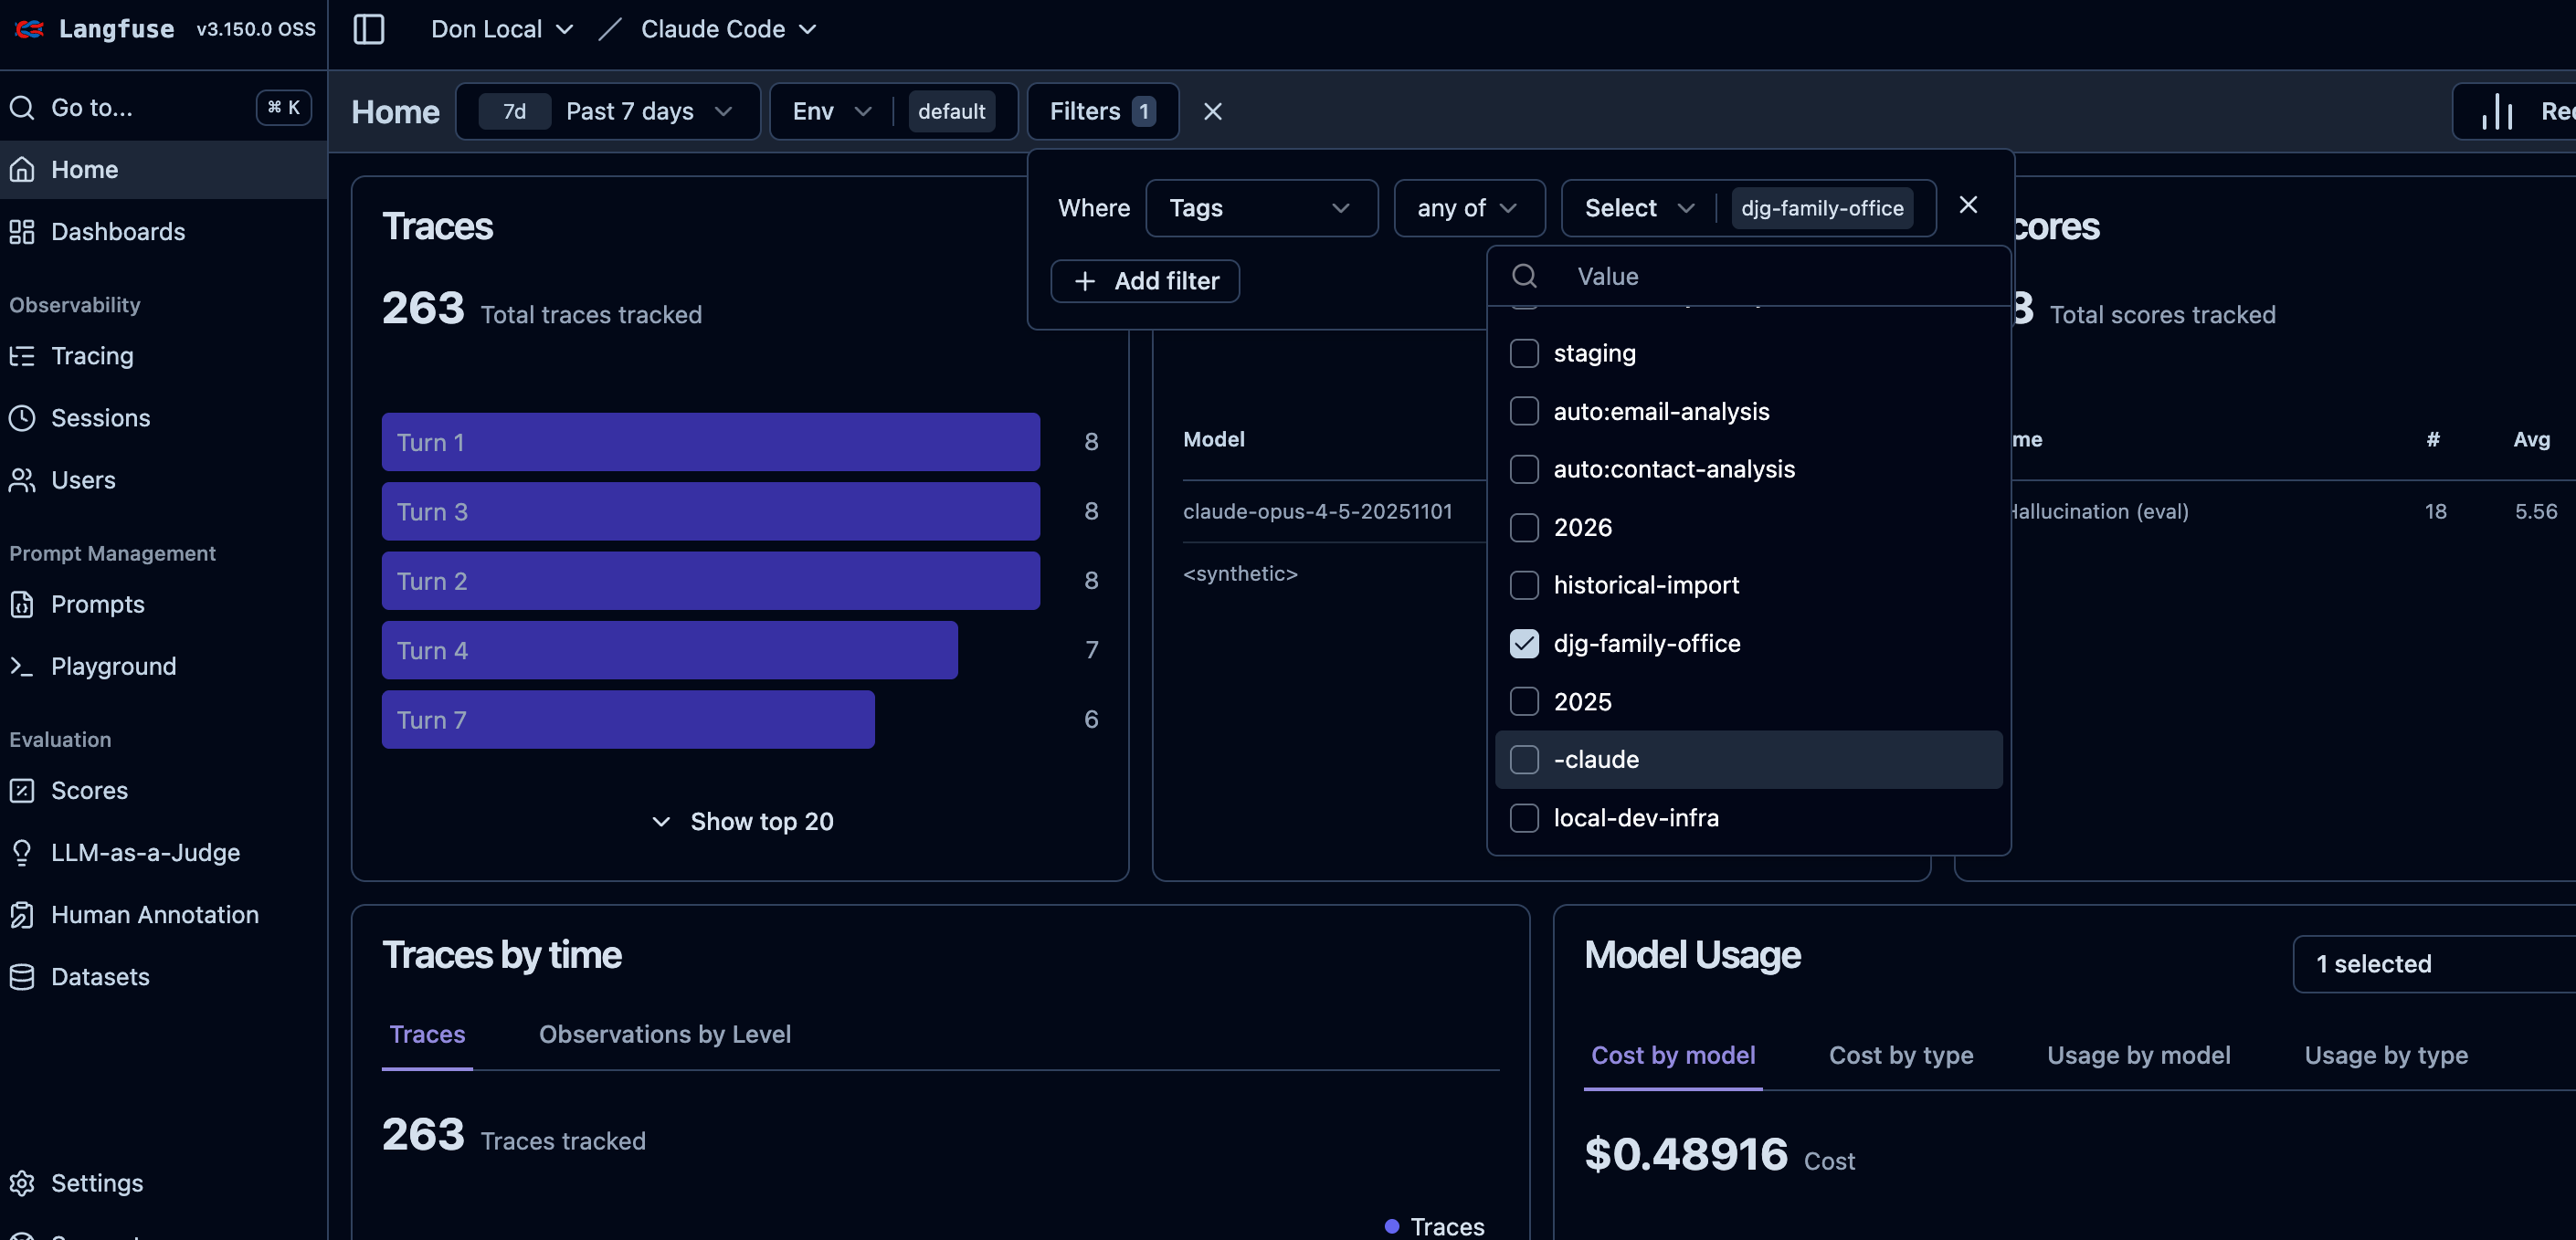
[SCREENSHOT: Langfuse filtered by project tag]
Which tools does Claude use most? Are there patterns in how it solves problems? The tool spans give you visibility into Claude’s “thinking process” — the file reads, searches, and edits it performs.
Search traces by input text to find prompts that produced great results. That architecture prompt where I asked Claude to “design trickle-down activities for salary changes”? I can find it, see exactly how I phrased it, and reuse the pattern for similar requests.
Click into a session to replay an entire conversation chronologically. That 9-turn debugging session for the goal-saving bug? I can see exactly how it progressed: the initial report, the error logs I pasted, Claude’s hypothesis about CSRF tokens, the fix that didn’t work, and finally the cache invalidation solution that did.
If you’re tracking model usage, Langfuse captures which model handled each turn. Useful for understanding your usage patterns across Haiku, Sonnet, and Opus.
Here’s the before-and-after:
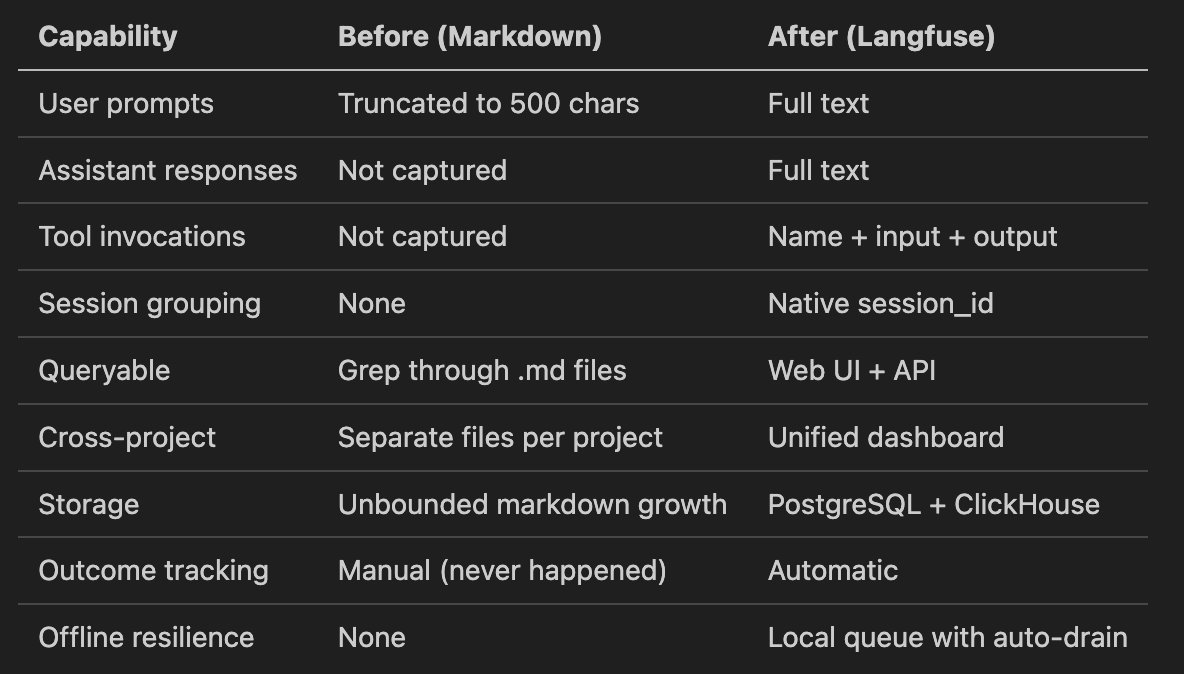
The old log-prompt.py hook captured maybe 10% of what actually happens in a Claude Code session. The Langfuse hook captures everything — and doesn’t lose data when the backend is temporarily unavailable.
But I keep it running 24/7 in my dedicated Home Server
# Start (data persists in Docker volumes)
cd ~/langfuse-local && docker compose up -d

# Stop (when you're done coding for the day)
cd ~/langfuse-local && docker compose down

# Update to latest Langfuse
cd ~/langfuse-local && docker compose pull && docker compose up -d
# Check hook logs
tail -f ~/.claude/state/langfuse_hook.log

# Check hook state
cat ~/.claude/state/langfuse_state.json | python3 -m json.tool

# Check pending queue (if any)
cat ~/.claude/state/pending_traces.jsonl 2>/dev/null | wc -l

# Enable debug logging
export CC_LANGFUSE_DEBUG=true
RAM: ~4-6GB when all six services are running
Disk: ~2-5GB for Docker images, plus data growth over time
CPU: Minimal when idle. The hook itself runs in under a second.
If I stop Langfuse when I’m not actively coding, no problem. Data persists in Docker volumes, so nothing is lost. And if I forget to start it? The queue catches everything until I do.
The template uses these ports: 3050 (web), 5433 (postgres), 8124 (clickhouse), 6379 (redis), 9090 (minio). If any conflict with your existing services, adjust them in docker-compose.yml.
This system captures the raw data. The next layer I’m building is pattern analysis — a skill that queries the Langfuse API to surface insights:
“What were my most complex debugging sessions this week?”
“Which architecture prompts produced the best implementation plans?”
“How many turns did it take to resolve the Goals feature bugs vs. the Tax calculation bugs?”
The data is structured now. I can finally answer questions like “what’s my most productive prompt structure” with evidence instead of intuition.
Everything you need is in the template repo:
github.com/doneyli/claude-code-langfuse-template
Five commands to go from zero to full observability:
git clone https://github.com/doneyli/claude-code-langfuse-template.git ~/langfuse-local
cd ~/langfuse-local
./scripts/generate-env.sh
docker compose up -d
./scripts/install-hook.sh
Then open Claude Code and work normally. Your sessions are being captured — even if Langfuse isn’t running yet.
If you found this useful, these practitioner build logs cover the same stack:
The 3-Layer Claude Code Configuration That Runs 10 Projects
How I structure global, project, and user-level config across a 17-project portfolio. The setup that makes the observability layer above actually manageable at scale.I Built an AI Chief of Staff That Runs My Life While I Sleep
10 autonomous agents running overnight — and the architecture decisions behind them. If the observability post is about seeing what AI does, this one is about letting it act.My AI Agent Had 18 Security Holes. Here’s How I Fixed Every One
What happens when you audit your own AI agents. The findings were worse than I expected — and the fixes changed how I build.
I’m Doneyli, Principal AI Architect @ ClickHouse, previously founding team at Snowflake’s AI practice ($0 to $100M ARR). I build production AI systems and translate what I learn for the enterprise leaders making the decisions.
I publish what I build, what broke, and what it means for your AI strategy. One build log can save your team weeks of R&D.
Subscribe free to Signal over Noise — or if you want early access to every build log plus the working repos, join as a founding member.