Metrics are an essential tool for product people. Like any tool, they need to be used intentionally for maximum utility. And like many of the topics we’ll cover here, they’re more nuanced than they appear on first sight.
When used effectively, metrics:
• Create accountability
• Clarify objectives
• Provide focus
• Facilitate creativity
When used poorly, metrics:
• Create unnecessary data wrangling work
• Stress and burn people out
• Blind you from other critical work
• Add to your org’s confusion
Here are some simple approaches to make metrics work for - and not against - you.
For a general intro on product metrics, check out Startup Metrics for Pirates.
Metrics provide the pulse of your business and feature teams. They’ll tell you if your efforts are working and highlight changes in your users, product, and business. It’s critical to keep them top of mind, but this often sends PMs off on a disproportionate amount of busy work.
If you find yourself constantly refreshing metrics or running reports you may be too focused on metrics. Think about your personal finances. Unless you are in a severe financial position, there is no reason to check your balances or portfolio on a daily (or worse hourly) basis. It’s much healthier for your habits (and your sanity) to have fixed times to look at standard sets of data, say weekly or monthly. You should treat metrics the same way, even critical business ones.
Instead of constantly pulling you need to rely on pushing, passively consuming metrics at regular intervals. Once you’ve determined the right cadence - based on how frequently you expect them to change - set up automated reports to your inbox and scan them when they come in. This will free you up to focus on actually changing them instead of mindlessly and compulsively checking them. It may feel more like “work” than compulsively checking social media, but it’s the same thing. (I have another topic in mind about over-using analytics tools that I may cover - the same rule applies).
As a prerequisite, take the time to figure out what those metrics are and how they should be structured. Do the work up front to get this in place and don’t fiddle with it too much. Every quarter or year, you’ll find opportunities to improve your reporting. Your company’s goals will shift over time and these periods will be a good time to recalibrate your metrics.
Metrics provide clarity for everyone: stakeholders, executives, feature teams. To get the full value of this, you need to agree on a foundation set of KPIs and make them widely accessible. My first startup had a daily report, emailed to the entire company that stated all key business KPIs against goals. It looked something like this.
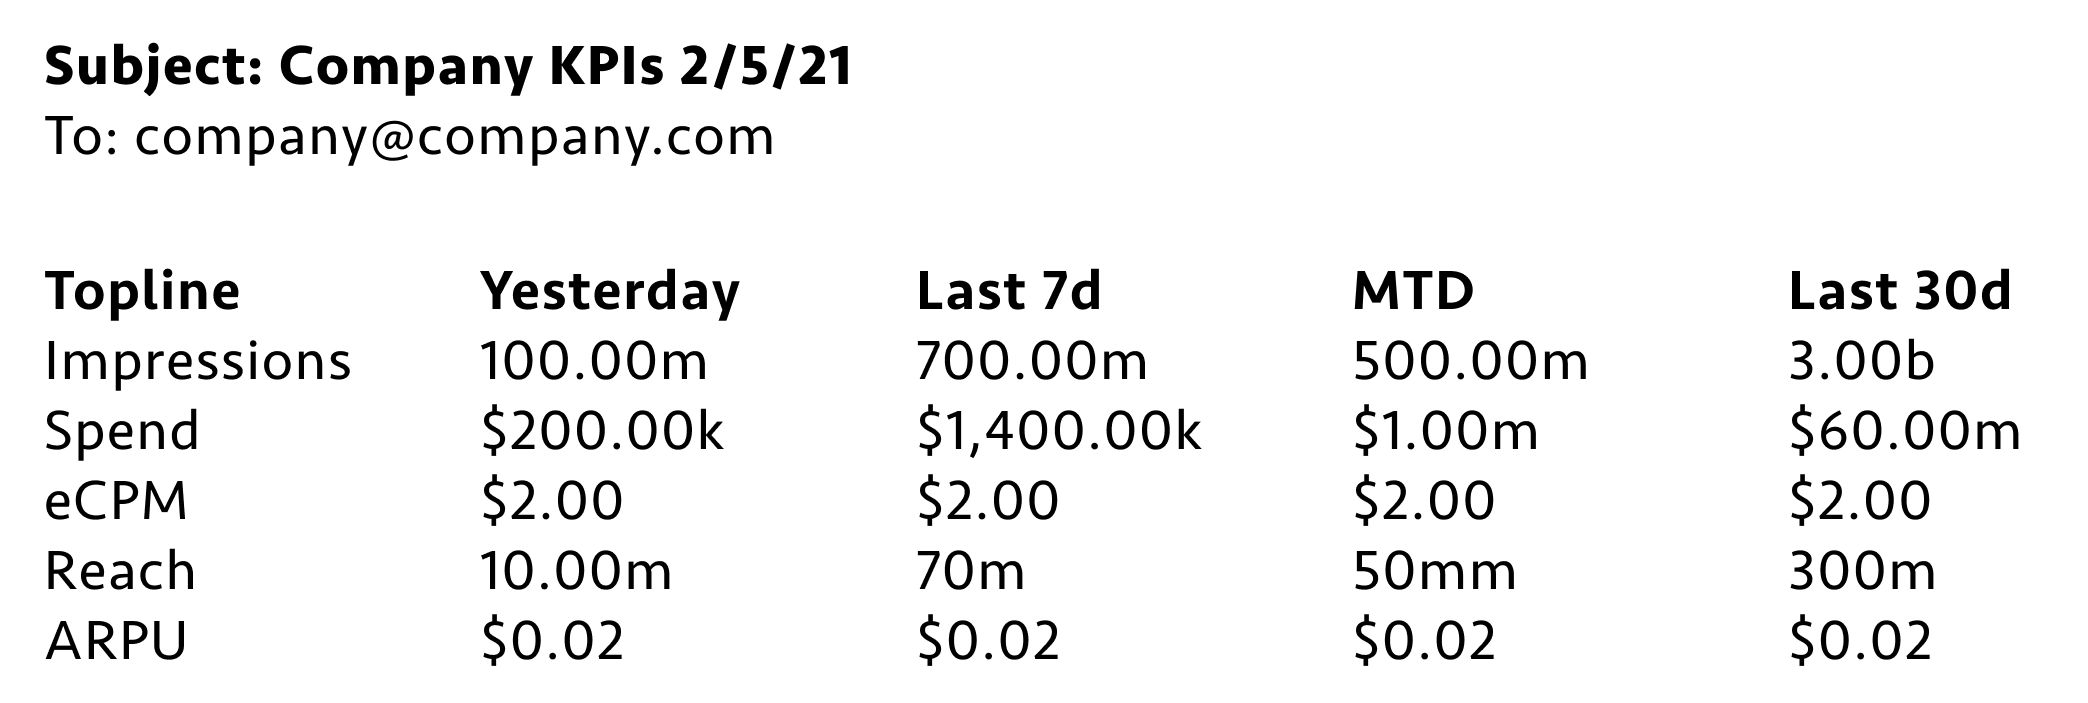
Note: these figures are totally made up, but I remember the structure from sheer repetition. We also had green-red delta figures showing changes in each. These fit an ad-based business so the individual metrics don’t matter - the point is, every company has ~5 key metrics that describe the entire business as a whole and should be known to everyone. For another example, see an old version of Uber’s KPI dashboard.
This made a major impression (no pun intended) on me and I’m constantly surprised that more companies don’t make this a standard practice. When a product person is deep in the data, they forget that other people don’t have their context. Making metrics widely available on push basis, ensures everyone is on the same page. In this example, I can assure you that every single employee knew exactly how the business was performing at any given time and what they needed to do in their role to affect them.
Never make people run their own queries (“the data’s there for anyone who wants it!”) or do their own reporting. Spoon feed it to them.
Not all companies or executives are this transparent with their data, and in some businesses it’s not possible to push sensitive data to hundreds of employees. Directionally, it’s what you should push for. If you can’t implement something like this on a broader level, make sure you and your team have regular, automated access to top line KPIs. They will inform everything you do and help you set your own, downstream KPIs.
Open metrics are only as useful as they are understandable. Use self-explanatory naming conventions and don’t get too clever with business logic. If you have 4 different definitions of a signup or “activation” you are only adding to the confusion. Clarity will help you (when you check something 3 months from now you won’t need to dig into code to remember the logic behind a figure) and everyone else consuming them. I can’t tell you how many meetings I’ve sat in where a PM reported a metric in a 20+ directors meeting and then spent the rest of the meeting clarifying and debating whether that metric was defined the right way to begin with. Avoid this at all costs.
Metrics make everything simple. They boil down all kinds of activities, work across the business, and product launches into business facts. But that doesn’t mean they are as simple as they look.
A lot of PMs struggle to move towards a so-called North Star Metric. This is another item that scores well on take home exercises, but can fall flat in real life. Don’t get me wrong - north star metrics are very powerful, but they aren’t as easy to grasp or act on as it might appear.
Think about Airbnb’s nights booked metric. It’s a perfect encapsulation of their entire business into one tidy package. But how do you and your feature team increase nights booked? Well, you start by unpacking the sub-metrics involved in nights booked. To oversimplify, it’s a function of inventory, demand, and sell-through. You can break this down further:
• Inventory = new hosts acquired, hosts retained, listings added, etc.
• Demand = new guests acquired, guests retained, etc.
• Sell-through = discoverability of relevant stays, availability, pricing optimization, etc.
This waterfall goes on and on. The value of a north star metric is that you can spin up a bunch of independent teams to focus on particular sub-metrics and prioritize their work against them. But you can’t just say “ok, north star metric - any ideas?”. That is paralyzing and hides the complexity of how your business actually ticks.
Similarly, you need to understand the interconnectedness of these metrics. If we increase hosts in one region, does it increase sell-through or decrease it? It depends.
Another example is a marketing funnel. Growth PMs are rightly funnel obsessed and are always looking for ways to optimize each part. But let’s say you make it easier to sign up (ex: add Facebook login) or to pay for your service (ex: add Apple Pay). You may increase new users or checkout rates, but do these customers behave the same way as all the other customers? The usual answer is no. If you increase conversion rates on one part of the funnel, the drop tends to leak elsewhere or into long-term metrics (e.g. LTV, retention). It doesn’t mean these efforts aren’t useful, it just emphasizes that it’s often impossible to change one thing for the better with no other effects.
Once you and your team are used to consuming regular push reports and shipping against them, you’ll get an intuitive grasp for some of these relationships. You’ll realize that you may need to affect a low level metric (or several low level metrics) to boost a higher level one, or that there’s an interplay between work you and other feature teams are doing that needs to be collaborated on, or at least resolved.
Avoid things that can be measured just because they can be measured. Another personal example would be weight. If you are looking to improve your fitness, you should think about what you really want to change. Is it your energy levels? The way you look? Being healthy for long term longevity? There are an endless number of goals people might want in this category, but often they will just measure their weight because… they can. Some people may need to actually gain weight to meet their goal. So make sure that what you’re tracking is useful and not just available. A common parallel of weight in product work is often efficiency. Sure you can make an internal team (ad ops, support) more efficient - and sometimes you should - but is that the most important thing you can be working on? Maybe, maybe not.
Once it’s clear what KPIs your feature team needs to focus on, they will inform the projects you take on. It’s critical that you start with a goal in mind, and then decide the projects. If you have a bunch of random ideas in your backlog that would make great features, you need to figure out which will actually get you to your objectives. The best feature that has no goal in mind may delight some users, but will bring you no closer to that goal. The best way to get your team thinking of great ideas, is to ask the question “what are all the ways could we improve x metric?”. Now you have a constraint on your brainstorming and can put the free-flow of ideas to productive use. In some cases, the best solution may even not be a “product” one you need to build.
Similarly, once you start writing a spec for that project, start with the goal. This should be the first line of every single spec you write. I’ve seen some organizations that start with this and nothing else before the feature team starts developing ideas. That way, every requirement or design that gets added can be judged against “is this really going to get us to that goal?”.
As the feature starts to form, you should also define exactly how you’ll measure it and set a goal against it. This approach will keep you honest throughout the process and avoid uncomfortable conversations after a feature flops. You will be surprised how many high growth companies ship things with 3-4 simultaneous goals and move targets after the fact. Were they successful? No one knows, but you can keep data scientists busy trying for weeks trying to find the answer.
Just like with the regular consumption of topline metrics, you’ll get a feel for what metrics can be moved and by how much. In absence of that knowledge, start with something. Do you think 10% of users will pay for this feature? 70%? If the number is too low, it’s probably time to move onto another idea - that’s fine! Putting a line in the sand forces you to think critically about how to reach it and doesn’t let you hide if it doesn’t work. When a feature ships, you should already have a report ready to go.
There’s nothing wrong with failing to meet a goal - it’s part of an iterative process. If you attained 100% of your goals all the time, you aren’t taking enough risks. It’s only when teams continually fail to hit goals that there’s a problem.
While product people are supposed to be “metrics obsessed” (another one from a real job description), you can’t focus on your metrics 100% of the time. Being hellbent on a single number will give you tunnel vision, and cause you to miss opportunities that don’t perfectly fit into your chase.
You can also spend way too much time thinking about tweaks and optimizations to squeeze features toward that metric. This is another form of myopia that inhibits new directions and ideas that could have an even greater impact than what you’ve already got.
Remember that not everything can be captured by a metric. There is lots of soft stuff like user experience that can’t be measured so easily. All products are used by human beings and there are some fuzzy things that aren’t captured in metrics - think “user love amount” - that can drive long term growth for your product. Leading indicators like engagement can quantify this somewhat, but you should also rely on anecdotal feedback and direct conversations with users to get a sense of whether something is working or not. Combine qualitative and quantitative
Like all tools and competencies, metrics have specific purposes. Use them wisely, and remember they are just one abstraction of the real work you’re doing. They are never enough on their own.