This is the final part of the Zero-to-One GTM series. Part 1 covered why deployment drives growth. Part 2 covered what buyers actually evaluate. This post asks: if the economics are fundamentally different, how do you navigate the PMF journey without reading the wrong metrics?
3 years, 1000 days of hell.
There’s a number that keeps coming up in conversations with manufacturing tech founders: about 1,000 days from first deployment to something that feels like product-market fit. Most founders don’t know this going in, and the ones who survive only figure it out by learning to measure differently.
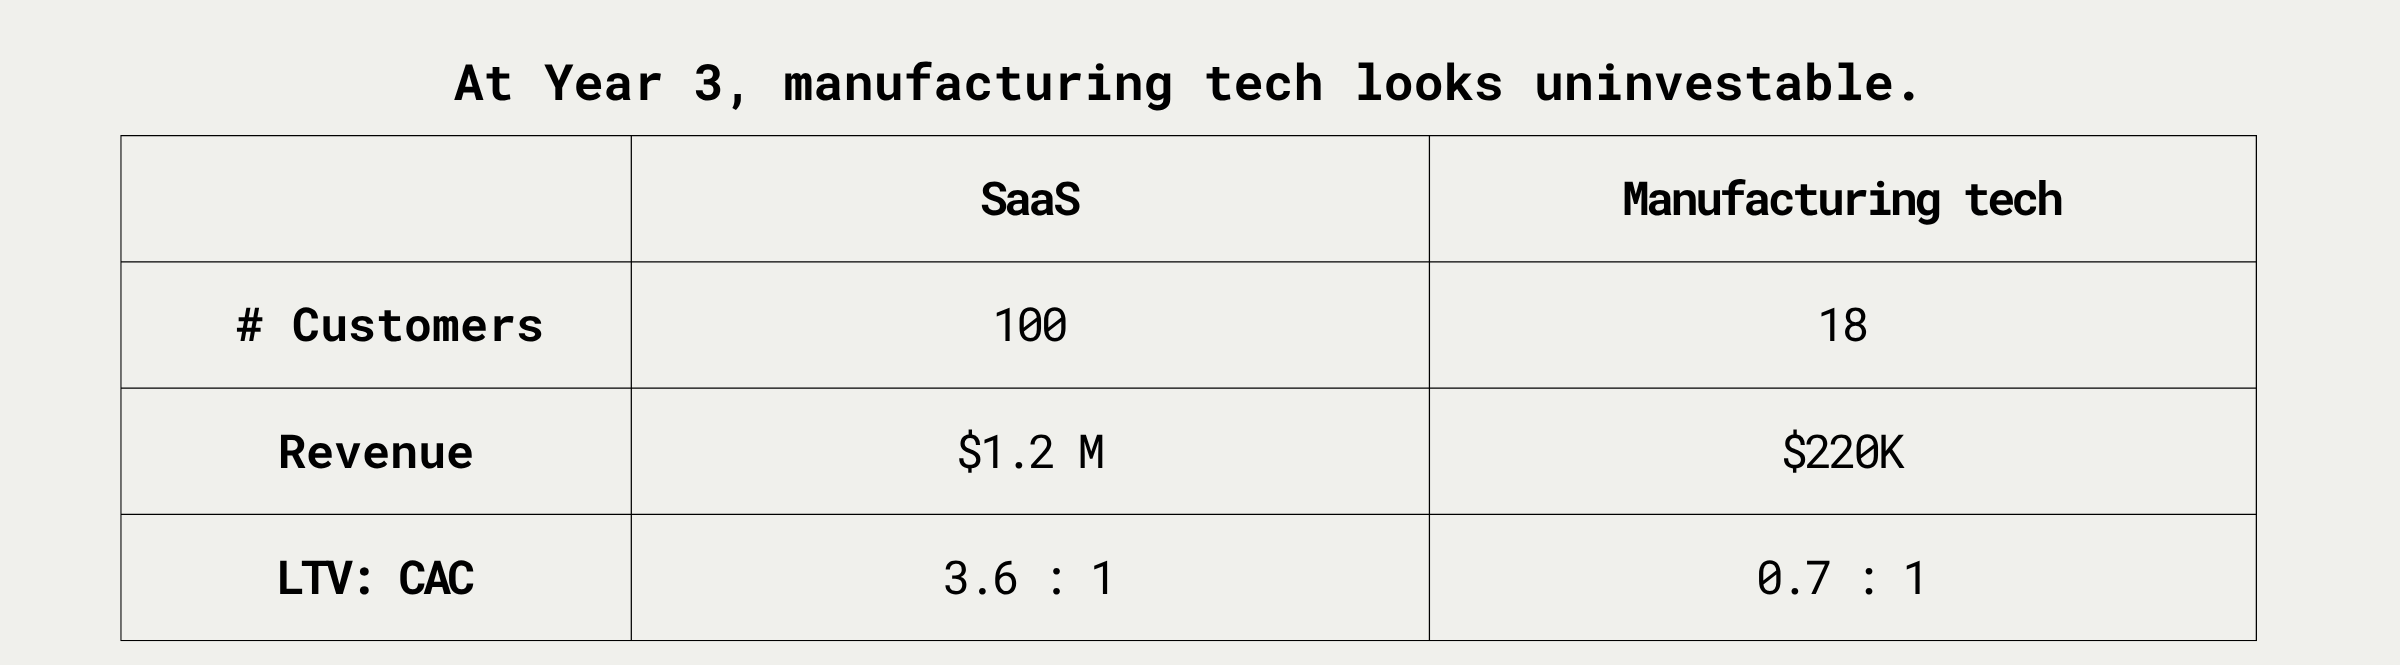
The standard SaaS benchmark is 3:1 LTV:CAC within 18 months. The 1,000-day pattern from manufacturing tech founders suggests a different race entirely. I mapped the customer economics of both models across a 10-year horizon.
The 100th customer costs almost nothing to acquire because the product doesn’t change between deployments. One blog post generates leads for years. The curve rises fast.
Manufacturing tech is still underwater.
Teams are spending weeks on-site figuring out problems that didn't exist on the bench: integration, setup, on-site engineering, debugging. You don’t make money until deployment works. And the target customer is still unclear because you're testing technology-solution fit across different environments to see which one sticks.
Manufacturing tech’s LTV:CAC sits below 1:1 in the first three years, sometimes as low as 0.3:1. You’re losing $0.70 per $1.00 spent. Targeting is imprecise, POCs are often free, and the full value of deployments isn’t being captured in pricing yet.
By year 4, manufacturing tech's LTV:CAC reaches 3:1. Two forces hit at once:
Deployment cost drops because repeatability kicks in. The first 5-10 deployments were expensive because every site was different. By deployment 15 or 20, the team recognizes patterns. Deployment cost becomes predictable, and predictable cost is the foundation of real unit economics.
Customer value reveals itself. One founder described early deployments priced at $2,000. After proving value in production, customers paid $60,000 for the same capability. Early customers who saw results started expanding: one line became five, one site became three.
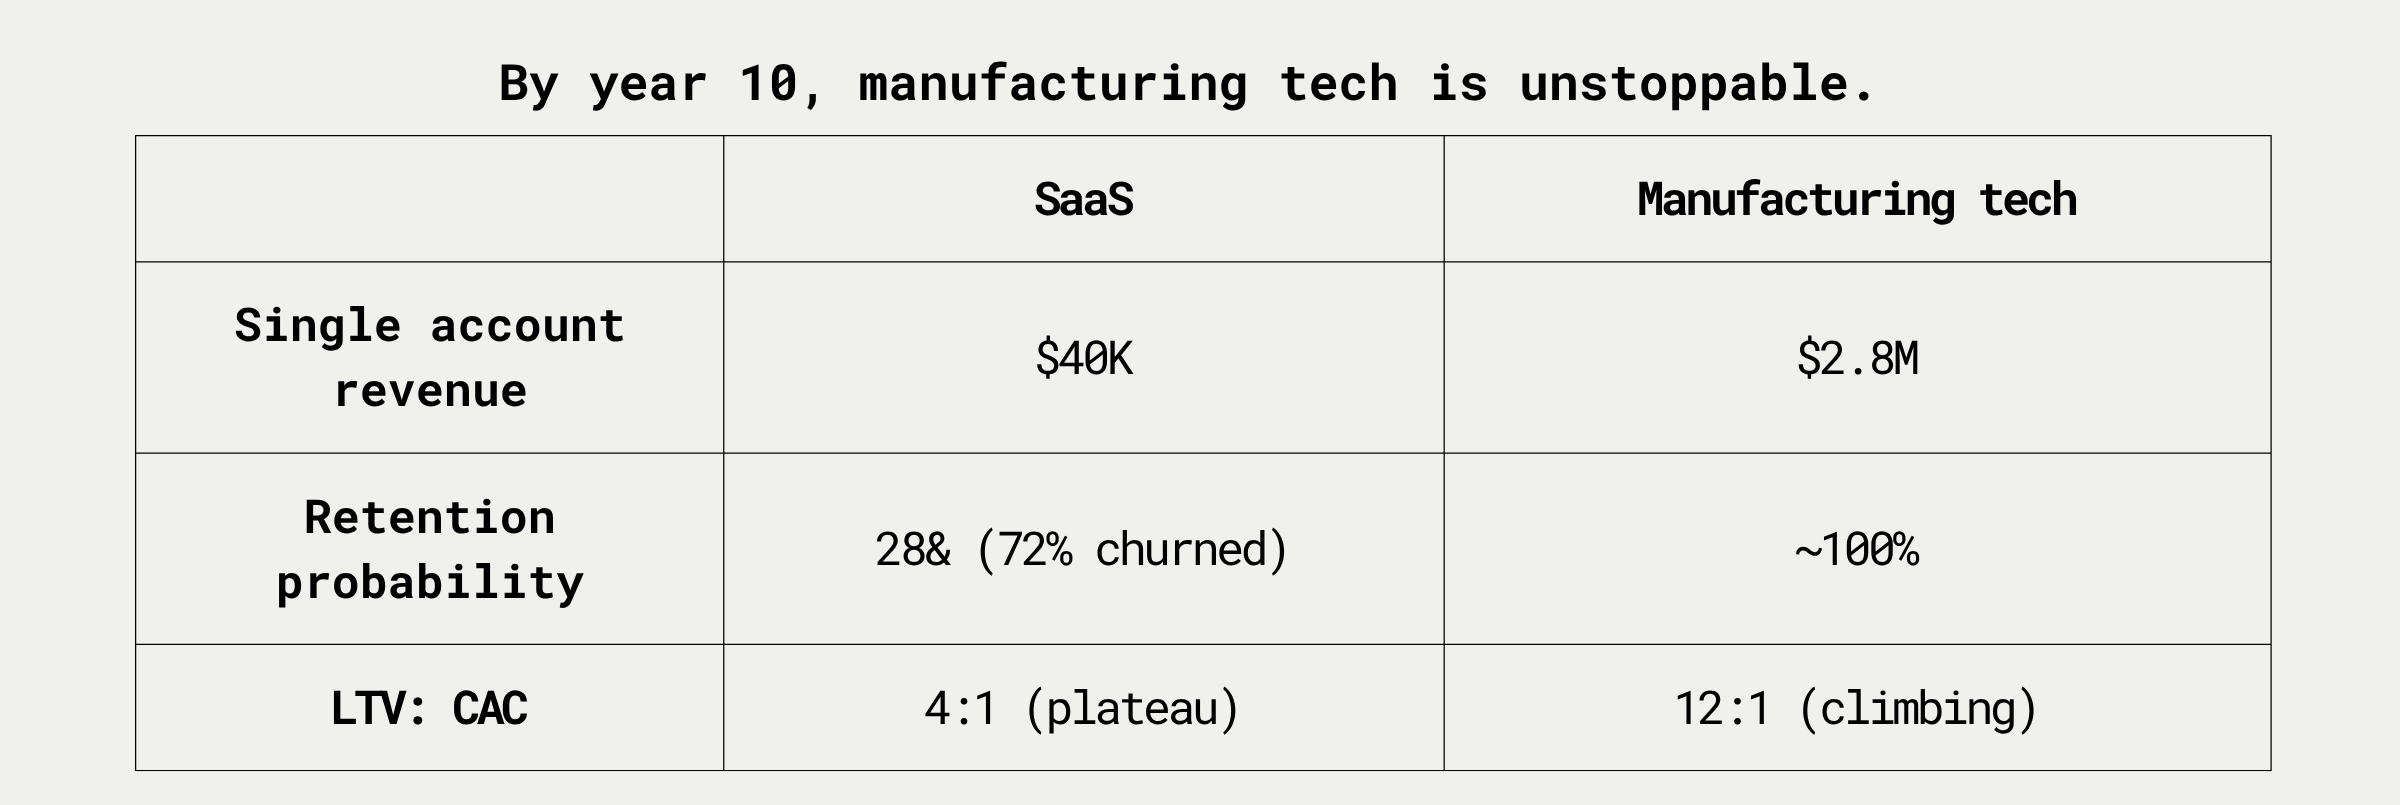
Repeatable deployment reduces cost per new customer. Account expansion grows revenue from existing customers. SaaS can't match this trajectory because expansion within a SaaS account is capped by headcount. Expansion within a factory is capped by production capacity, a much higher ceiling.
By year 10, manufacturing tech reaches 12:1. SaaS flattens at 4:1.
The 1,000 days weren’t a delay. They were the period where the deployment economics were being built.
“PMF in manufacturing tech can be a mirage. If you’re just chasing revenue and POCs, which are cheap for customers, you end up in a dicey situation.” — Vatsal
Applying 18-month SaaS benchmarks to a 1,000-day journey creates false signals. You look slow when you're on pace. You look fine when you're stuck.
Three principles for navigating the 1,000 days:
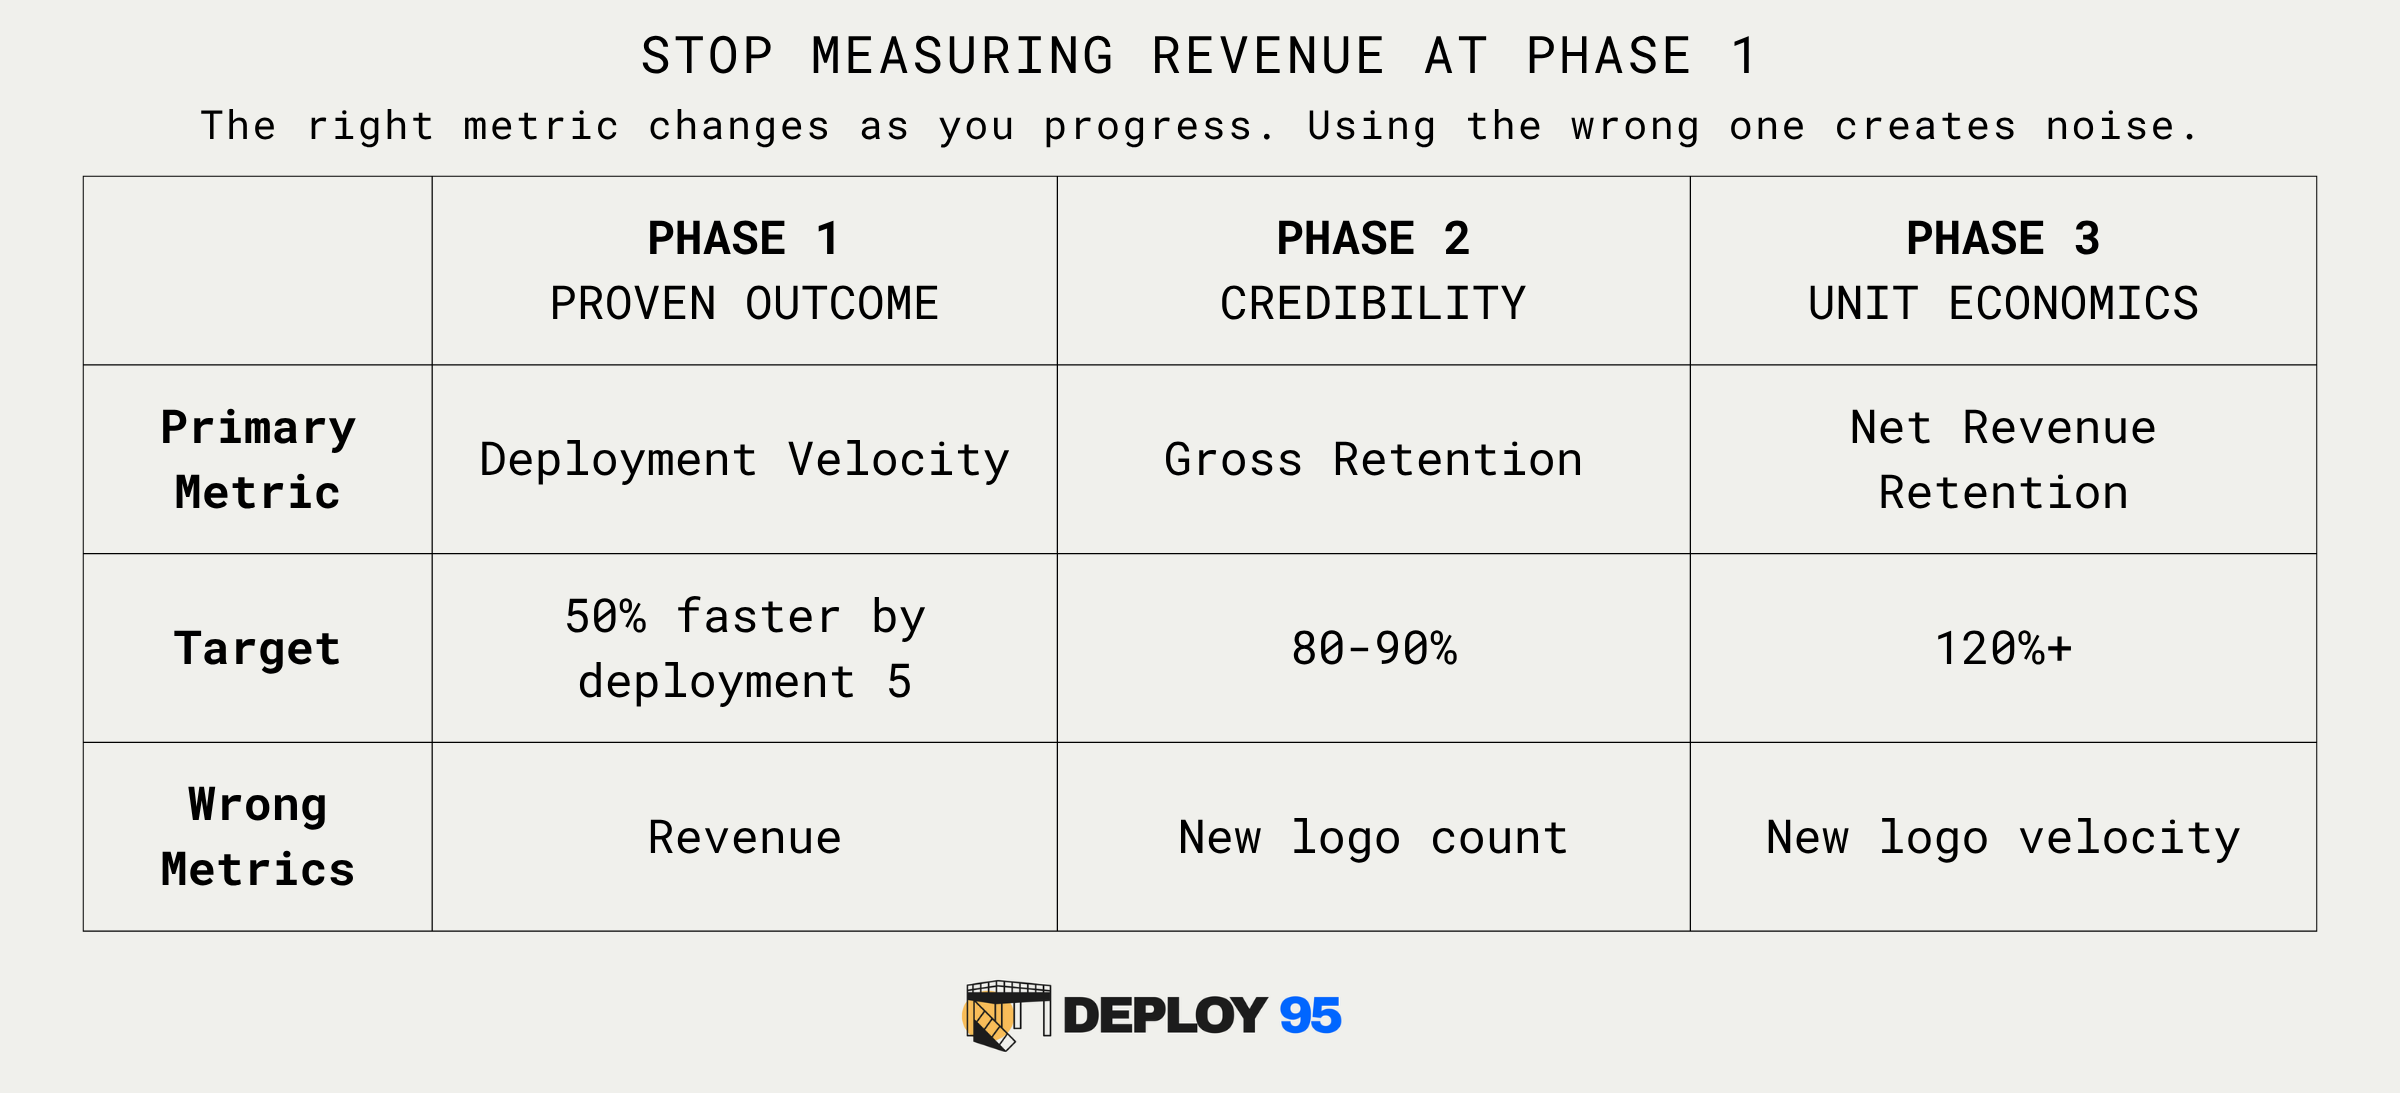
The PMF journey moves through three phases: proven outcomes → credibility → unit economics.
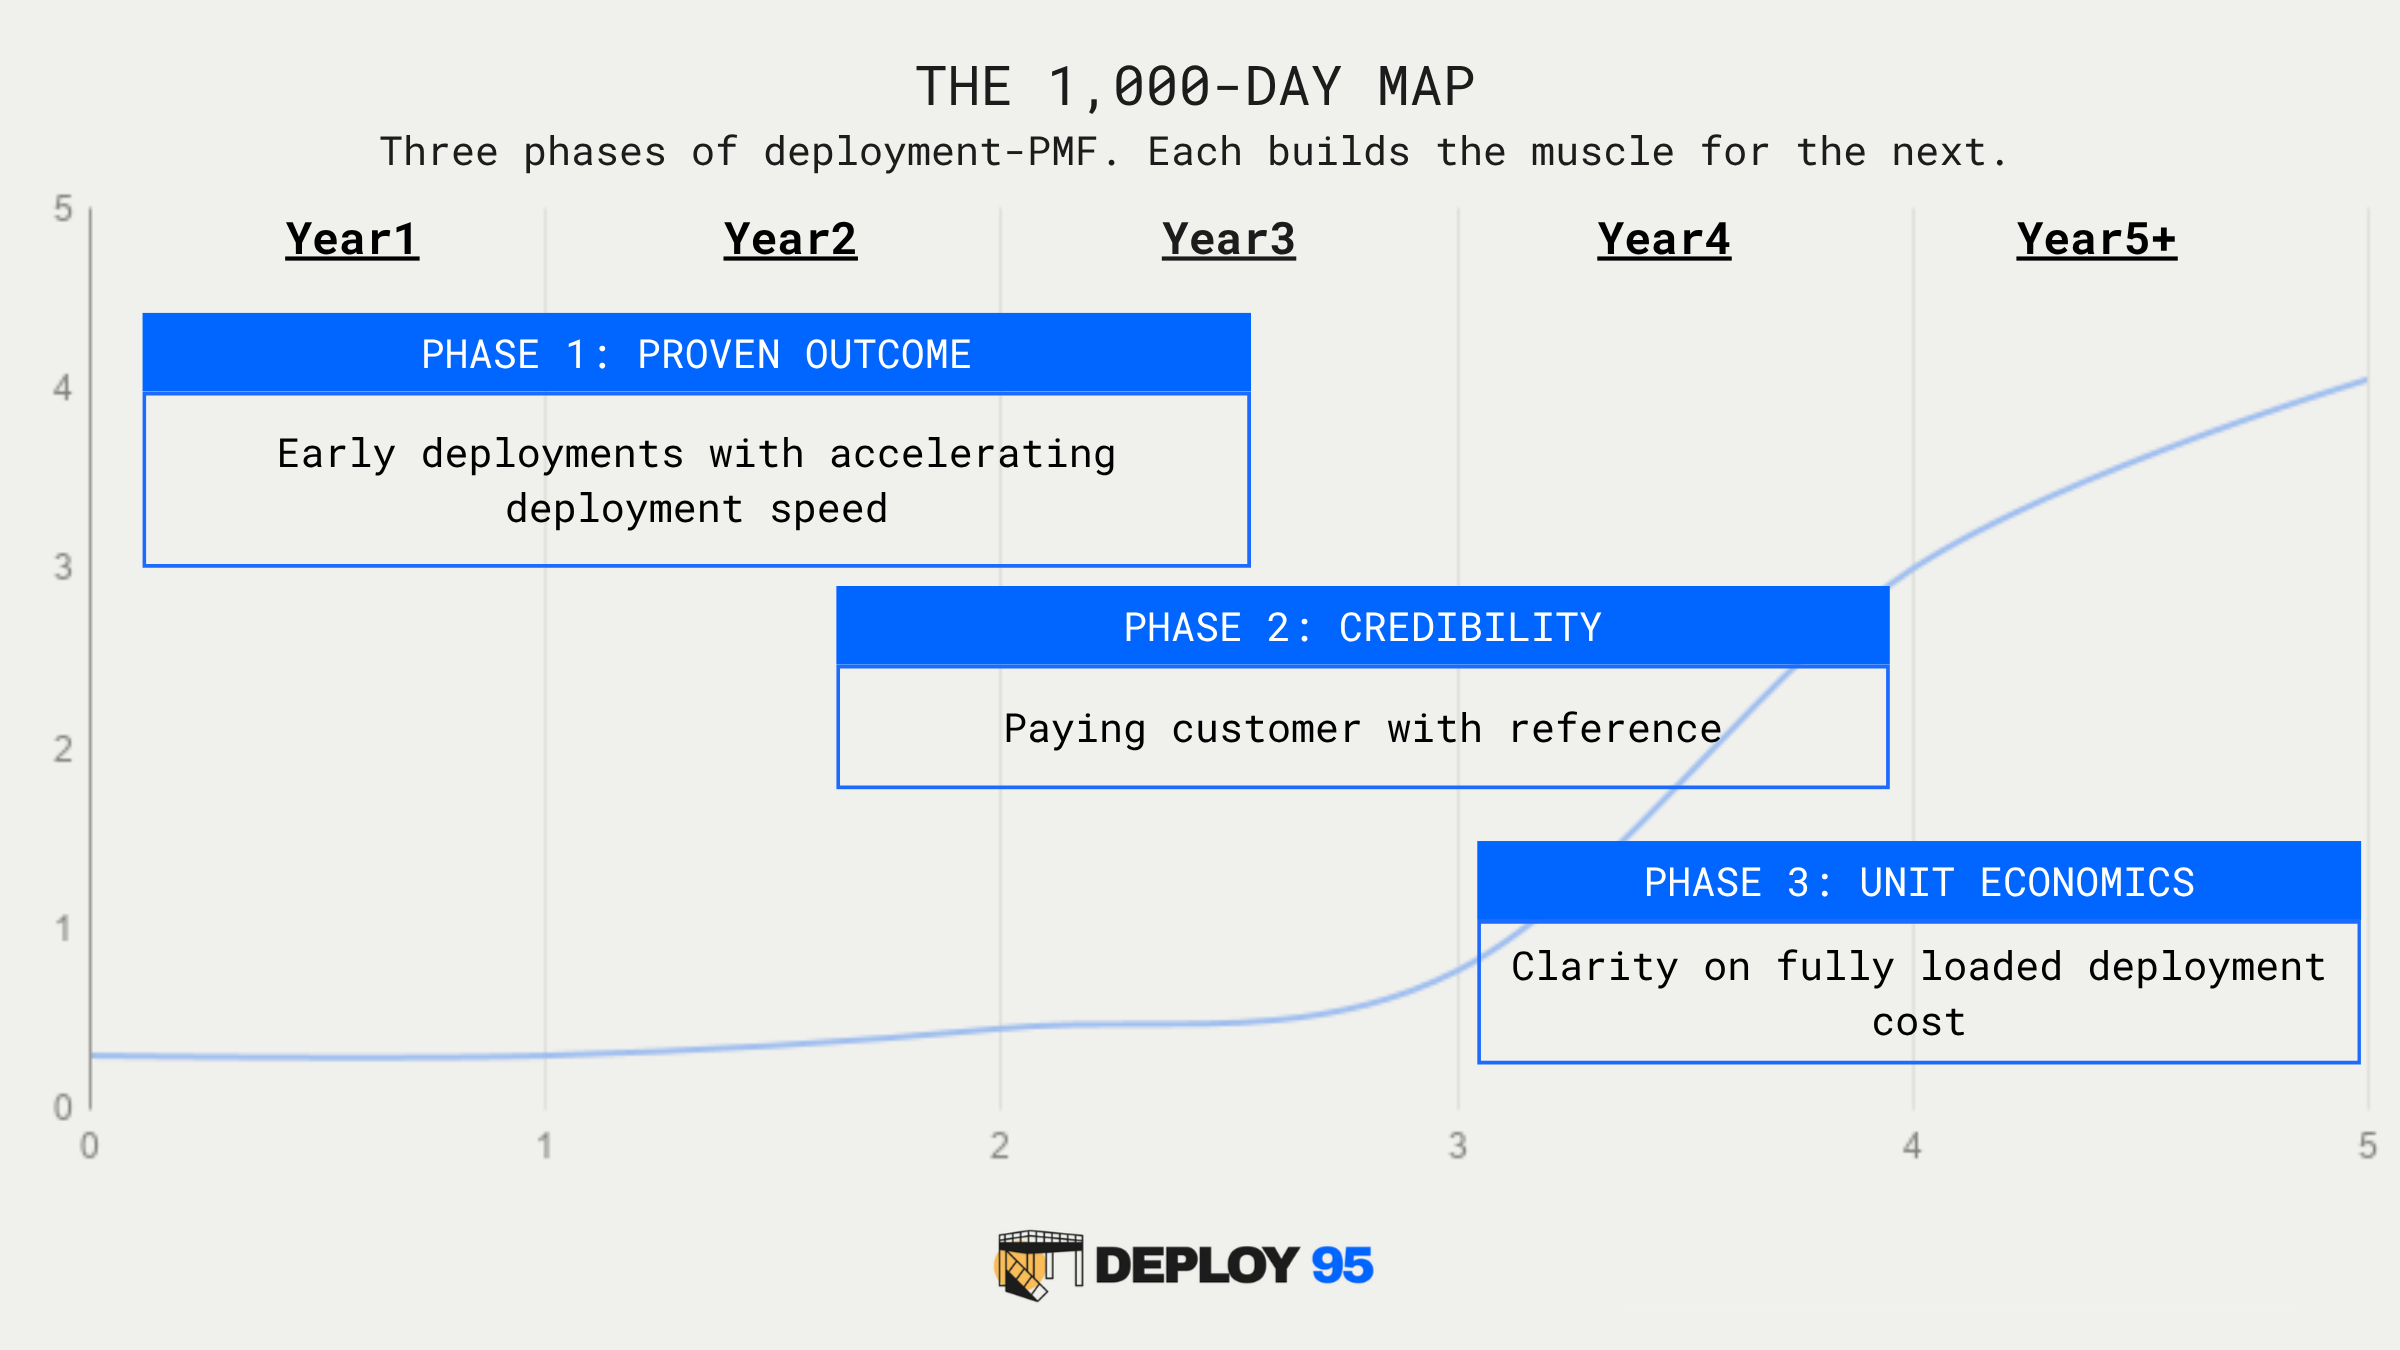
Credibility starts with 3-4 repeatable deployments. Here, the focus shifts to deployment repeatability. Your initial deployment becomes starting credibility, a reference that gets buyers in the same segment to take your calls without a warm intro.
Unit economics get easier as patterns emerge. On one hand, you gain clarity on true product and deployment costs for each application you’ve repeated. On the other, you start seeing patterns in how customers calculate ROI, and you can offer frameworks with examples from the field.
In the first few deployments, you don’t know what you don’t know. Integration complexity you didn’t anticipate, maintenance requirements you underestimated, systems you’d never heard of.
The goal is to align early deployments into a repeatable pattern by testing who responds, proving what works, and learning what breaks. The primary customers, the key application, and product-market fit will follow.
One way to stay intentional is to map the use cases in your sector before chasing them. Pick dimensions that matter to your technology, identify potential use cases, and assess how likely each is to reach production.
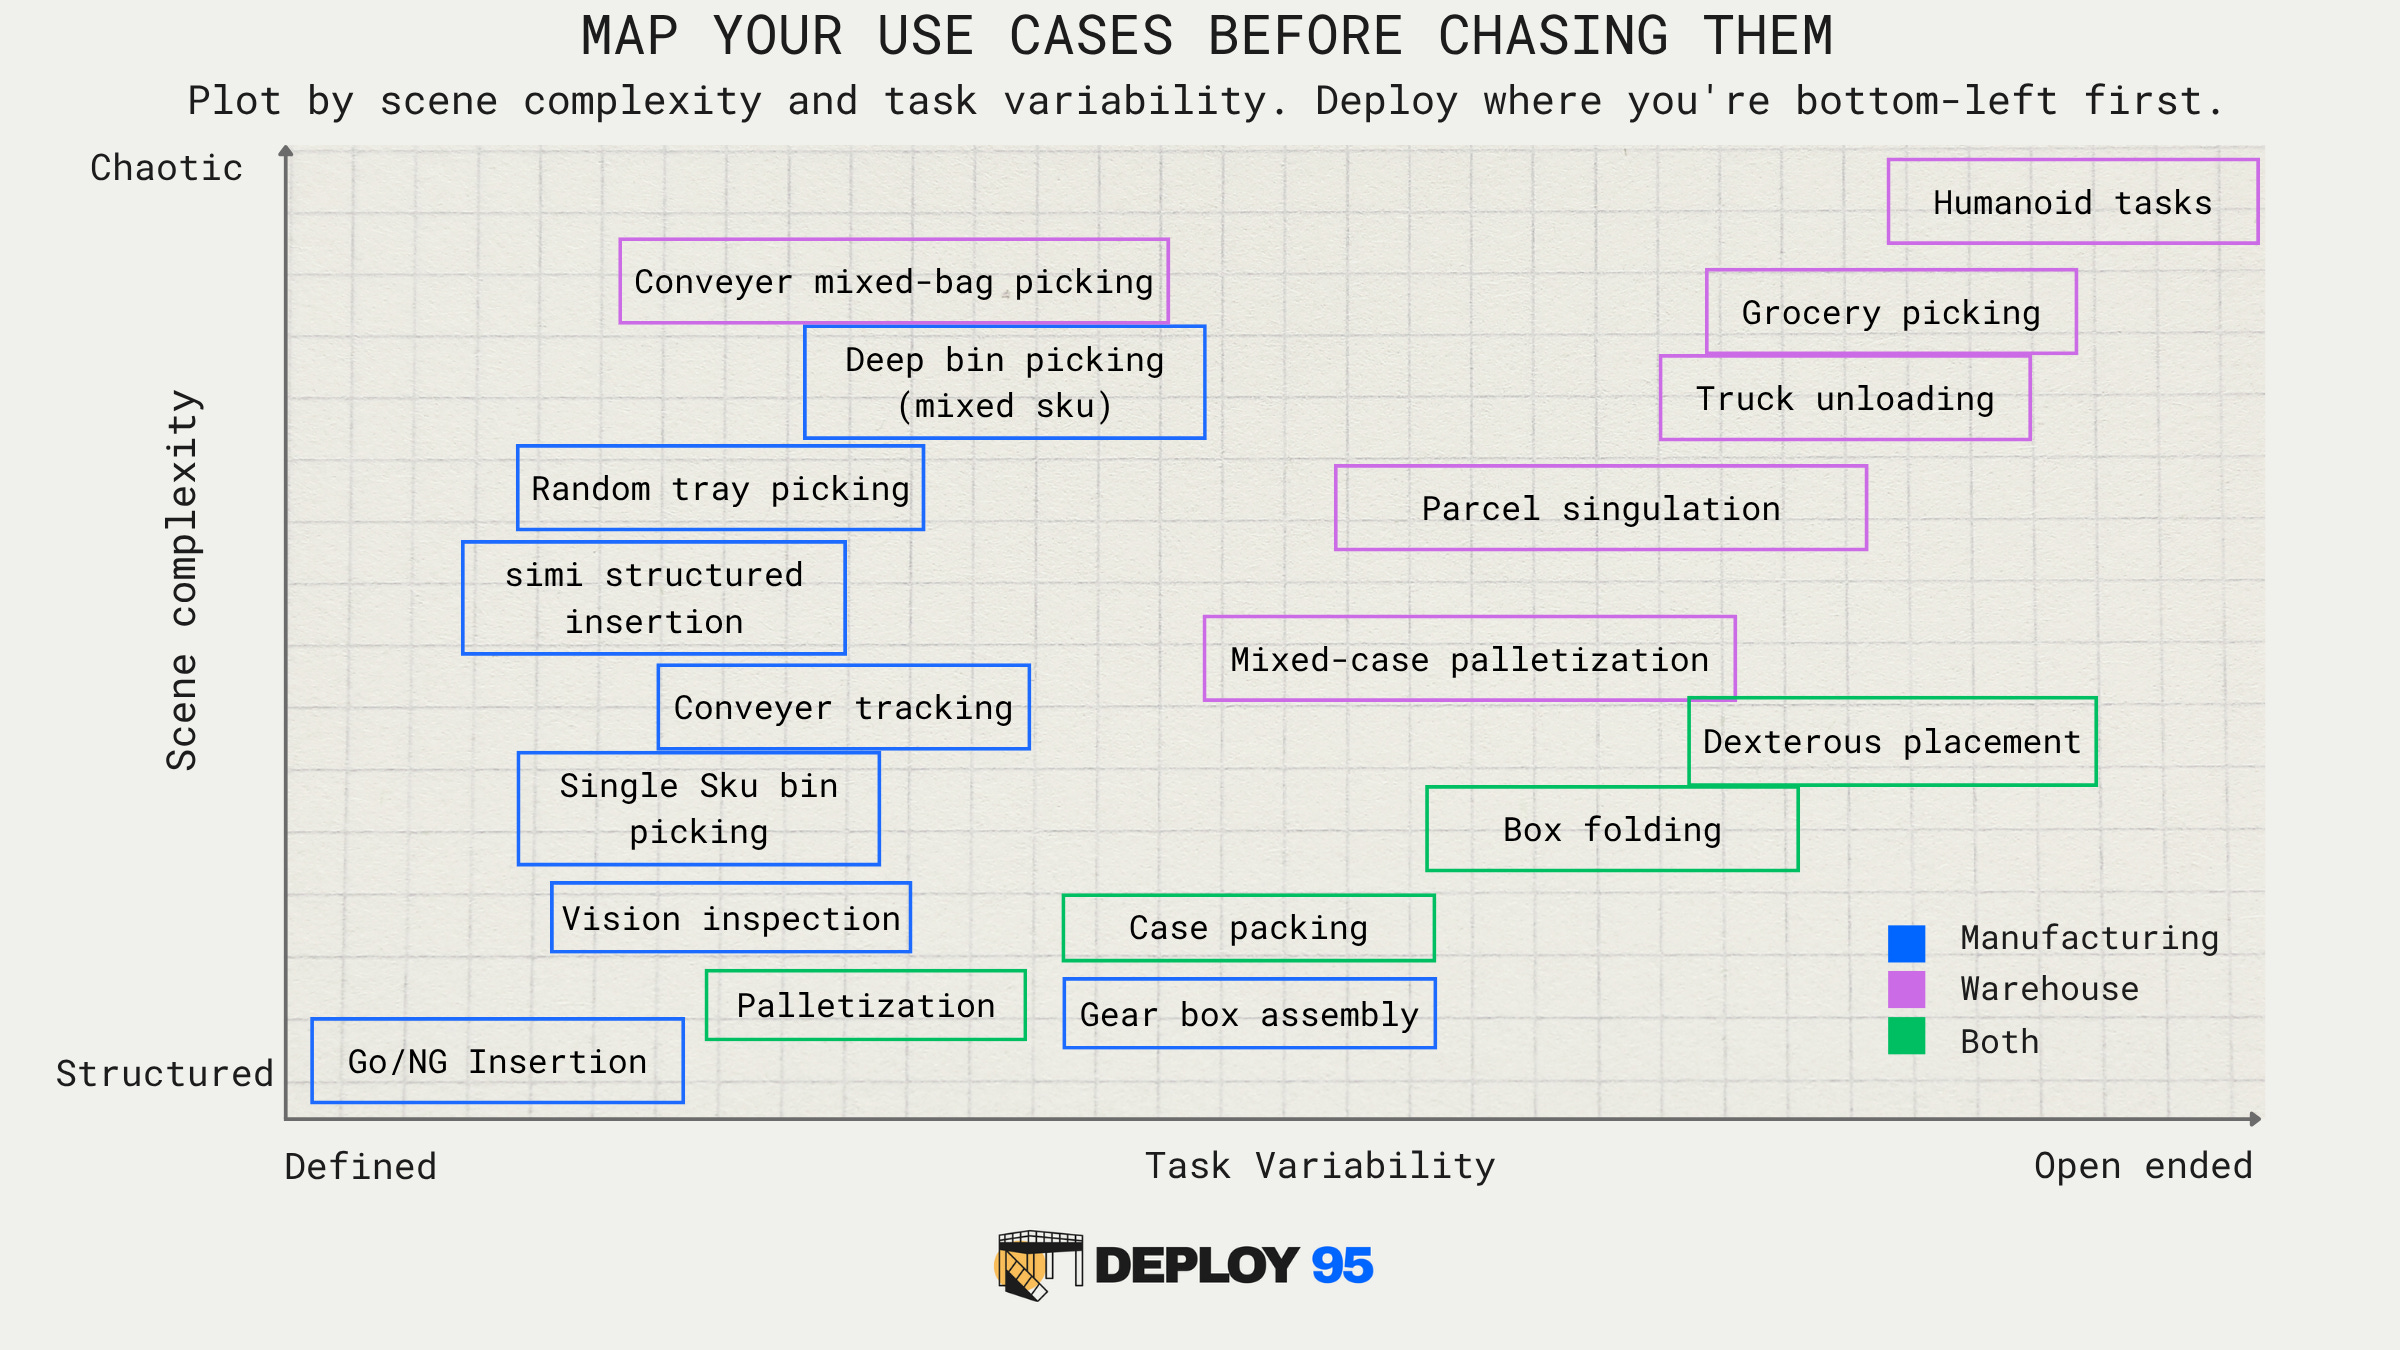
The example above uses scene complexity and task variability as axes, relevant for robotics, perception, or pick-and-place. After 6-12 months, review which POCs converted and where they concentrate. The pattern tells you where your technology-problem fit is strongest.
The metric that matters changes as you progress. Using the wrong one at the wrong stage creates noise.
Phase 1 (0-5 deployments): Deployment velocity. Is deployment 5 faster than deployment 1? If not, you haven’t found the repeatable pattern yet.
Phase 2 (5-20 deployments): Gross retention. Are customers staying? 80-95% retention in early years reflects the messy reality of first deployments. The question is whether the ones who stay are referenceable.
Phase 3 (20+ deployments): Net revenue retention. NRR measures how much existing customers spend this year compared to last, after accounting for churn. Above 100% means your installed base grows on its own.
Manufacturing tech companies hit 140%+ NRR once past the deployment hump. First deployment proves value on one line. Then adjacent lines. Then other facilities. The slow start funds the finish.
But NRR is a Phase 3 metric. Measuring it in Year 1 is meaningless. You don’t have enough deployed customers to generate expansion revenue.
Manufacturing tech takes longer to prove. It also produces something SaaS rarely does: a customer who stays forever, buys more every year, and can't be displaced by a competitor's demo.
The 1,000 is critical to building the flywheel. You can spend those days guessing, or you can start with the framework.
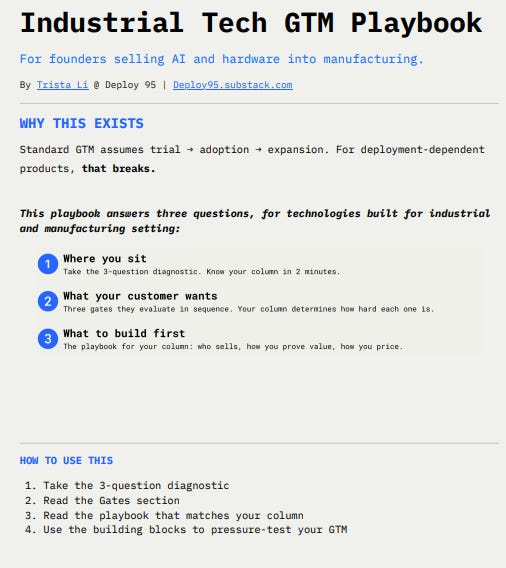
Find your GTM motion in 2 minutes. Three diagnostic questions. Your answer determines which playbook to follow.
Know what proof your buyer needs. The three gates mapped by product type, so you stop building the wrong evidence.
Build the right team at the right stage. Who to hire, how to structure POCs, and how to price, from pre-seed through Series A.
Measure what predicts growth, not what predicts meetings. Stage-by-stage metrics. What to track, what to ignore, and when the SaaS dashboard starts to apply.
Only 5% of industrial AI pilots convert to full deployment. This newsletter is about that gap: what happens between your model and the factory floor.
Hi! I’m Trista, grew up in manufacturing, built GTM at UnitX, now helping technical founders close the gap between traction and deployment.
New here? Start with the POC Valley Series.
Building in this space? Let’s connect on LinkedIn.
LTV:CAC (Lifetime Value to Customer Acquisition Cost): How much a customer is worth over their lifetime divided by how much it cost to acquire them. The SaaS benchmark is 3:1. In manufacturing tech, it starts below 1:1 and can reach 12:1+ over 10 years.
Net Revenue Retention (NRR): How much more your existing customers spend this year compared to last year, after accounting for any who leave. Above 100% means your installed base grows on its own. SaaS median: 104-106%. Manufacturing tech post-deployment: 140%+.
CAC Payback: How many months until a customer has generated enough revenue to cover the cost of acquiring them. SaaS median: 18 months. Manufacturing tech: 3-5 years, including deployment cost.
Deployment-PMF: Product-market fit measured through deployment repeatability, not pipeline conversion. Three phases: proven outcome (did it work?), credibility (is it faster?), unit economics (can others sell it?).