
Hello!
Once a week, we write this email to share the links we thought were worth sharing in the Data Science, ML, AI, Data Visualization, and ML/Data Engineering worlds.
Now…let’s dive into this week's interesting links.
We are really happy with the results. It removed many of our “legacy decisions” (mistakes), makes the streaming engine our default and promotes SQL to a first class citizen within Polars. We initially said it would be a small (”boring”) release, but we managed to sneak in a lot more than anticipated. It comes with our initial out-of-core (spill to disk) support, a new Map data type and a lot of performance improvements. In fact, we think Polars is now one of the fastest analytical SQL engines on a single node…
Things that Apparently Cause Cancer
It would shock you to know that Costco, according to a new Harvard School of Public Health methodology, caused 120,687 cases of cancer mortality nationally every year, simply due to living in close proximity to their warehouses. Private colleges accounted for 83,782 more….These conclusions are obviously absurd, but they come from the exact same methodology that researchers at Harvard use to “prove” that nuclear power plants cause cancer in nearby communities…Earlier this year, Adam Stein and I called out a series of Harvard studies showing that nuclear power plants were associated with higher rates of cancer incidence and cancer mortality as nonsense. Now that we’ve spent the last few months replicating the analysis and expanding it, we are able to show that no matter what landmark you use, their methodology will show an increased cancer risk and mortality. The studies simply do not prove anything about cancer incidence…How much data is there in your chart? (An interactive guide to the data-ink ratio)
Edward Tufte’s data-ink ratio can help us to understand the information density of a chart. Scroll down to see how changes to a chart can impact on the data-ink ratio, and how to optimize it for your chart…
.
.
.
Distilling Stockfish with One Billion Positions
I extracted fens and stockfish evaluations for 3.9 billion chess positions. I then trained a neural network on 1 billion of them. To my knowledge, this is the largest open state-value chess dataset released…How do you decide when to stay with a notebook and when to convert the work into scripts? Is it mainly when the project needs to be automated, reused, scheduled, or shared with others? I’d be interested to hear how people handle this in real projects…
Monte-Carlo simulations
Monte Carlo simulations (or methods) is the technique of applying randomness and the Law of large numbers to the solution of various scientific and engineering problems. One of its first documented uses was by Stanislaw Ulam and John von Neumann for nuclear weapon simulations after WWII…In this post I want to provide examples of some simple uses of Monte Carlo simulations. We’ll start with the classical example of calculating the value of Pi by throwing darts…State of AI Report 2026
After months of research and revisions right up to the last minute, I’m thrilled to bring you the 9th annual State of AI Report…For nearly a decade, this report has been a labor of love. My interest in AI began with my PhD in cancer research and computational biology in the early 2010s. Since 2013, I’ve invested in companies building and applying AI to accelerate technological progress. The report is my way of sharing what I’m learning and helping more people understand the research shaping our world…We ported the original Doom to SQL
We ported the original 1993 Doom’s game logic and renderer to SQL and ran it inside a database. The game loop runs at the original 35 FPS, while the renderer produces the complete 320x200 frame buffer at up to 60 Hz on my Laptop. Python only handles timing, reads the keyboard, and displays the bitmap it gets back. Multiplayer also works…Making np.searchsorted up to 25× Faster in NumPy 2.5
np.searchsortedis NumPy’s implementation of the binary search algorithm. This is one of the fundamental search algorithms and is used in the Python scientific ecosystem for functionality such as histogram computation and interval lookups. Any optimization benefits libraries such as SciPy and scikit-learn, as well as the broader Python scientific ecosystem…Some simple models of induced demand
I recently gave a talk at a transport modelling conference where a number of people were talking about induced demand. This is the concept that building roads causes more traffic, so “reducing congestion” is not necessarily a great reason to build more roads, because the new roads will simply encourage more people to travel by car, and you will end up with just as much congestion as before. Similarly, removing roads does not necessarily increase congestion on the remaining roads. Instead, in certain circumstances, most of the traffic just seems to vanish. This is called disappearing traffic…Usually it’s a good idea to begin understading something by building the simplest possible model of it, so I wondered what was the simplest possible model of induced demand. And is there a simple model in which building roads causes more congestion?…Trump Tourism Effects
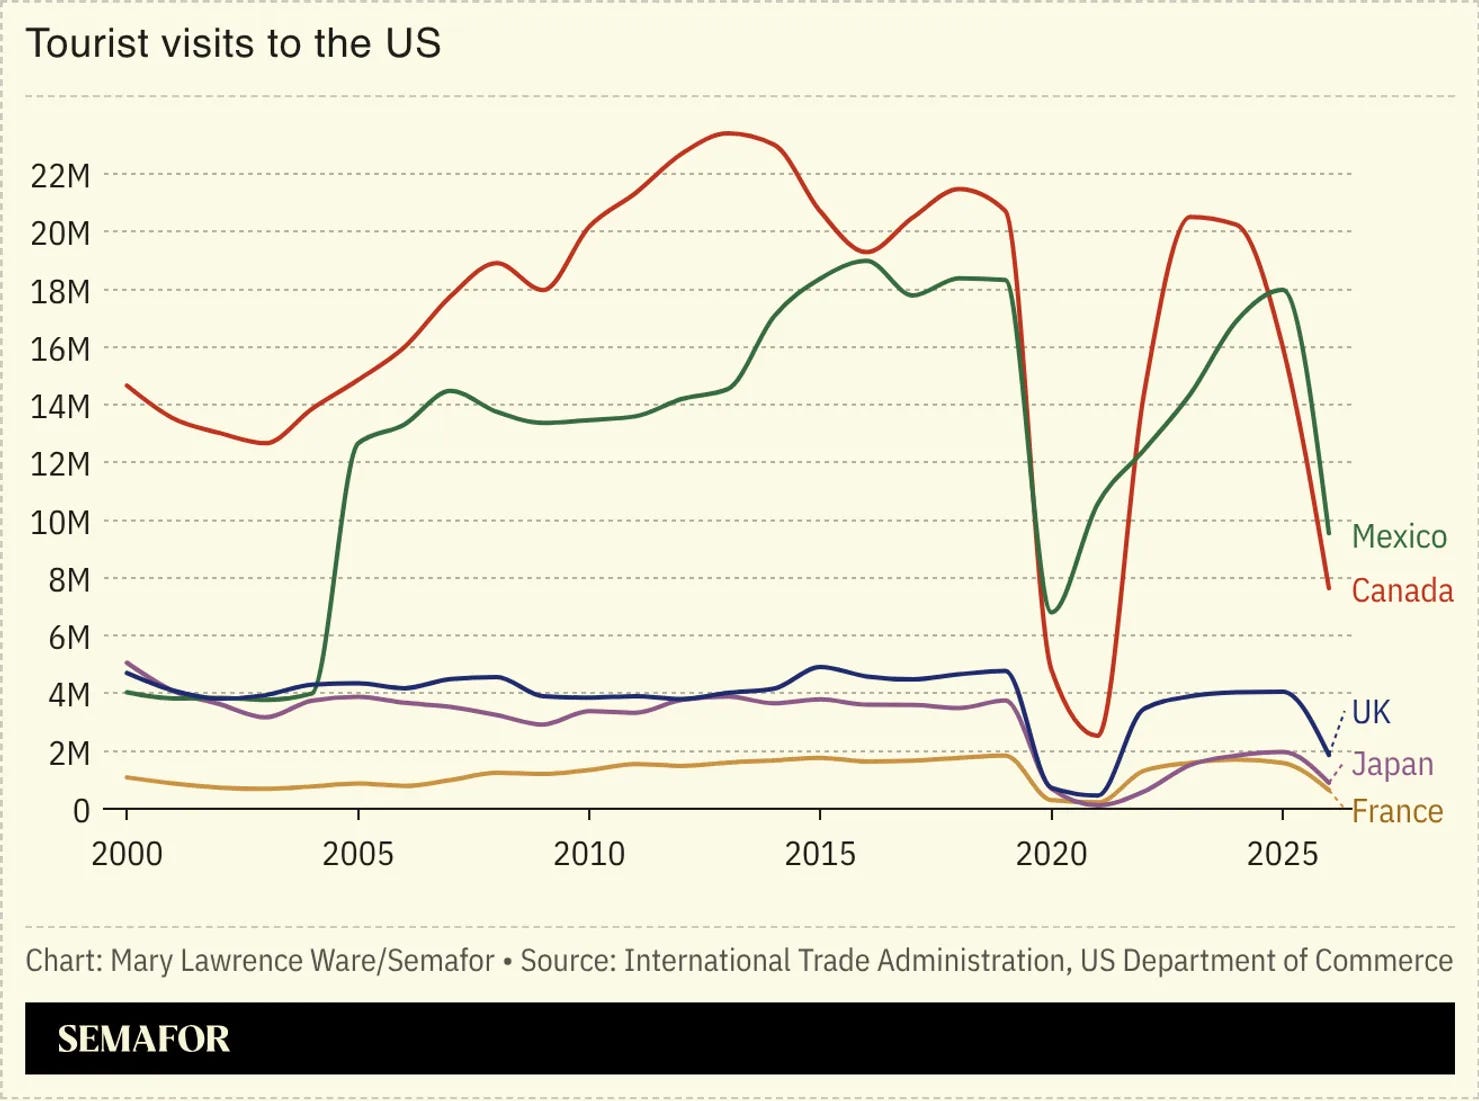
In the past day or two on social media I kept seeing this graph from a Semafor story on the declining volume of international visitors to the United States.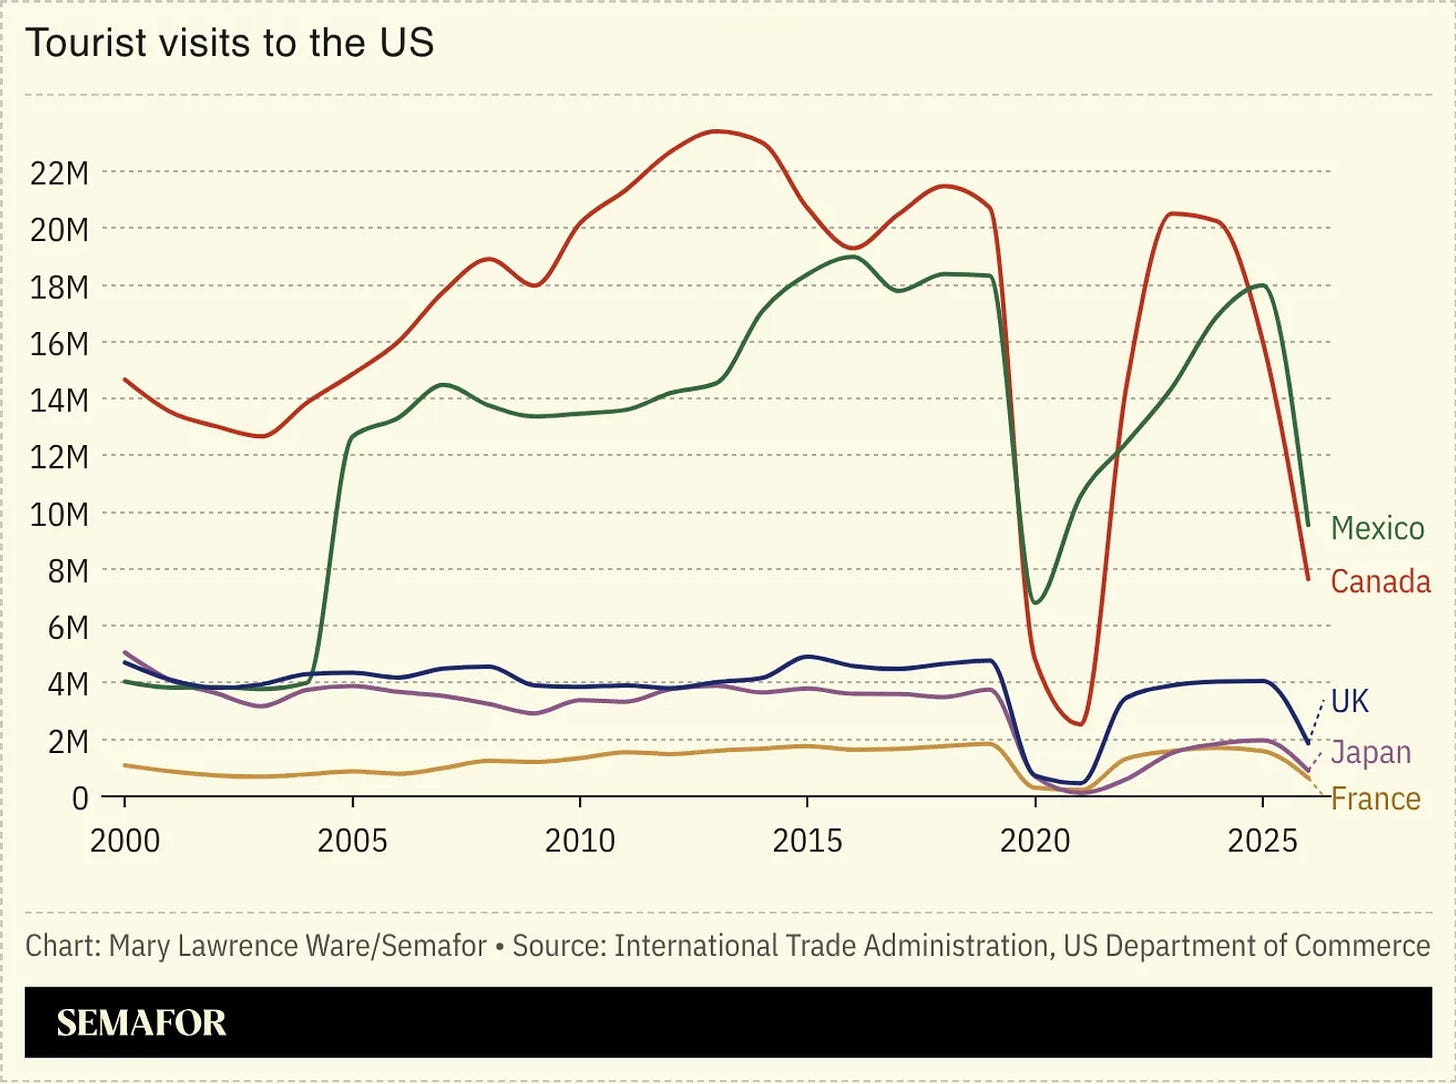
It seems to show, and was being remarked on as showing, that the second Trump administration has been responsible for a drop in visitors from abroad from some countries on a scale comparable to the effects of the Covid-19 pandemic. My first thought was “that can’t be true”. And indeed it is not true…Something’s wrong with the graph…
Since May 2025, Tara Vinodrai and Karen Chapple have led a team of researchers at the School of Cities to develop interactive mapping and visualization tools that measure and explore the potential impacts of tariffs on jobs and businesses across Canadian cities and communities at the neighbourhood and city level. Our tools illustrate the highly localized and uneven potential impacts of U.S. tariffs reflecting Canada’s underlying urban, regional and sectoral specializations…
Bayesian workflow [book review]
This book proposes a modus vivendi for Bayesian modelling in applied, realistic Bayesian analysis, where models are not magicked out of the blue. It thus emphases iterative model building, model checking, computational troubleshooting, and simulated-data experimentation, filling a gap that looks glaring in retrospect. It particularly targets users and developers of Stan, with code excerpts in R and Stan. It consists of four parts:background on Bayesian methods and computational tools;
the Bayesian workflow proper, namely building a statistical model from its components, together with its assessment tools;
the computational aspects of fitting models, diagnosing convergence and assessing calibration;
case studies.
I was eagerly waiting for the book, as I knew Andrew, Aki, and Richard had been working on it for a few years…
I’m working with a game where, for example, a player has to hit a moving ball with a racket. Every time they successfully hit the ball, the racket becomes smaller, making the next hit progressively more difficult. Once they miss, the racket resets to its original size…Each round lasts 30 minutes, and I would like to compare performance across rounds…I also have a chance/control condition where the racket doesn’t move, so some hits can happen simply by chance…I would like to get a single normalized hit-rate/performance value for each round that tells me whether the player performed well or poorly overall…What would be the best way to calculate this as one normalized value?…
Unevenly Spaced Time Series Algorithms
Unevenly Spaced Time Series (UTS) algorithms for moving averages, rolling operators, and peak detection. This repository provides a comprehensive set of tools to handle time series where observations are not recorded at regular intervals…Accuracy, Outcomes, and the “Good Miss” Paradox
This is part three of a discussion about variance in golf that I’ve been working on for months. That work is done, but I’m breaking it up into three parts so it will be a bit more easily digestible. I’ve been trying to build toward something throughout the three-part series and we’re finally here.Part one was about how hole design transforms uniform dispersion patterns into different probabilistic outputs.
Part two was about visualizing variance: how we can show strategic tradeoffs by illustrating risk-adjusted strokes-to-hole.
Part three is about what we mean by “good shots” and “bad shots,” and illustrates why the two different frameworks divide the golf community…
.
* Based on unique clicks.
** You can find last week's issue #671 here.
.
Thank you for joining us this week! :)
Stay Data Science-y!
All our best,
Hannah & Sebastian