Earth–Moon system
Earth has one natural satellite, the Moon. The Moon always turns the same face toward Earth.
Learn more ↗

Earth
Earth is the third planet from the Sun and the fifth largest. Oceans cover about 71% of its surface.
Learn more ↗Datasets
Datasets
Visible colorNASA
Blue Marble Next Generation
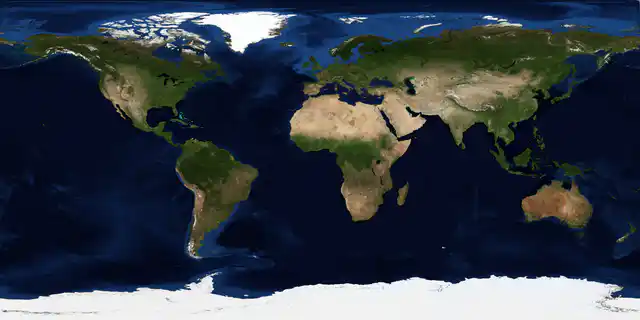
NASA Blue Marble, July 2004, midtones brightened. Deep ocean is shaded from depth, not observed water color.
Blue Marble cloud composite

Archival NASA clouds over the July 2004 mosaic; not live weather. Deep ocean is shaded from depth.
View source ↗GEBCO land and seafloor heights


GEBCO 2026 terrain: height and depth relative to mean sea level, with estimated ocean depths.
View source ↗Black Marble night lights · 2016

2016 night lights from Suomi NPP over NASA's Blue Marble land and ocean.
View source ↗Sea-surface temperature anomaly


Sea-surface temperature compared with the 2003–2014 average, on 24 September 2026. Gray covers land, ice and gaps.
View source ↗Sea-surface temperature anomaly

Sea-surface temperature compared with the 2003–2014 average, on 25 September 2026. Gray covers land, ice and gaps.
View source ↗Sea-surface temperature anomaly

Sea-surface temperature compared with the 2003–2014 average, on 26 September 2026. Gray covers land, ice and gaps.
View source ↗Sea-surface temperature anomaly

Sea-surface temperature compared with the 2003–2014 average, on 27 September 2026. Gray covers land, ice and gaps.
View source ↗Sea-surface temperature anomaly

Sea-surface temperature compared with the 2003–2014 average, on 28 September 2026. Gray covers land, ice and gaps.
View source ↗Sea-surface temperature anomaly

Sea-surface temperature compared with the 2003–2014 average, on 29 September 2026. Gray covers land, ice and gaps.
View source ↗Sea-surface temperature anomaly

Sea-surface temperature compared with the 2003–2014 average, on 30 September 2026. Gray covers land, ice and gaps.
View source ↗Sea-surface temperature anomaly

Sea-surface temperature compared with the 2003–2014 average, on 1 October 2026. Gray covers land, ice and gaps.
View source ↗Sea-surface temperature anomaly

Sea-surface temperature compared with the 2003–2014 average, on 2 October 2026. Gray covers land, ice and gaps.
View source ↗Sea-surface temperature anomaly

Sea-surface temperature compared with the 2003–2014 average, on 3 October 2026. Gray covers land, ice and gaps.
View source ↗Sea-surface temperature anomaly

Sea-surface temperature compared with the 2003–2014 average, on 4 October 2026. Gray covers land, ice and gaps.
View source ↗Sea-surface temperature anomaly

Sea-surface temperature compared with the 2003–2014 average, on 5 October 2026. Gray covers land, ice and gaps.
View source ↗Sea-surface temperature anomaly

Sea-surface temperature compared with the 2003–2014 average, on 6 October 2026. Gray covers land, ice and gaps.
View source ↗Sea-surface temperature anomaly

Sea-surface temperature compared with the 2003–2014 average, on 7 October 2026. Gray covers land, ice and gaps.
View source ↗Factsheet
- Solar semimajor axis1.000 AU
- Mean radius6,371 km
- Orbital period365.26 days
- Rotation period23.93 hours
- Mass5.972 × 10²⁴ kg
- Equatorial gravity9.80 m/s²
- Mean density5.513 g/cm³
Sources
 NASA Earth Observatory3 files · Visible color, Cloud coverage, Night lights
- NASA Visible EarthData product · Cloud coverage
 GEBCO Bathymetric Compilation Group 2026; NERC EDS British Oceanographic Data Centre NOC21 files · Elevation
MUR sea surface temperature anomalies: NASA GIBS imageryData product · NASA GIBS
 Planetary Spectrum GeneratorSoftware · NASA Goddard Space Flight Center
 JPL Approximate Positions of the PlanetsReference page · NASA/JPL Solar System Dynamics
- JPL Planetary Physical ParametersData product · NASA/JPL Solar System Dynamics
