I keep wanting to write a post showing off my latest graphics along with the latest data and forecasts, because the picture they paint is one of a truly fucked planet. From the latest global surface temperatures to sea-surface temperatures to the latest El Niño forecasts to the Earth Energy Imbalance to albedo to polar ice. And then there’s everything else. There is so much to write about, so much to document, so many warnings to give.
And then I think, “but tomorrow will be even more fucked, so if I wait a day, the article will be even stronger.” And so I wait and don’t post. And tomorrow comes and most of the time it’s more fucked, but sometimes it isn’t.
Collapse is both slow and fast. It’s glacial and it’s light speed, gradually then suddenly. Total collapse tomorrow or the day after, guaranteed! All humans will be extinct by January 1, 2030. Or, just maybe, there will be some sort of post-apocalyptic dystopia moment on March 17th, 2074. Is it too late in the collapse of everything to go to Starbucks? When is the new iPhone coming out?
The right day will never exist: a hypothetical local maximum of planetary fuckery. So I’m going to take a chance that tomorrow will not be significantly more fucked than today and share some graphics and data. Let’s have a look.
More fucked today. The planet is on day six with the global mean surface temperature above 17.0°C. The only other years on record that have broken past this barrier are 2023 and 2024. If we consider the paleo-temperature record, then it is highly likely that 2023, 2024 and 2026 are the only years to break 17.0°C in the last 115,000 years.
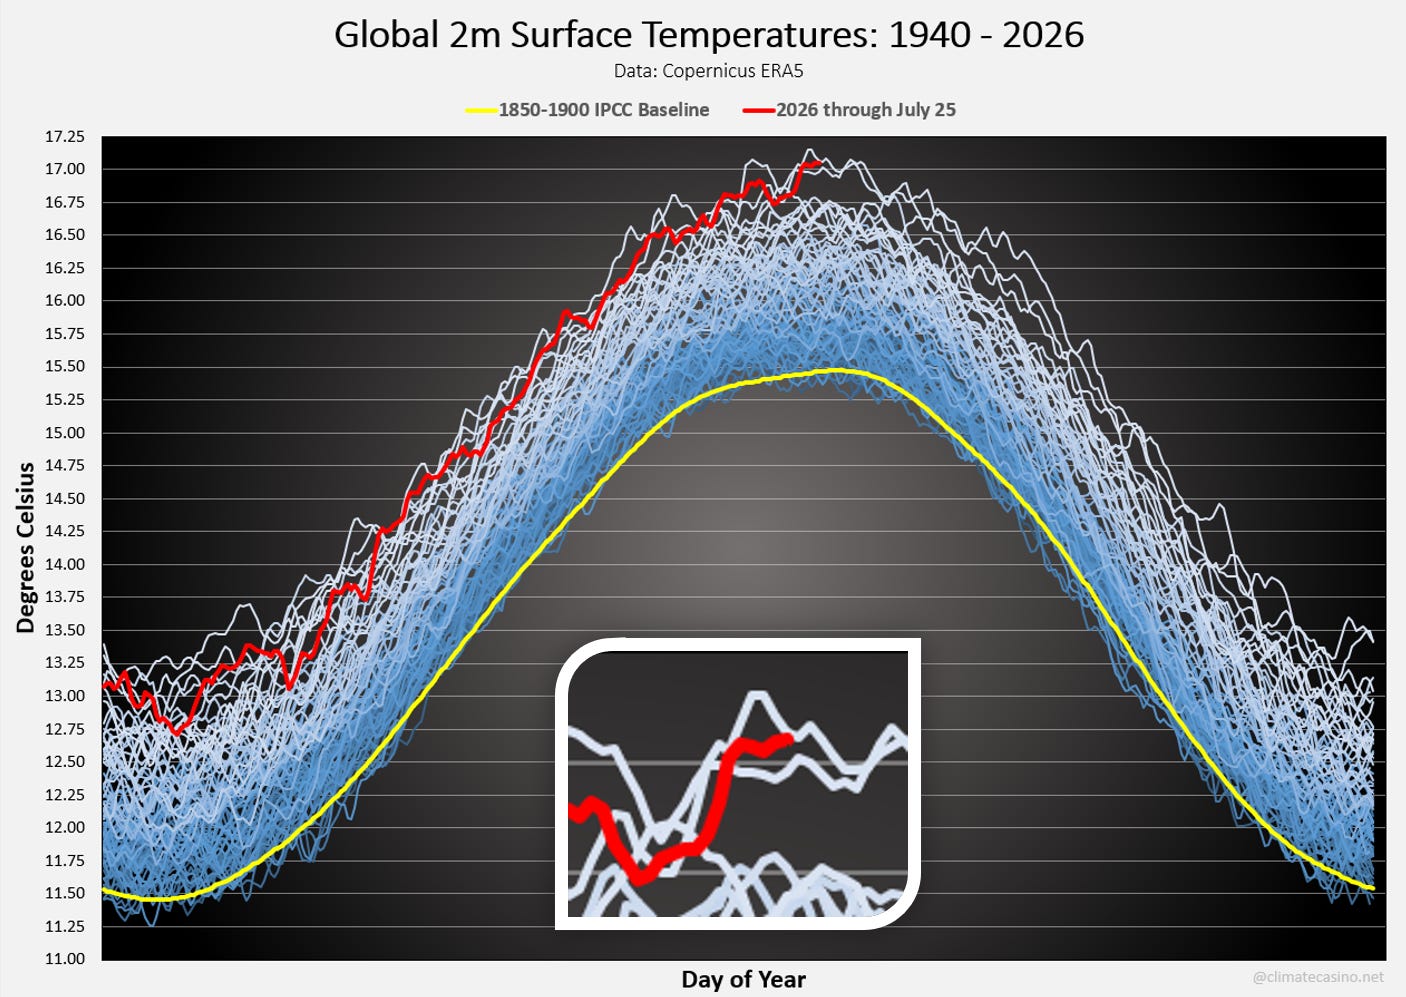
How fucked will we be tomorrow? The global mean surface temperature will likely be over 17.0°C again tomorrow and for a few more days.
Meanwhile, taking the developing record-breaking El Niño into account, the full year 2027 has a solid chance of breaking 1.70°C above the 1850-1900 pre-industrial baseline. So long Paris. It’s odds-on to see a day above 17.5°C next year, with about a 35% chance of a full month registering an anomaly of 2.0°C or higher.
A decade from now, our lonely planet will likely see the first full year with an anomaly above 2.0°C, with a daily mid-Summer peak reaching over 18.0°C.
More fucked today. It’s hard to put into any concrete terms just how insanely hot the oceans all over the planet are at this moment. Back in 2023, when new records started to be set, there was huge media interest in the topic. Some of my graphics went viral, with images showing temperatures spiking almost vertically to new record highs. Arguments over the lack of Saharan dust and the impacts of the new IMO 2020 low-sulfur shipping fuel regulations were in the headlines.
And then there’s yesterday. It’s not just that a new record daily high was set, yesterday was the 55th consecutive new daily record high, and the global oceans were a full 0.14°C hotter than any previous July 26th on record. For statistics geeks, the current temperature is more than 3.8 standard deviations above the 1991-2020 mean. The daily temperatures are on the precipice of setting a new record high temperature for any time of the year.
Is this being discussed in mainstream media? Crickets. Global oceans teetering on the edge? Crickets. Global impacts? Crickets.
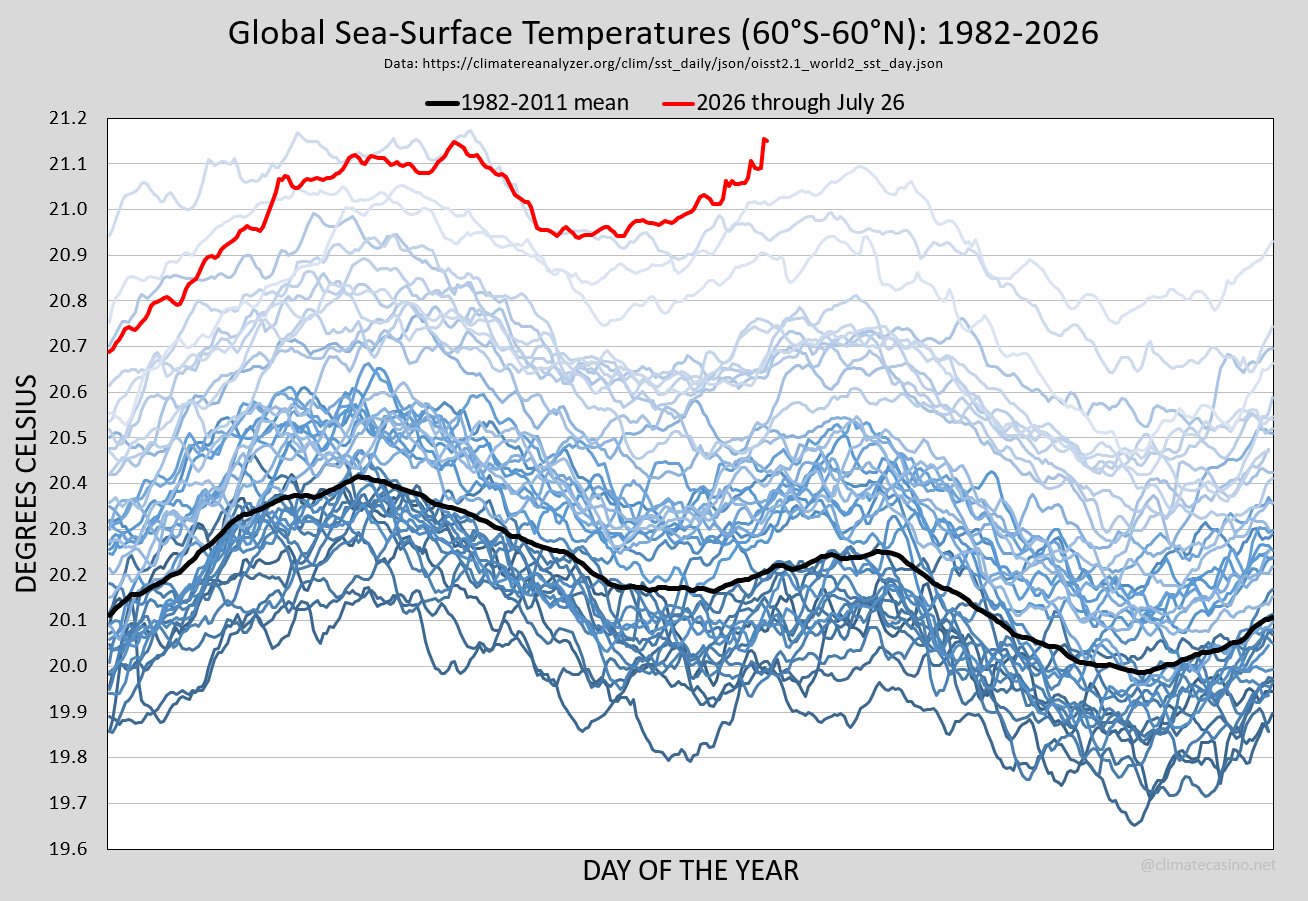
How fucked will we be tomorrow? As you can see from the image above, there is an annual peak that typically happens in late March, and a smaller secondary peak that happens in late August. Given the current sea-surface temperature, it is very likely that a new record will be set sometime in the next few weeks.
What does this mean in practice? Dead, dying and bleached coral. Marine heatwaves that cause mass die-offs for fish, seabirds and marine mammals. Toxic algae blooms. More intense hurricanes and typhoons, especially in the Pacific. And for humans, the collapse of some fisheries as fish populations migrate towards cooler polar waters.
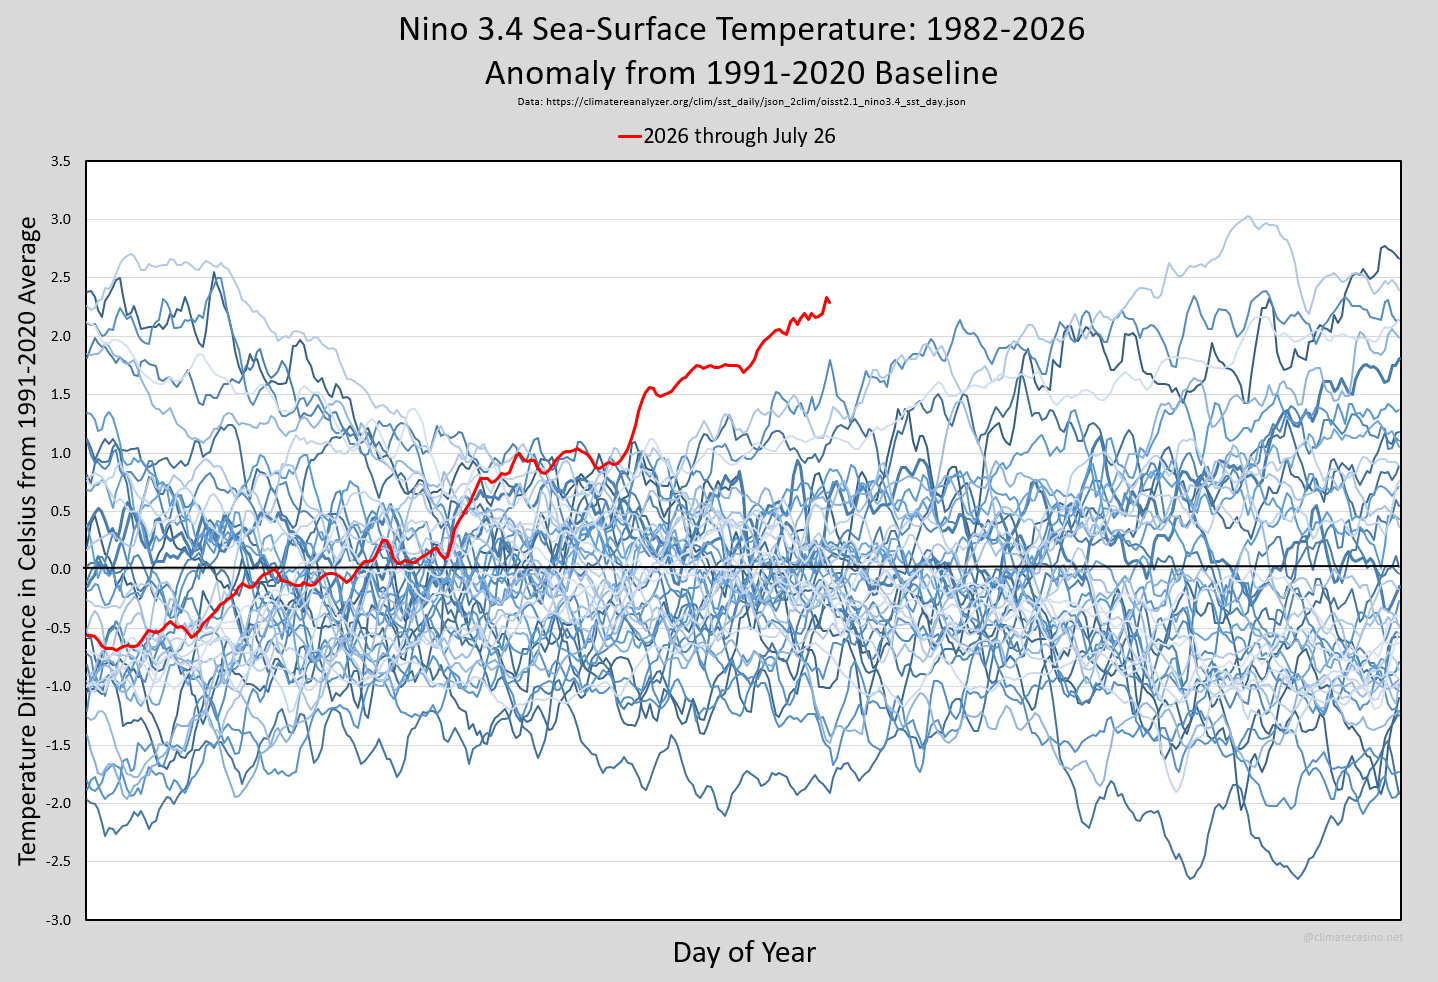
More fucked today. The current sea-surface temperature in the Niño 3.4 region is about 2.3°C above the 1991-2020 average. Niño 3.4 is the area of the Pacific Ocean used to define and quantify ENSO events. By any historical measure, this El Niño is already record-breaking. July 26th marked the 58th consecutive day with the Niño 3.4 region hitting a new record daily high, about 0.5°C above the previous daily record high.
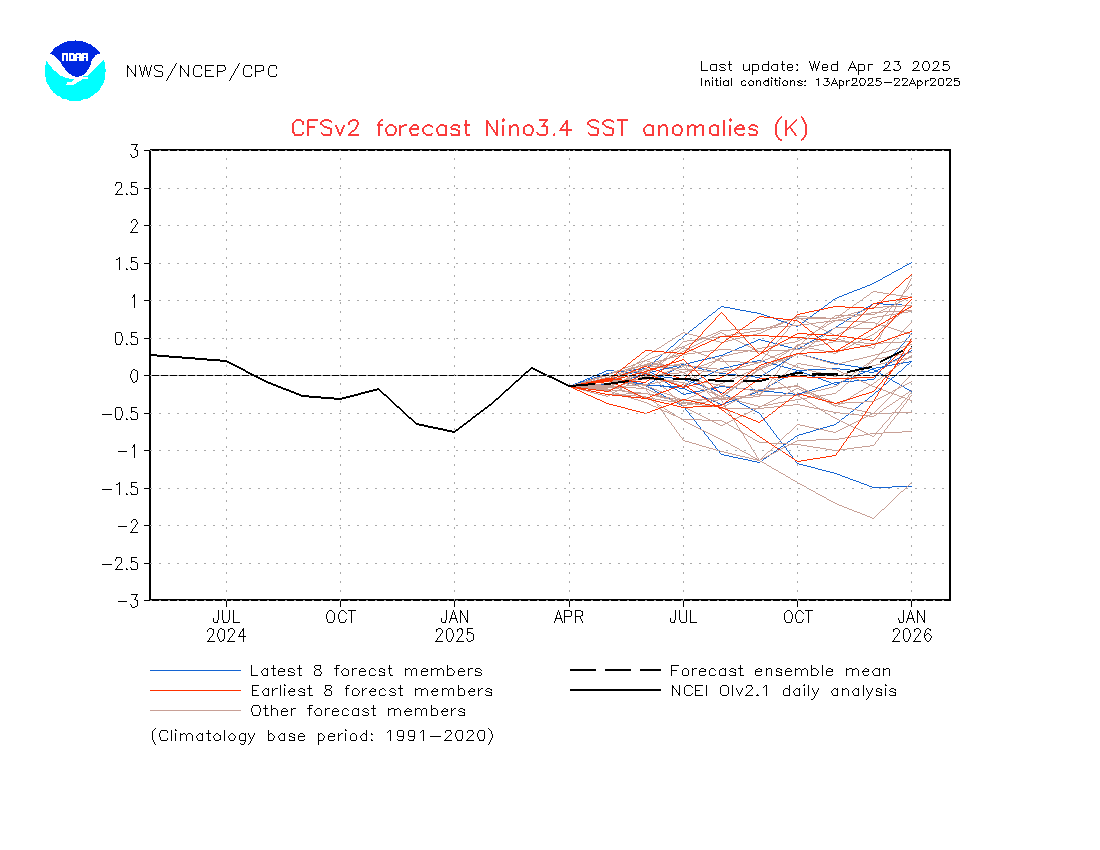
How fucked will we be tomorrow? The latest CFSv2 model run has this El Niño reaching a maximum Niño 3.4 anomaly of about 4.3°C above the 1991-2020 baseline in November. For historical purposes, the previous record Niño 3.4 anomaly was 2.8°C during the 1997-98 El Niño.
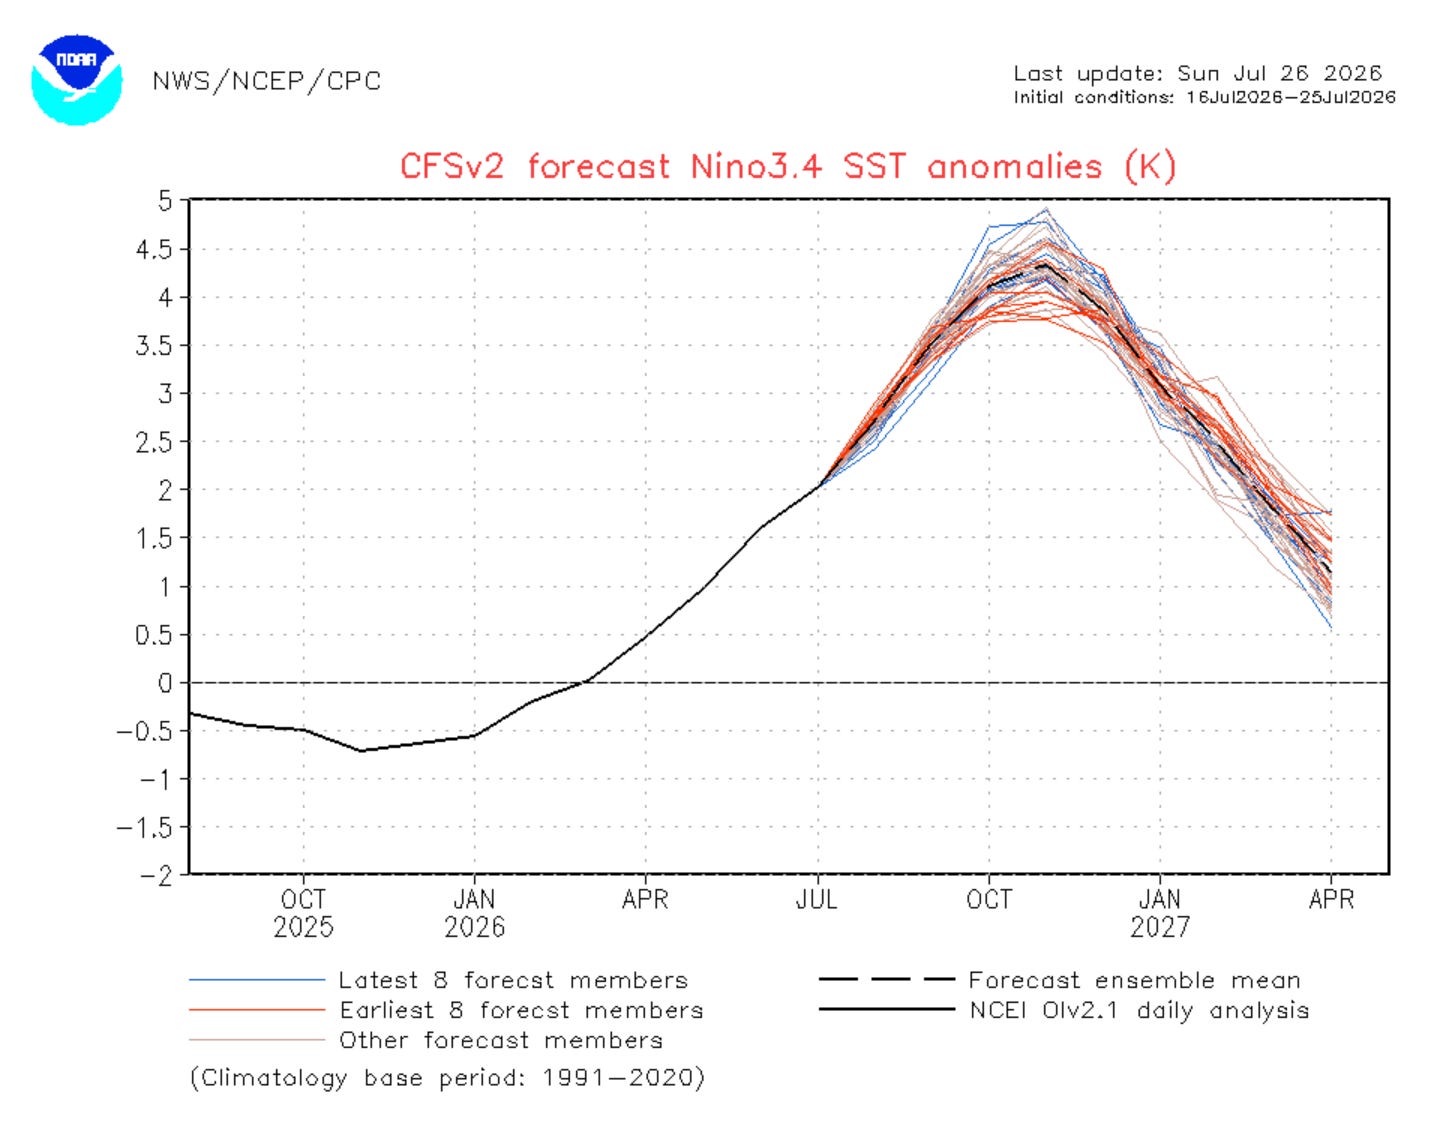
Even Zeke Hausfather, who is known for being conservative with his climate predictions, put the peak of this El Niño at over 3.5°C.
There is simply no historical precedent for a global climate event of this magnitude. Global industrial civilization has never before confronted a planetary emergency as potentially devastating. The precautionary principle says it should be all-hands on deck for every person, neighborhood, city and country to prepare for what may be coming.
Here is a quote from Adam McKay’s Yellow Dot Studios: (p.s. send this letter to your local political leaders).
This El Niño driven warming will lead to significantly more global flooding, fires, storms, droughts, deadly heat events, dangerous turbulence, and most concerning, a significant threat to food supply chains, crops, and power grids.
The previous strongest recorded El Niño occurred in 1877 leading to 40 million deaths worldwide from famine.
And this coming El Niño event looks to be even stronger.
More fucked today. The “Earth Energy Imbalance” measures the difference between incoming solar energy and the totality of outgoing energy, both reflected (short wave) and radiated (long wave). It gives a simple accounting of energy into the system versus energy out of the system. When the two are not in balance, Earth either warms or cools. According to James Hansen, the “Earth’s energy imbalance is the best diagnostic of where climate is heading.”
As of the latest data from CERES for May, 2026, on an annualized basis, the Earth Energy Imbalance shows the Earth warming at a rate of about 14 Hiroshima nuclear bombs per second. This equals about 1,200,000 Hiroshimas per day or 440 million Hiroshimas worth of planetary heating over the last 12 months.
For those who want a more politically correct way to measure the rate of heating, the current rate is equivalent to brewing about 10.7 billion cups of tea per second.
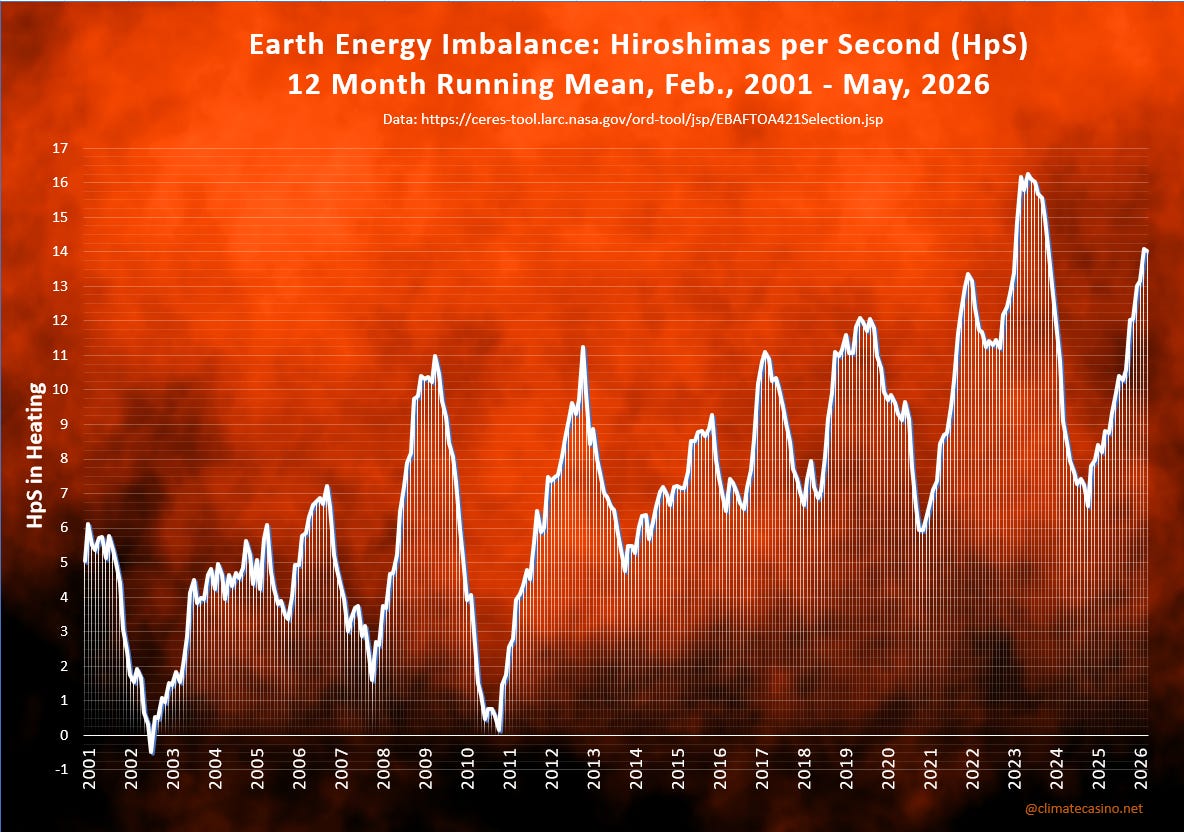
How fucked will we be tomorrow? As the planet heats up during this El Niño , there will be more outgoing longwave radiation (radiative heat). Given the strength of this El Niño , this is expected to put strong downward pressure from now until a few months after the El Niño peaks later this year. However, the long-term expectation is for the EEI to continue to set new record highs.
In other words, the planet is not only heating today at a near record pace, but the rate of heating will keep increasing for the foreseeable future.
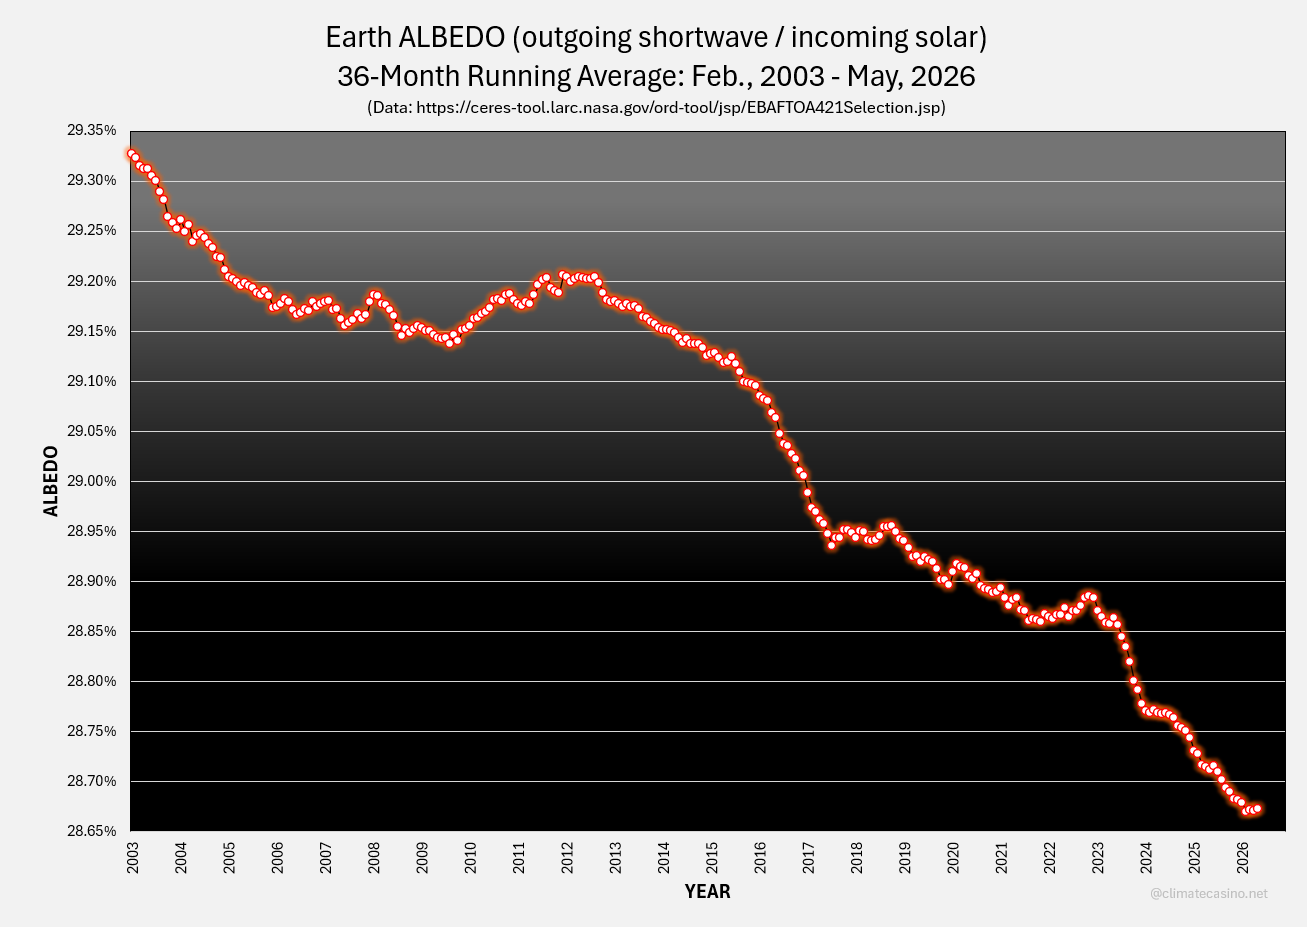
More fucked today. For those who want a quick reminder, “albedo” measures the reflectivity of the planet. It is simply the percentage of incoming solar radiation that is reflected out to space instead of being absorbed and heating the planet. The lower the albedo, the more sunlight reaches the planet’s surface to warm the oceans, melt ice, and heat land and the atmosphere.
The primary drivers of albedo are low-level cloud cover and polar snow and ice. Other drivers include ash and dust, deforestation, and declining concentrations of reflective aerosols. Because of the volatility associated with these drivers, albedo is best measured over longer average periods.
Here is the 36-month running average for albedo, from February, 2003 through May, 2026, showing May’s albedo just above the record low set in February, 2026. Over the last 23 years albedo has dropped from 29.33% to 28.67%. While these values may seem quite close to each other, on a percentage basis, the planet has lost about 2.25% of its albedo during this period.
From this 2025 article in Discover magazine:
For more than two decades, Earth has slowly been growing darker. Using 24 years of data from NASA’s Clouds and Earth’s Radiant Energy System (CERES), researchers have learned that this encroaching darkness is because Earth is reflecting less sunlight, with the most dramatic dimming occurring in the Northern Hemisphere.
How fucked will we be tomorrow? The expectation is that albedo will just keep on going down as all the main drivers are expected to keep increasing in their impact. Less ice? Check! More ash? Check! More deforestation? Check! Decreasing aerosols? Check!
And what about clouds? Virtually all global climate models predict a substantial future decrease in low-level marine cloud cover as the planet warms. This article gives three reasons scientists expect this to continue:
The first is a decrease in human-caused aerosol emissions over recent decades. Aerosols – tiny, light‑scattering particles produced mainly by burning fossil fuels – influence the formation of clouds, by acting as “seeds” for cloud droplets to form.
Second, increasing concentration of greenhouse gases in the atmosphere has led to a warmer and drier atmosphere, which also helps to dissipate clouds.
Finally, cloud cover decreases have also been linked to ocean surface warming, which affects atmospheric humidity and, thus, cloudiness. Reduced cloudiness leads to more sunlight being absorbed at the ocean surface – and more warming. This amplifying loop is known as a “cloud feedback”.
And this article finds that decreasing albedo due to cloud loss is part of a larger feedback loop:
The team also found that the thinning of low clouds … amplifies global warming through a feedback loop: Rising sea-surface temperatures lead to fewer clouds, meaning less reflected sunlight and a warmer planet.
Declining albedo is “The Great Darkening.”
More fucked today. One of the bright spots on the global doom-o-rama wheel is that polar ice is not set to hit a new low this year. As of July 26th, Arctic sea-ice extent is 8th lowest on record for the day, with data back to 1979. Likewise, Antarctic sea-ice extent is 5th lowest on record for the day. Taken together, global sea-ice extent is 4th lowest on record for the day, about 2.1 standard deviations below the 1991-2020 mean, but over 1.1 million square kilometers above the record low for the day, set in 2024.
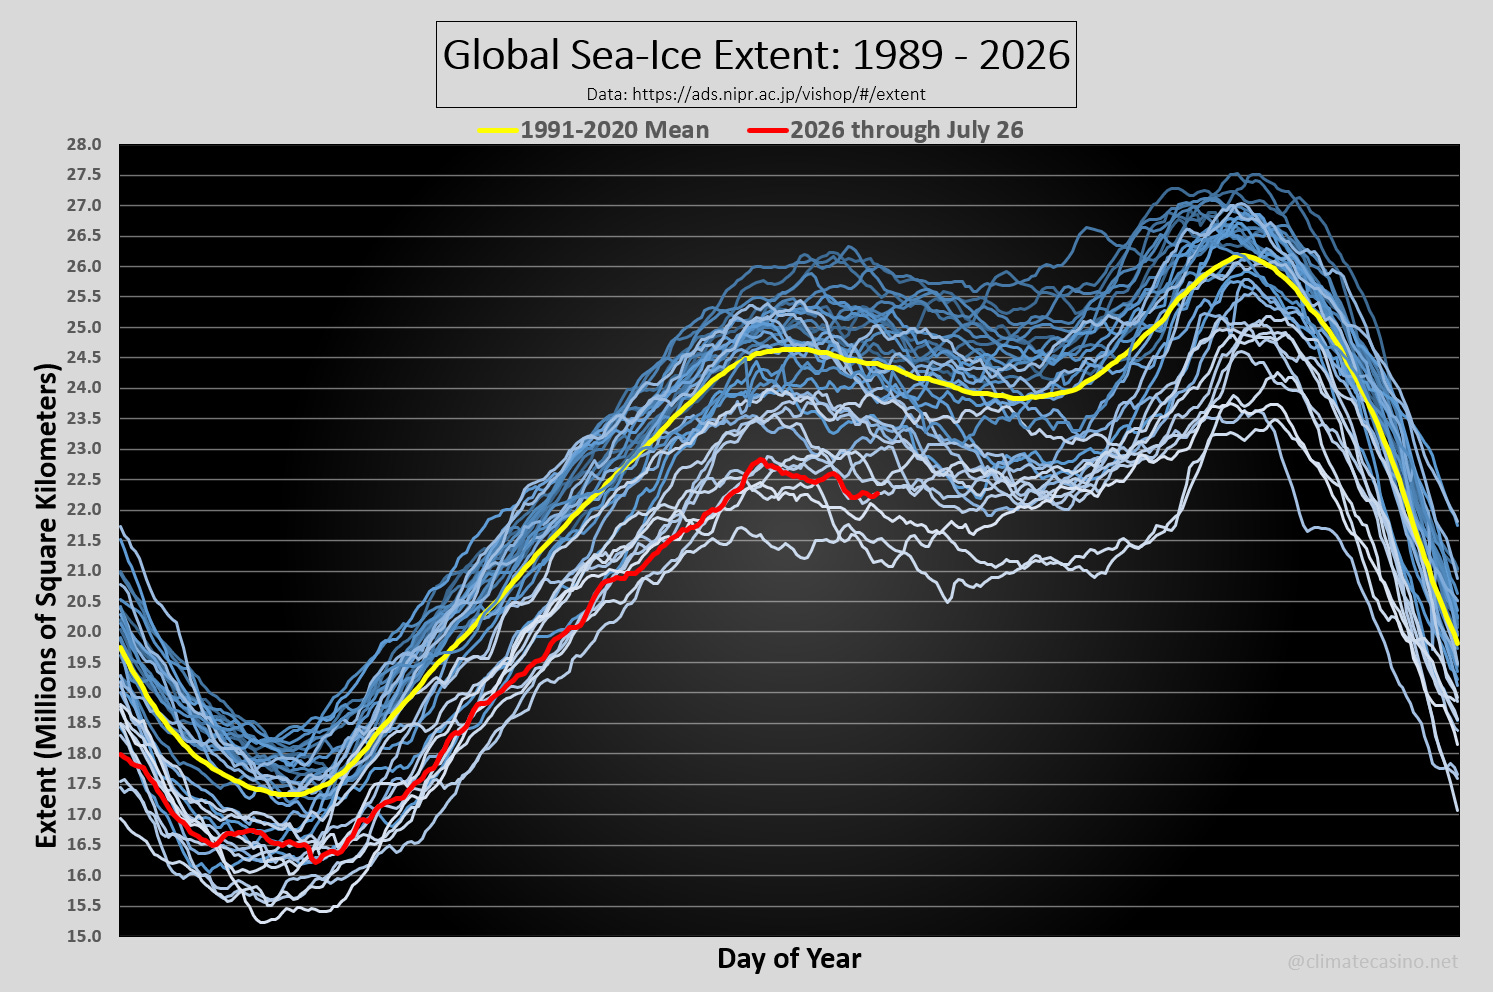
How fucked will we be tomorrow? Will a new record low maximum for global sea-ice extent be set later this year? Maybe. Will the Arctic see an ice-free summer in 2027, a so-called “Blue Ocean Event”? Probably not. But the long-term future of ice on this planet is dire. The consensus opinion of climate scientists is that the Arctic will see its first ice-free day in the 2040s or 2050s. My personal Over/Under is 2043.
But the real future fuckedness happening with Arctic sea ice is that a certain fucking horrible human piece of excrement managed to shut down “PIOMAS” Arctic data — the primary data source for Arctic volume and thickness. In other words, the future of ice is even more fucked because we have lost one of the most important tools to predict its future.
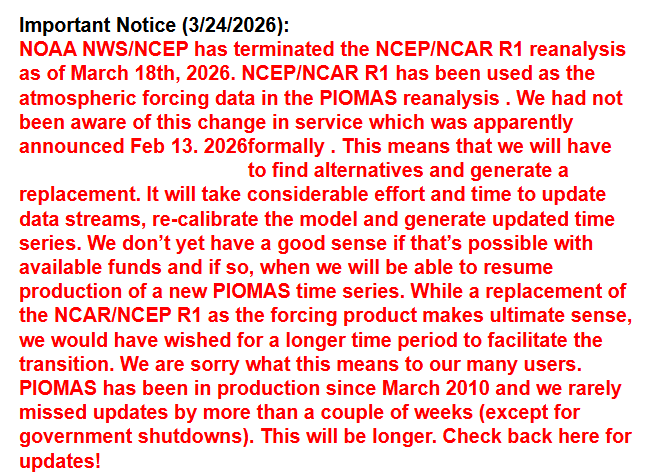
And finally, even though I neglected to mention a few things, you surely are following the latest news:
More fucked today than yesterday and even more fucked tomorrow. I’ll leave it to the interested reader to track down the information and fill in the details.