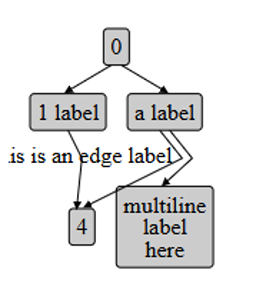
Super Simple Example
Create your first graph in seconds. Perfect starting point for beginners.
Beginner
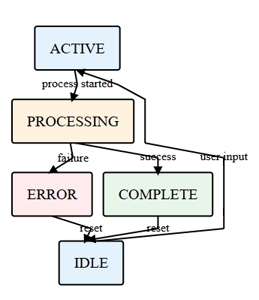
State Machine
See how states transition with smooth animations. Compare with static version.
Technical, Animated
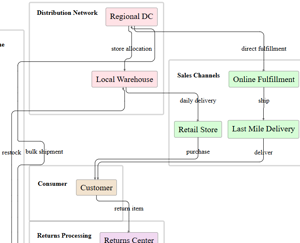
Supply Chain Flow
Visualize logistics and supply chain processes with animated flows.
Business, Animated
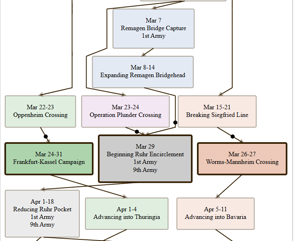
Timeline Navigation
Step through events with keyboard/mouse. Perfect for historical data.
Interactive
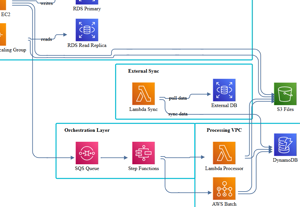
System Architecture
Technical infrastructure and component relationships.
Technical
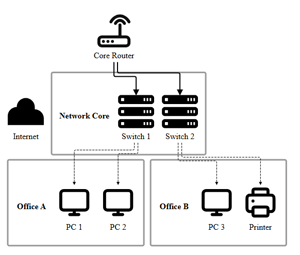
Network Topology
Visualize network connections and infrastructure.
Technical
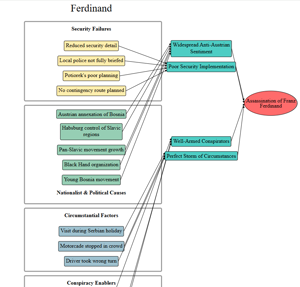
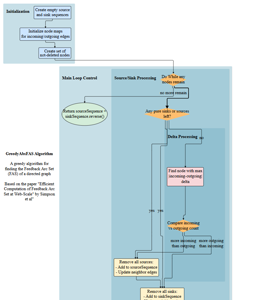
Root Cause Analysis
Break down problems to find root causes.
Analysis
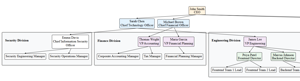
Organization Chart
Hierarchical structure and reporting relationships.
Business
Flow Chart
Step-by-step process visualization.
Business
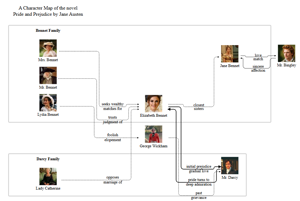
Character Map
Map relationships between characters or entities.
Analysis
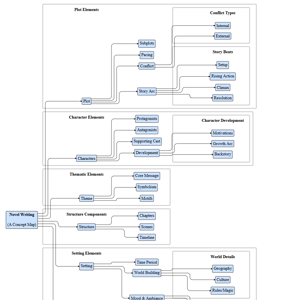
Concept Map
Connect and organize ideas and concepts.
Analysis
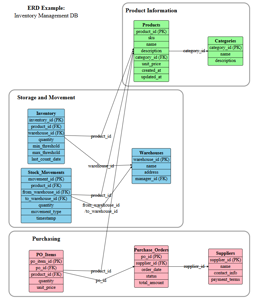
ERD
Database schema and relationship visualization.
Technical
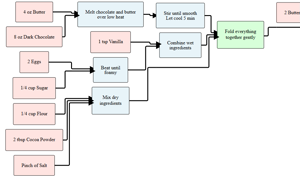
Recipe
Step-by-step recipe visualization.
Fun
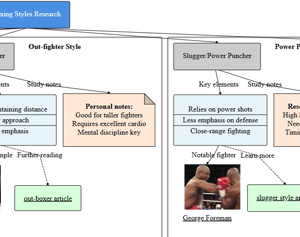
Research Notes
Organize research notes and references.
Analysis
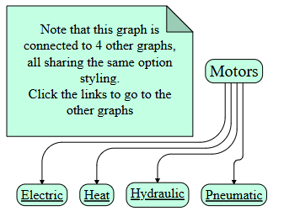
Navigable Taxonomy
A navigable set of graphs that share the same styling definition.
Technical