Finding structure in SEC filings
Every year, U.S. public companies file a comprehensive financial report called a 10-K. These reports are filed in HTML format, which can complicate automated parsing. Traditional approaches to extracting data from these HTML tables are challenging, time-consuming, and often imprecise. What should be a straightforward data extraction task becomes an endless game of whack-a-mole with edge cases.
Enter LLMs using structured generation.
This blog post demonstrates how we can use structured text generation to cut through the chaos and extract clean, consistent data directly from 10-K reports. We'll show you how to transform messy HTML tables into neat CSVs (easily read by Excel) that are primed for analysis.
Existing solutions
Several common approaches to parsing 10-K filings exist, but each has its limitations:
- Manual Extraction: Time-consuming and prone to errors.
- Custom Parsing Tools: Require frequent updates as companies alter their reporting formats.
- SEC's XBRL Format: Though machine-readable, the use of custom tags by companies hinders effective cross-company comparison.
Unfortunately, none of these methods provide a comprehensive solution to the challenge.
A solution: structured generation
Fortunately, we can use structured generation to extract the information we need from the 10-K directly into tabular data. Feed some ugly text into our model, get a fresh CSV on the other side.
Put simply, we're going to go from this unpleasant mess:
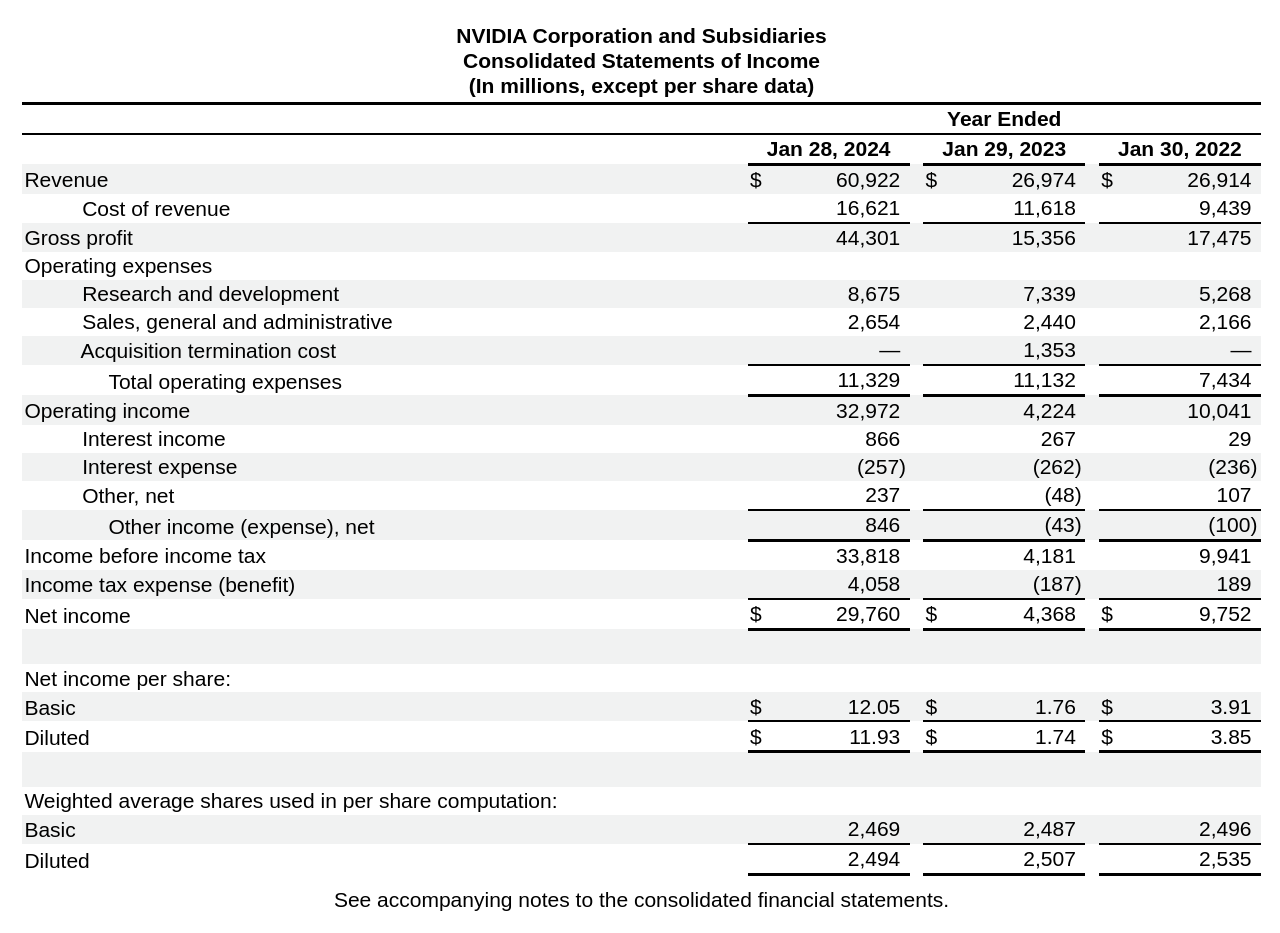
Figure 1: NVIDIA's income statement
to this clean, tidy CSV:
   year  revenue  operating_income  net_income
0  2024    60922             32972       29760
1  2023    26974              4224        4368
2  2022    26914             10041        9752
What the reports look like
Here are two examples of income statements.
The first is Microsoft. We can see revenue at the top, operating income in the middle, net income on the bottom, and three columns representing each reporting year.
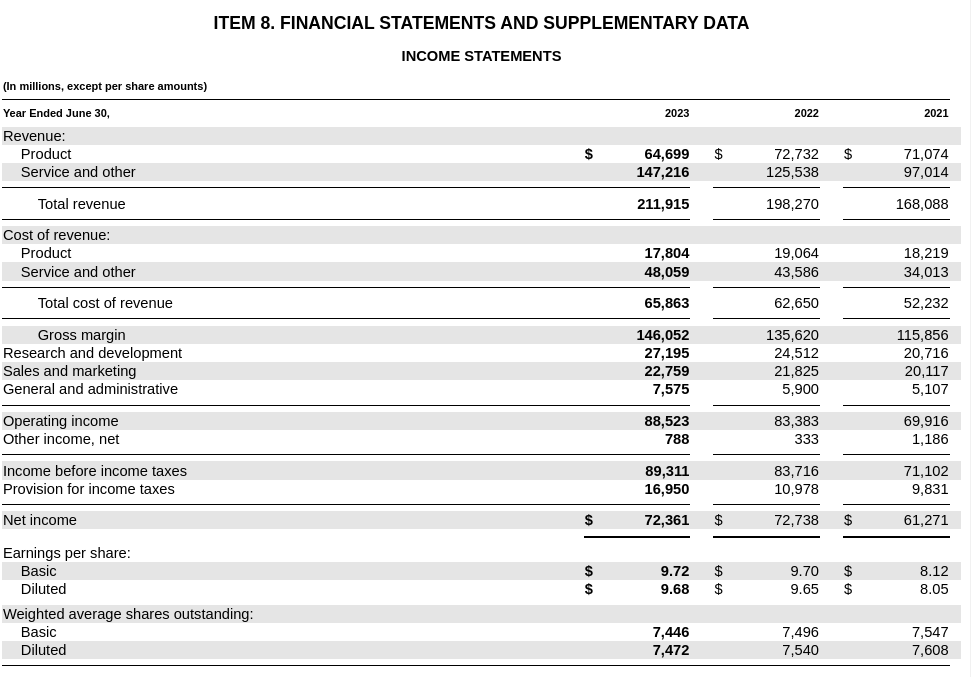
Figure 2: Microsoft's income statement
Let's compare that to Alphabet's income statement.
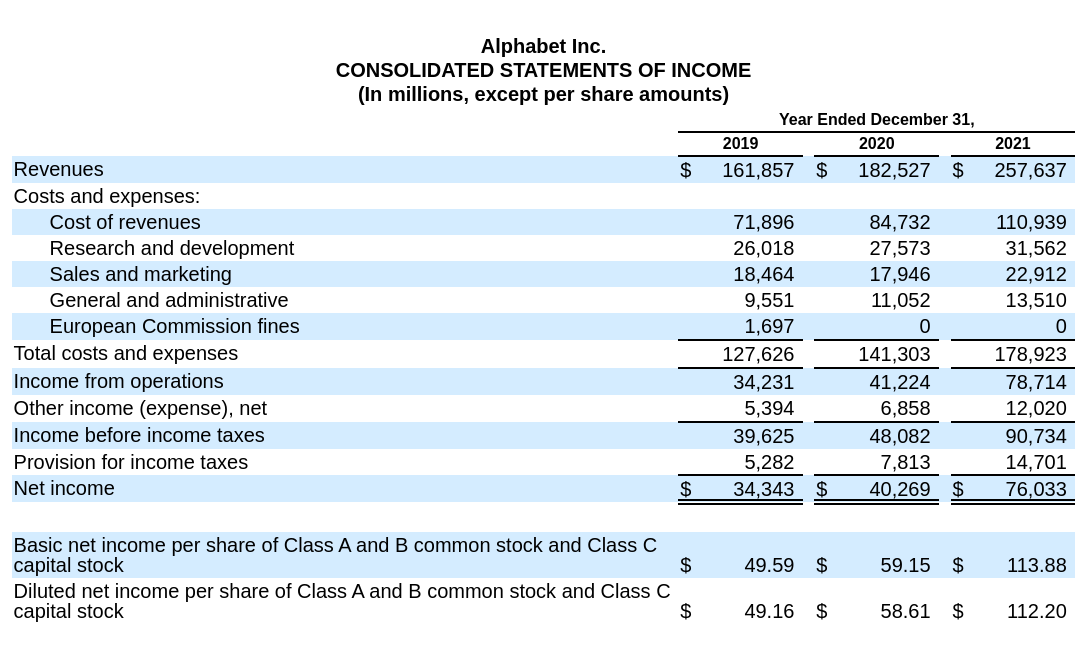
Figure 3: Alphabet's income statement
Note a few significant issues that complicate simple parsing strategies:
- Inconsistent naming (”Total Revenue” vs. "Revenues")
- Order and field formatting is completely different
- Year column ordering varies
The takeaway: these are not the same documents, but they communicate the same meaning.
Thankfully, language models are great at understanding meaning without being too caught up in details like row formatting or differences in naming conventions.
Conclusion
We've explored how structured generation can be used to extract financial data from SEC filings, specifically focusing on income statements from 10-K reports. Structured generation can transform chaotic HTML tables into clean, analysis-ready data.
However, the implications of this approach extend far beyond earnings reports.
- Extracting specific data from scientific papers
- Converting legal documents to structured contract terms
- Cleaning product catalogs for E-commerce sites
- Standardizing patient data using medical records
However, it's crucial to remember that while this method is powerful, it's not infallible. As with any AI-driven process, the results should be verified and validated, especially when dealing with critical data.
With structured generation, we're not just parsing documents - we're unlocking the potential of human-readable data at machine scale.
Getting started
Want to try this yourself? Check out full demonstration repo to play with all the detailed code, or see our cookbook for a simple example.