I engineered a first-of-its-kind tool that automates the process of optimizing profit repatriation from international subsidiaries back to corporate headquarters (HQs). This solution is relevant for multinational corporations, startups, high-net-worth individuals, and the tax advisors/accountants who serve them, offering the potential to legally save billions in taxes, and really anyone else who is interested in uncovering the secrets of how some people and companies pay tax on the profits they make globally.
My primary goals were to:
- Address a market gap: eliminate the costly, time-consuming manual research traditionally required to identify the initial steps for establishing complex tax structures.
- Increase transparency: demystify the mechanics of profit-repatriation strategies for a broader audience.
- Advance tax-planning technology: solve the technical challenge of cross-border tax-planning.
Disclaimer: this post is a technical exploration. It does not reflect or express my personal opinions or views regarding the morality, fairness, or policy of taxation, tax law, or tax avoidance strategies.
Introduction
In this blog post, I will explain step-by-step how I built TreatyHopper: a tool that aims to optimize the process of global tax routing. Typically, when repatriating profits from subsidiaries in foreign countries to the US, a tax has to be paid on the dividends (profits) that are sent by the subsidiary to the US. This tax is called a withholding tax on dividends. In order to avoid paying taxes twice (once when the money leaves the subsidiary and one more time when the money enters the US), many countries have Double Taxation Agreements (DTAs) with each other (colloquially known as tax treaties). These treaties govern which country has the right to levy the tax and to what rules they are bound. They can sometimes allow you to avoid paying withholding tax on dividends altogether, for example, allowing you to send dividends from a subsidiary in the Netherlands to your HQ in the US and pay .
Now, let's say you have another subsidiary in Zambia. Sending dividends from Zambia directly to the US would result in double taxation (once when the dividends leave Zambia and once when they arrive in the US), since Zambia doesn't have a DTA with the US. Hence you go to a tax advisor (or accountant) and he or she advises you to open a new subsidiary in France. Then you will send the money from Zambia to France and pay and then from France to the US and again pay . By intelligently using your DTAs, you have basically reduced your effective tax burden to .
Now, there is a problem, however. These tax advisors and accountants typically rely on manual research and ingrained habits, often favoring common structures like a Dutch BV or Luxembourg Sàrl. This manual approach makes it impossible to analyze the thousands of bilateral tax treaties simultaneously to find the optimal, multi-jurisdictional route. With TreatyHopper I aim to solve this problem by modeling international tax law as a directed graph problem to computationally find the most cost-effective path.
Motivation
I stumbled upon this problem by sheer coincidence. I was reading an article in a major Dutch newspaper explaining how multinational corporations often make extensive use of Dutch DTAs through subsidiaries in the Netherlands. These subsidiaries funnel dividends from many countries around the world, using the Netherlands as a conduit to send the funds to the US. By using these DTAs, these corporations are able, in some cases, to lower their effective tax burden to as low as .
This intelligent selection process (determining which countries to route dividends through) is known as treaty shopping. This interesting phenomenon led me down the rabbit hole of international tax treaties. While I found a few academic papers rigorously explaining how treaty shopping works, literature regarding network analysis and optimization was very sparse. In fact, the existing network literature seemed to come mainly from two researchers who seem to be working on this exact same problem for the last 10+ years, though their goal is to eliminate the benefits provided by these tax treaties (and impose a minimum wealth tax, among other things).
To my surprise, despite potential savings reaching billions of dollars, no public optimization tool appeared to exist (at least to the best of my knowledge). Stemming from my background in Operations Research, I decided to focus on the optimization challenge: how can I efficiently route my dividends from a source to a destination country while paying the least amount of taxes?
Problem formulation
The simplest method for answering this question is to take a pragmatic approach: collect the data on tax treaties between countries using web agents, create a directed graph with the collected data, and run Dijkstra's algorithm to find an answer.
Web agents
First of all, I would like to mention that the project I undertook with TreatyHopper would have required significantly more time before the advent of agentic AI. Manually, finding all the relevant tax treaties, gathering the data, and parsing it into something meaningful would have taken so much time that I probably wouldn't have undertaken the project at all. Luckily, in the present day, we can use agentic AI to perform repetitive tasks for us.
I won't detail the process too much, as I used an online service instead of programming it from scratch. However, I essentially deployed an army of web agents (in the agentic AI sense) to collect data on DTAs, specifically focusing on the withholding tax rate on dividends.
The process resulted in the compilation of data on tax treaties worldwide. This involved about source countries and destination countries (not all countries have treaties with each other, so there are not values).
The highest withholding tax identified was , applied when moving dividends from Greece to Finland. Conversely, the lowest tax rates were , primarily for transactions originating from countries such as the Netherlands and Luxembourg, which are by some considered to be tax havens.
It is worth mentioning that these tax rates often differ based on the percentage of subsidiary ownership. For the sake of generalization, we assume that all intermediaries and the subsidiaries are wholly owned in the ownership path. This means the operating subsidiary is owned by the first intermediary, which is owned by the next, and so on, until the final intermediary is owned by the HQ. We also ignore the costs associated with setting up such corporate structures.
Furthermore, governments around the world have introduced measures such as the general anti-avoidance rules (GAAR) and the principal purpose test (PPT). For now, for the sake of abstraction, we will ignore these measures (which I reckon, is a very strong assumption).
Data structure
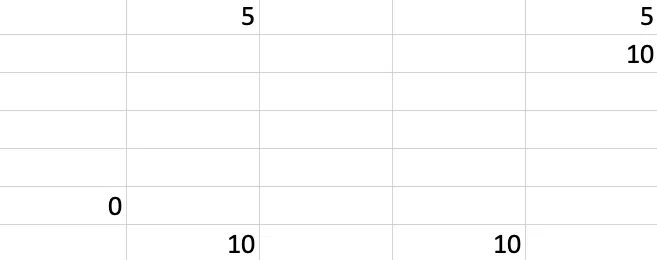
Upon initial thought, my idea was to put all the data in an adjacency matrix with columns for the countries where the dividends were originating from and rows for the countries where they could be sent to. However, upon visual verification (and of course logical deduction), the adjacency matrix would have been extremely sparse ( entries with about of them being NULL values). This is what some of the entries look like:
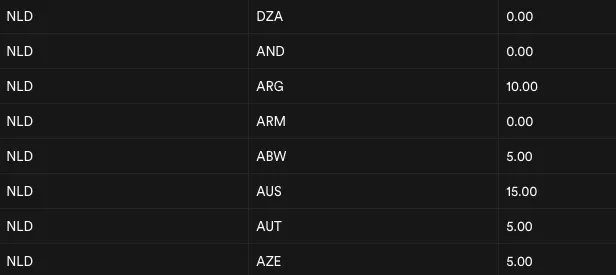
Therefore I decided to use an edge list (see picture below) instead, which in our case has better space complexity than the adjacency matrix.
Directed graph
We define a directed graph . Here, represents the set of all jurisdictions in our data, and is the set of directed edges between jurisdiction and jurisdiction that have a DTA in our data. Note that DTAs are not necessarily symmetric. The tax rate for sending money from country to country often differs from the rate for sending money from to .
Each directed edge is assigned a non-negative weight (more on this later), , representing the cost of moving profits from jurisdiction to jurisdiction .
We have a source , where our profits originate, and a destination , where our profits should ultimately reside.
Dijkstra's algorithm
Now that we have defined the components of this problem, we shall proceed with the most important part: the objective function. Truly what I am trying to achieve here is to find the method by which I retain the biggest part of my dividends when sending them from my subsidiaries to my HQ.
Let be the withholding tax rate when sending dividends from jurisdiction to jurisdiction . If the tax rate is , the fraction of the dividend I retain is .
We want to find the path that can look like such that we maximize the retention of our dividends. The overall retention is the product of all retention factors along the path:
In other words, we want to find the path that maximizes our objective function :
The additive transformation
Note that this formulation involves a product and a maximization. Recall that Dijkstra's algorithm only works on additive path costs (weights) with non-negative costs and is designed for minimization problems. Therefore, I must employ a smart trick to rewrite this problem as a minimization problem with additive weights.
The key mathematical property I use is the logarithm, which converts multiplication into addition (). To transform the maximization into a minimization, I optimize for the negative logarithm of the objective function.
Minimizing is mathematically equivalent to maximizing . Applying this to my objective:
Using the logarithm rule for products, I can convert this into a sum:
This immediately yields the cost (weight) for each edge in my network as the term within the summation:
This brings us to the final, shortest-path compatible objective function:
Verification of non-negativity
For Dijkstra's algorithm to work reliably, all weights must be non-negative. Since tax rates are bound by , the retention factor must be in the range . The natural logarithm of any number in this range is always zero or negative, .
Since is the negative of this value, , it must be non-negative (). The transformation is therefore valid for using Dijkstra's algorithm.
Solution
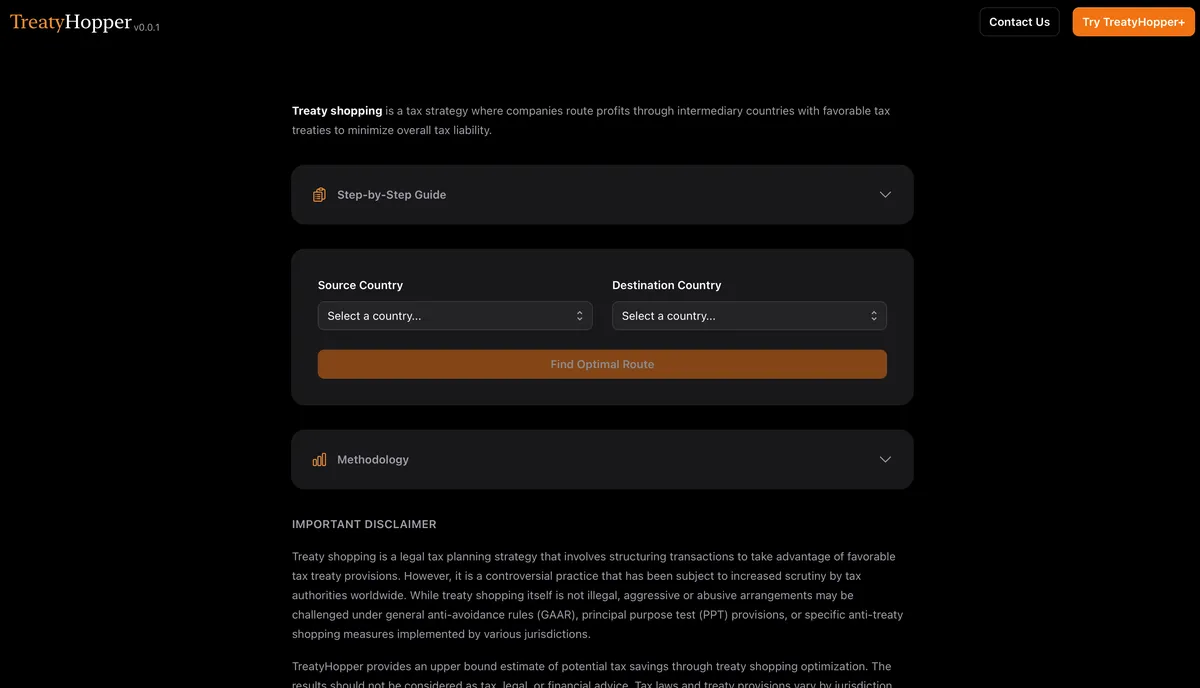
To keep things simple, I chose Next.js as the full stack framework for building a minimum viable product (MVP). Furthermore, I use Supabase for storing the edge list. Combining everything together and packaging it in a user-friendly interface, this led to the culmination of V0.0.1 of TreatyHopper:
I shared the tool with a small initial group of users and have received some valuable feedback, and generally favorable reviews from them. If you are a startup, multinational corporation, tax advisor, accountant, or otherwise interested in using the tool or see other use cases that require some adjustments, feel free to contact me through this form.
Next steps
Thanks for reading this far! I really appreciate it. I have tried my absolute best to minimize the use of LLMs to write this text. Apart from improving my spelling, I haven't really used it. I hope it was an interesting read and please feel free to provide any feedback on this post. Now: what is next for TreatyHopper?
In the coming few weeks I intend to add the following features and address the following feedback:
- I am currently working on a very early version of this tool utilizing Graph Neural Networks (GNNs) to predict the risks associated with certain paths. For example, in general, the governments of some countries are stricter when it comes to the enforcement of countermeasures such as GAAR and PPT. It would be interesting to see if we can somehow predict the risk associated with repatriating profits through some of these countries.
- Expand the tool to answer the following questions: how much of the profits are left after repatriating them? What happens if we limit the number of subsidiaries (e.g., we don't want to have a subsidiary in some countries)? Can we reduce the number of hops (i.e., intermediate jurisdictions in the route)? Note to self: see notes in notebook.
- I am having a hard time verifying the data found by the web agents. It is inevitable that there are some mistakes in the data, as it is very hard to verify that the data found by the web agents is correct. Currently, I have randomly checked some of the numbers, and so far there seems to be about a mistake in around of them. However, this is still a lot, and I am especially keen on reducing this to close to .
- Add agent support for reasoning about certain routes and arguing about their soundness.
- Remove sanctioned countries.
- Improve parsing of data into Supabase.
- Add a changelog.
- Add a disclaimer before running the tool about the fact that it can still make some mistakes and that as of right now, the tool can be best used as a starting point for more advanced tax optimization.
- Some people asked me why I didn't use the Floyd-Warshall algorithm. I could have used it, but to keep things simple, I opted for Dijkstra's algorithm. The main reason being that I need not necessarily calculate the shortest paths between all pairs of start and destination vertices.