How far from normal
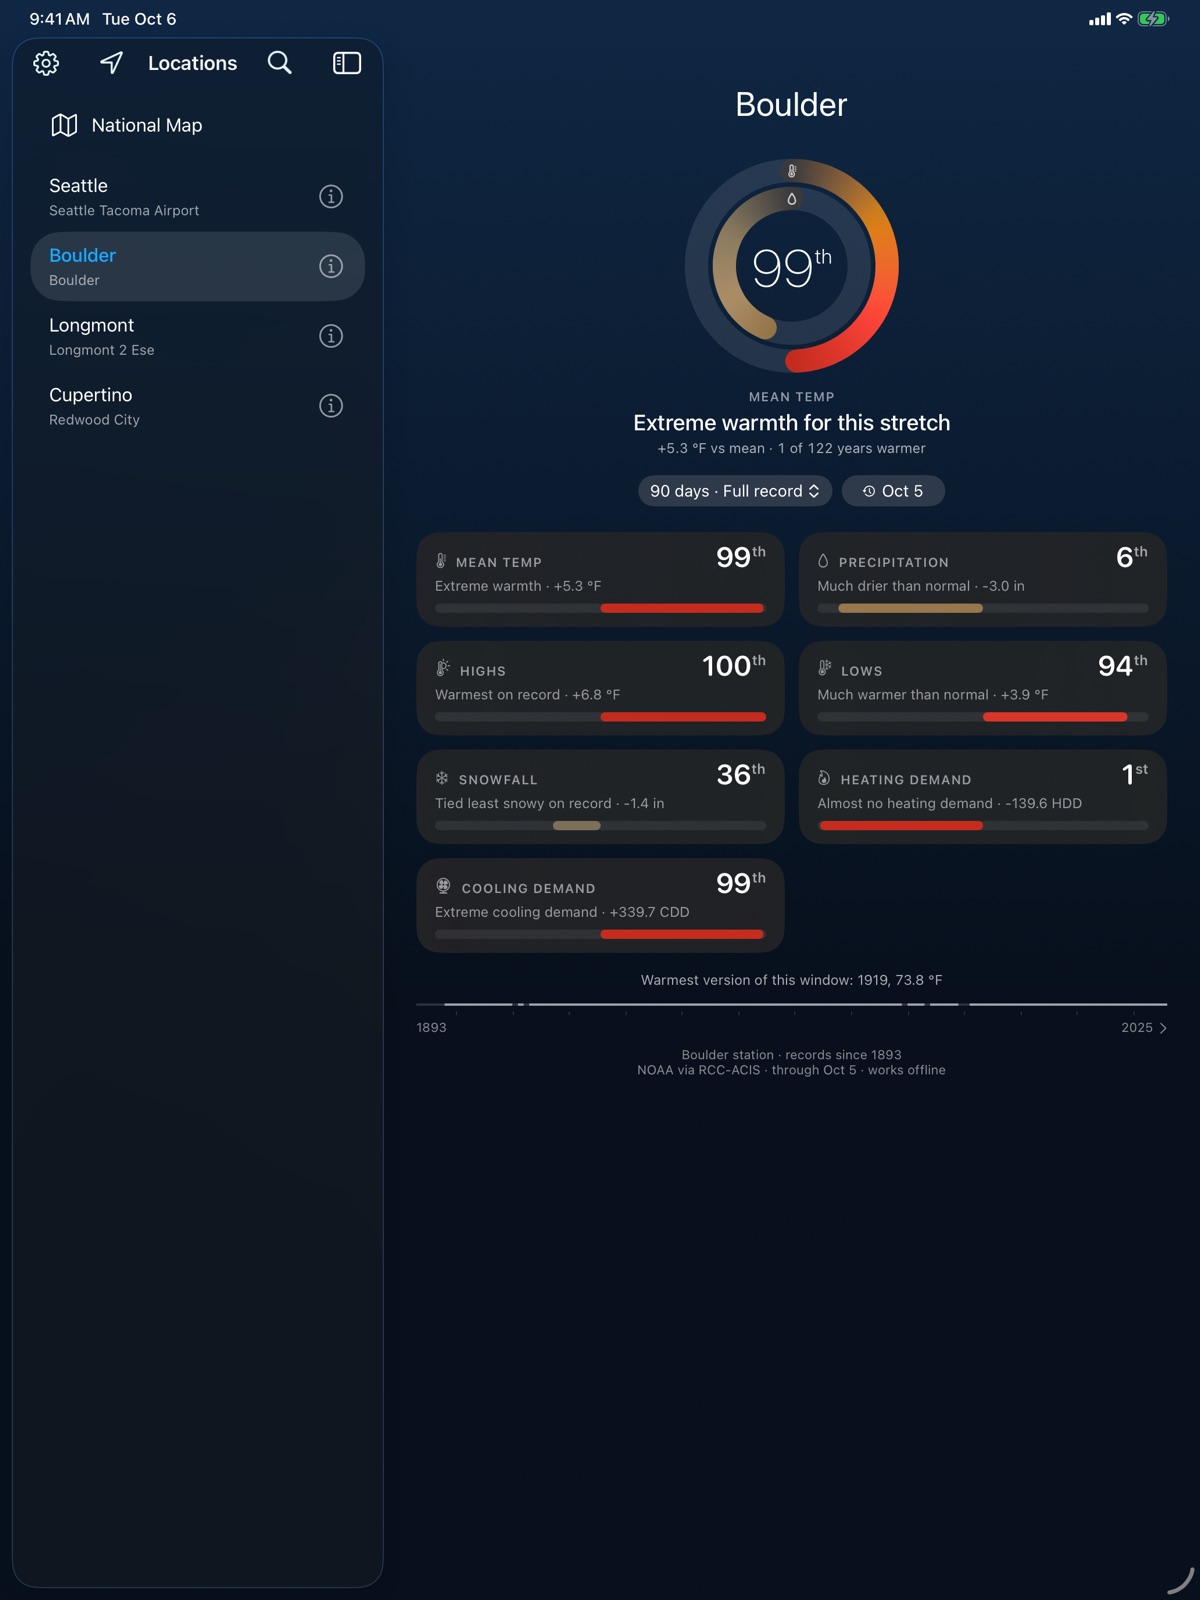
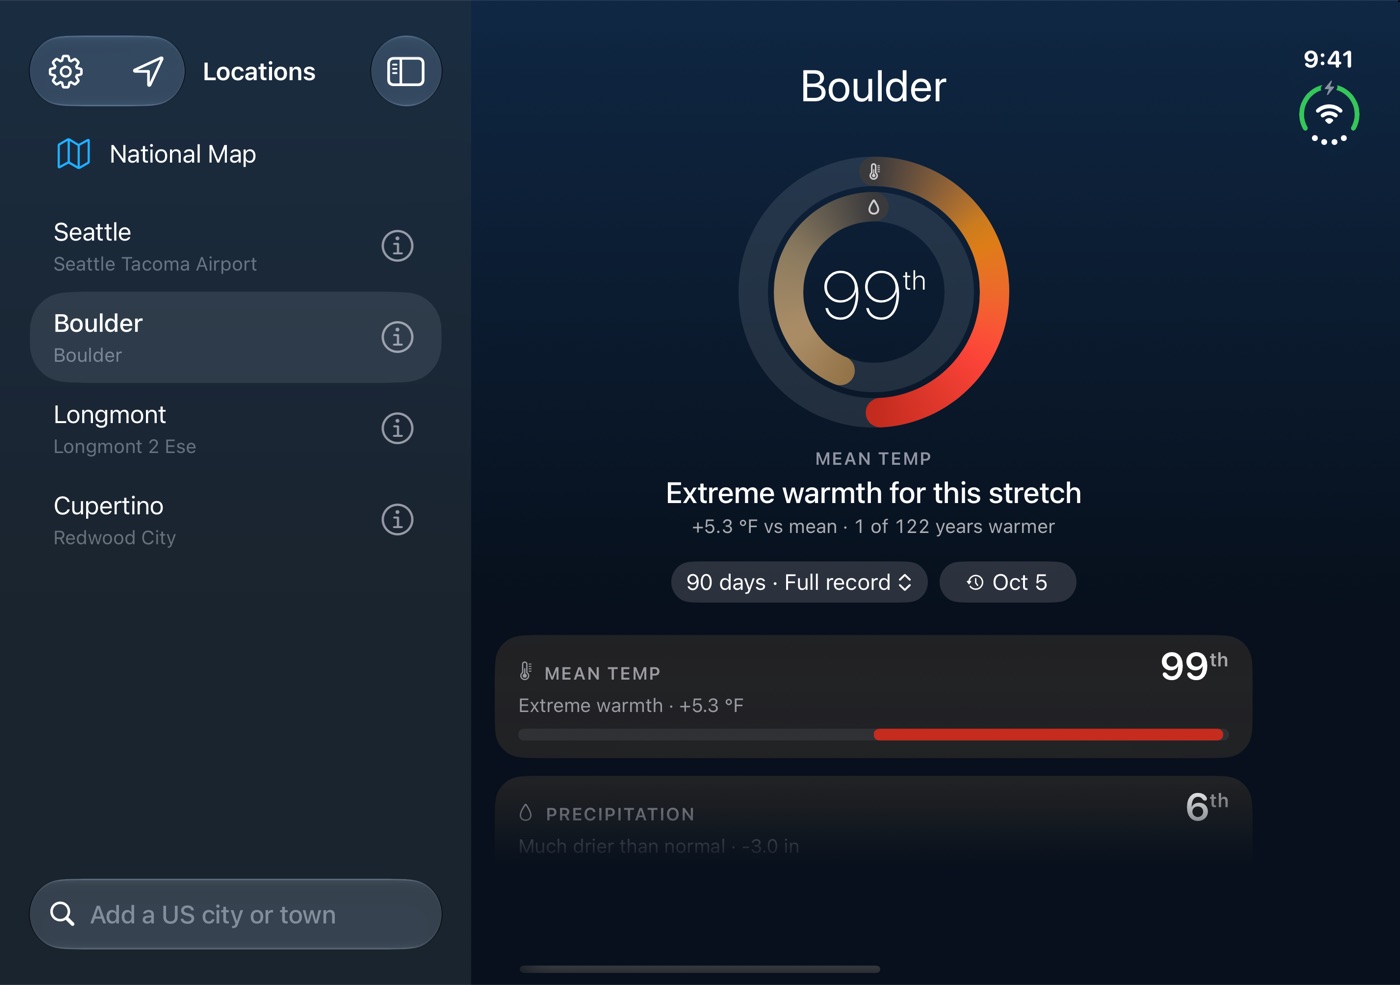
The number in the middle is a percentile. Take the last 90 days at your station, line them up against the same 90 days in every other year it has recorded, and see where this year lands. 99th means warmer than nearly all of them.
Each ring is a measure. Normal sits at the top. Warmer or wetter runs clockwise, cooler or drier runs counterclockwise, and the bottom of the ring is a record.
Every year on record
Tap a card for the whole picture. Each past year is a dot, so you can tell whether this one is out on its own or somewhere in the crowd.
Below that, the last 90 days are drawn day by day against the range the station has seen before, with the middle half and middle 80% of years shaded in.
Looking back
Tap the date under the rings to see how any earlier stretch compared. The strip at the bottom has a stripe for every year the station has, from cool blue to warm red. Scrub through it, or press play and let the decades roll by.
The past year is free. Going back further, and playback, come with Bell Weather Unlimited.
The national map
174 long-record stations across all 50 states, each showing its own percentile for the same stretch of days. Step back a month at a time to see how the past year moved across the country.
It’s helpful to be able to check out the actual data and see exactly what the change has been over time rather than relying on anecdotal evidence.
iPad and iPhone Duo
On a bigger screen your locations sit in a sidebar next to the page. Hide the sidebar and you can swipe between them.
Also
Widgets
Rings or a dot chart for one location, on the Home Screen or the Lock Screen.
Your choice of station
Each location gets the nearby station with the longest, most complete record. If you'd rather use a different one, you can.
Baselines
Compare against the full record, 1951–1980, 1991–2020, or the last 15 years.
Works offline
Once a location has loaded, its whole history lives on your phone. A small update each day keeps it current.
°F or °C
Fahrenheit and inches, or Celsius and millimetres.
Four icons
Pick the one you like best in Settings.
Questions
Where does the data come from?
Daily station records from NOAA's Global Historical Climatology Network, served through the Regional Climate Centers' ACIS system. When you add a location, Bell Weather downloads the station's entire daily history, then keeps it up to date with a small update each day.
Bell Weather isn't affiliated with or endorsed by NOAA or the Regional Climate Centers.
What does the percentile mean?
Take the last 90 days at a station. Then take the same 90 calendar days from every other year that station has on record, and put them all in order. If this year lands above 70 of the 80 other years, that's the 88th percentile. If it's above 40 of them, that's the 50th.
Years that tie split the difference, so a year matching ten others counts as beating five of them. You can switch the window to 30 or 60 days.
Is this a forecast?
No. There are no models or predictions anywhere in the app. Bell Weather only compares measurements that have already been taken, going back as far as the station does.
Why is my location using a station at the airport?
Stations are picked for how many years they cover and how complete their records are, so the one chosen for a location isn't always the closest. The best record is often at an airport rather than in town. You can see the alternatives, with how much of each record is usable, and switch to any of them. Different stations are never mixed in one comparison.
Why doesn't "normal" match what I hear on the news?
Forecasters usually mean the 1991–2020 average, which is NOAA's current set of official climate normals. Bell Weather defaults to the station's full record, which for many stations goes back more than a century. You can switch to 1951–1980, 1991–2020 or the last 15 years, and the answer can move quite a bit depending on which you pick.
Does it work outside the US?
Not at the moment. Locations need to be in the United States, including Alaska and Hawaii.
What does it cost?
Bell Weather is free to download, and two saved locations are free. Bell Weather Unlimited is a one-time $4.99 purchase that adds unlimited locations and the timeline back through every past year. There's no subscription, and it works with Family Sharing.
If you downloaded Bell Weather before version 1.1, you already have Unlimited.
What happens to my data?
There's no account, no ads and no analytics. Besides requests for weather data and map searches, the only thing that leaves your device is your list of places, which syncs through your own iCloud account. If you use your current location, it's rounded to about a kilometer and used only to find nearby stations. The full privacy policy has the details.
Something looks wrong. Who do I tell?
Email bellweather@jonathankizer.com, or use Send feedback in the app's Settings, which fills in your app version and the stations you've saved. If the problem is in the station's own readings, I can't fix those, but I can at least tell you so.
Press kit
Bell Weather is an iPhone and iPad app that compares the last few weeks of weather with every year on record at a nearby NOAA weather station. It's made by Jonathan Kizer and has been on the App Store since October 2026.
- App icon (PNG, 1024 × 1024)
- Screenshots (iPhone and iPad, PNG)
- App Store listing
- Contact: bellweather@jonathankizer.com