🏷️
Automatic data clustering & labeling
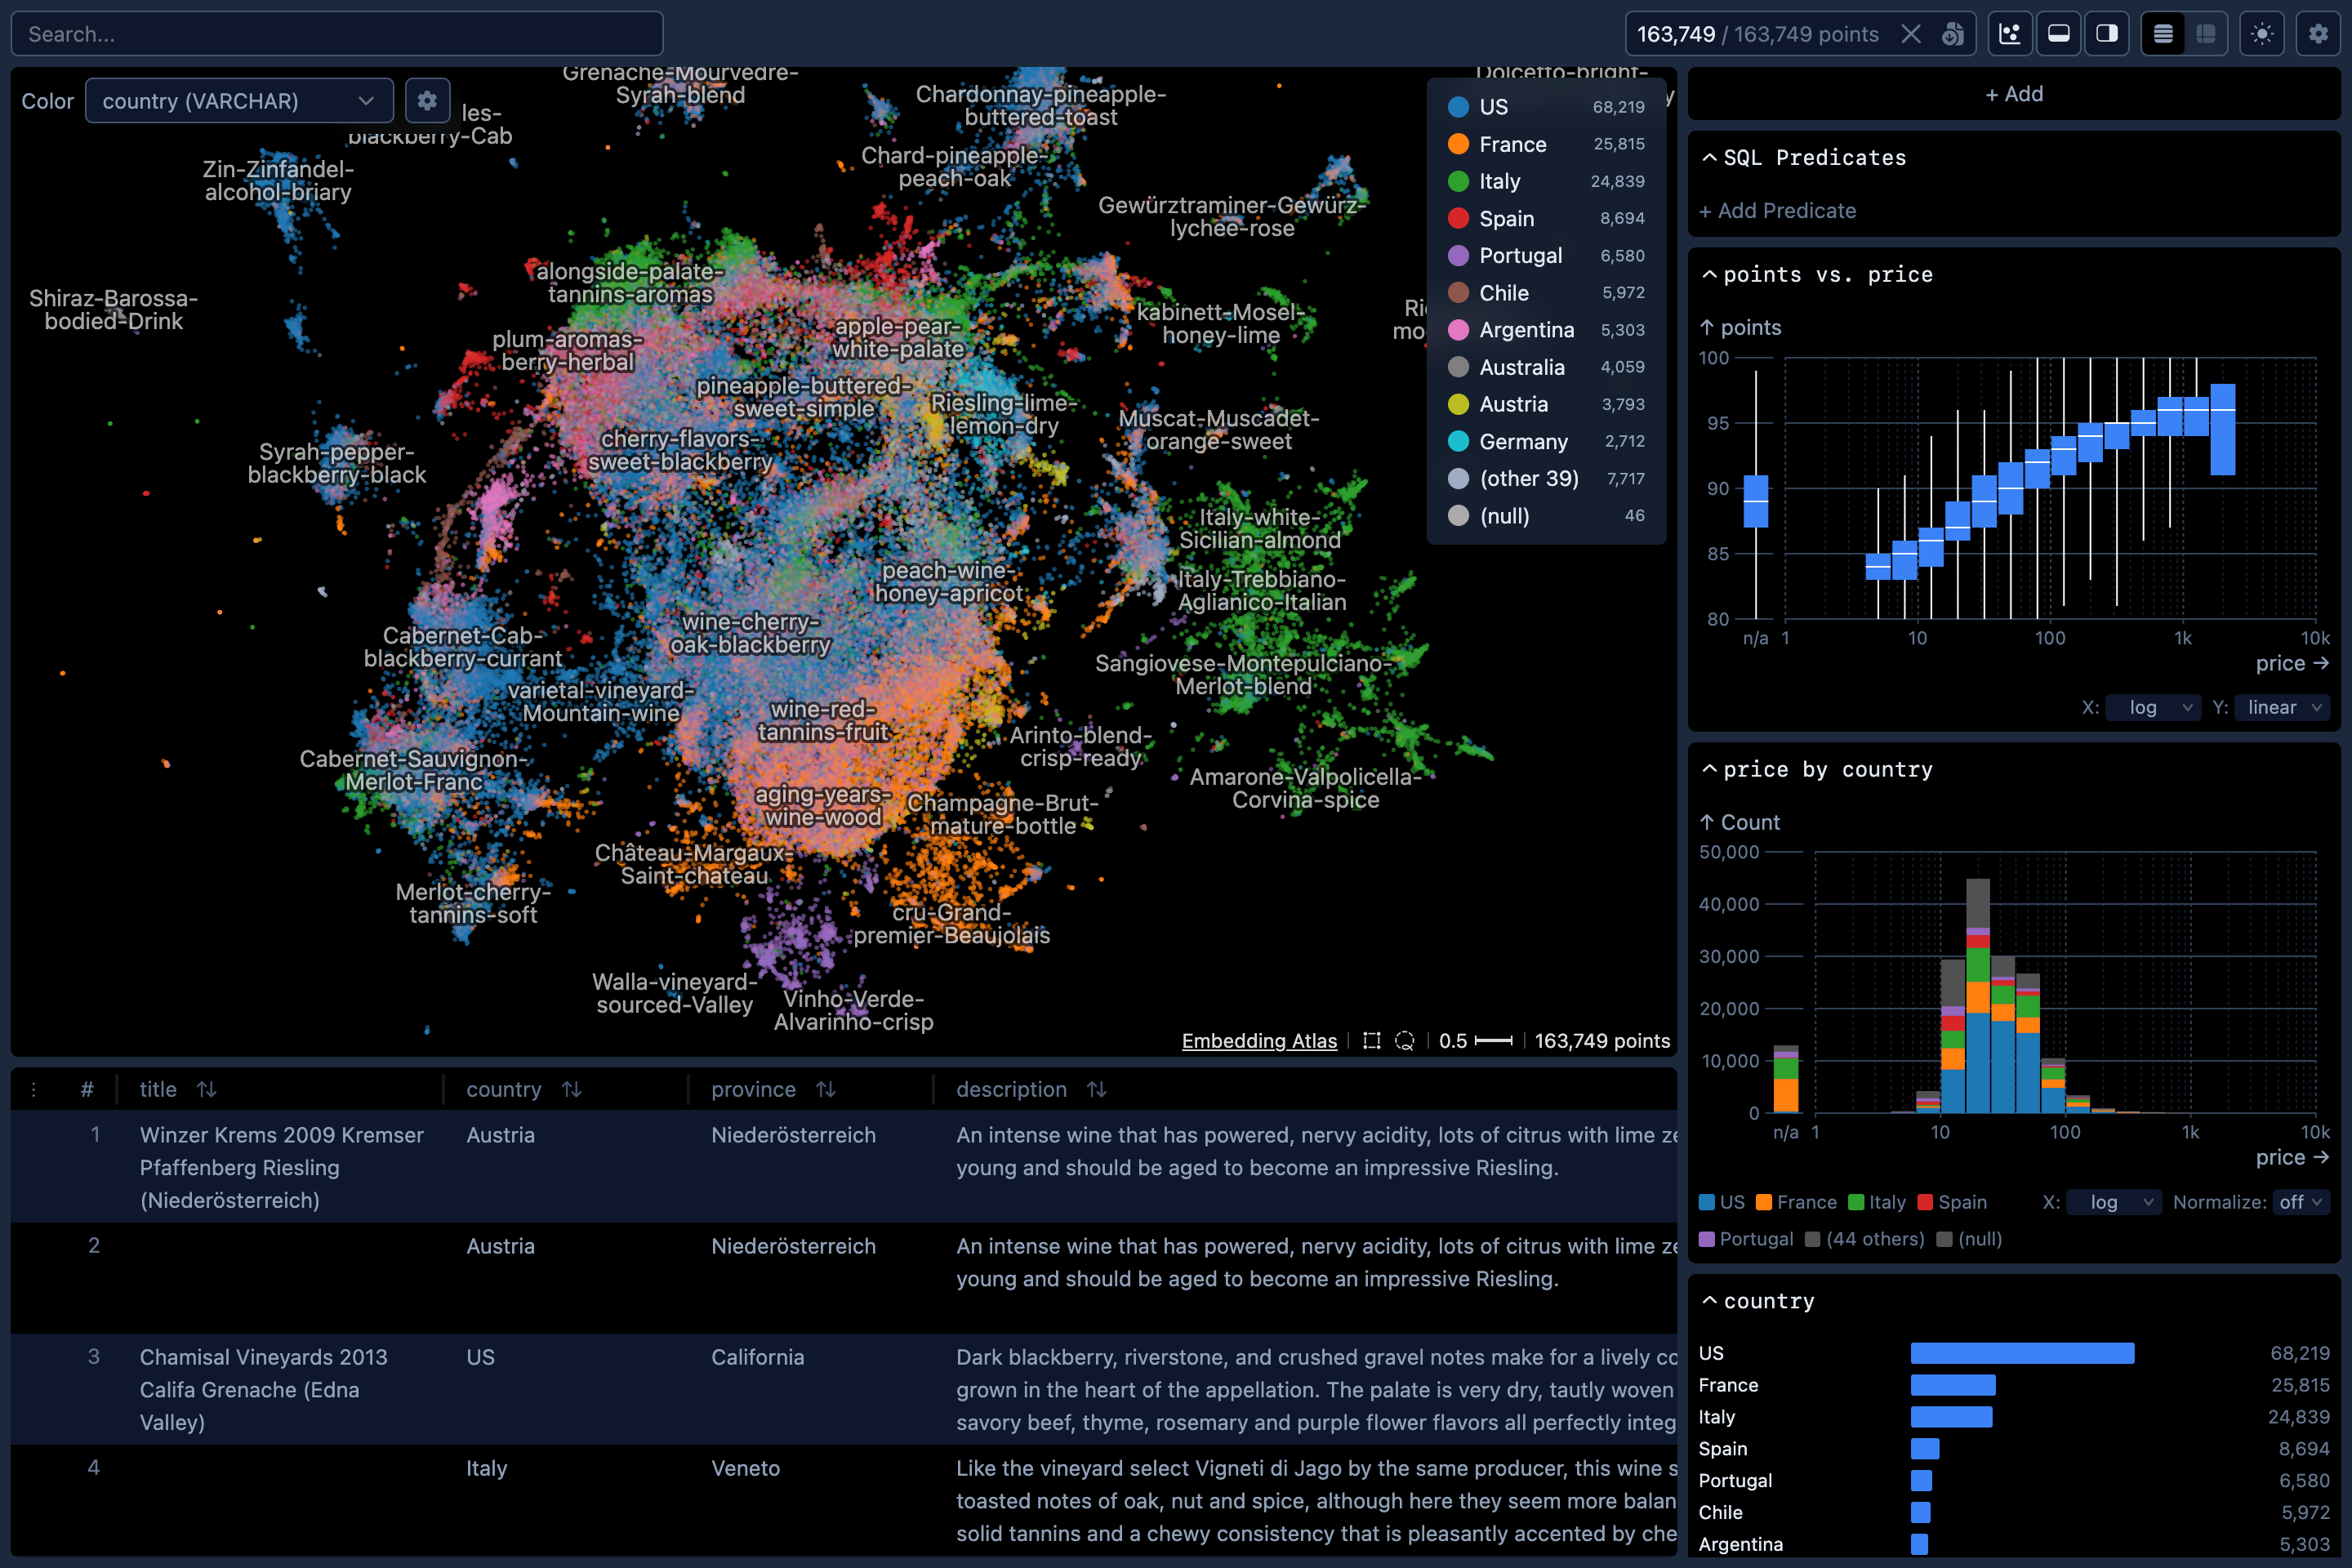
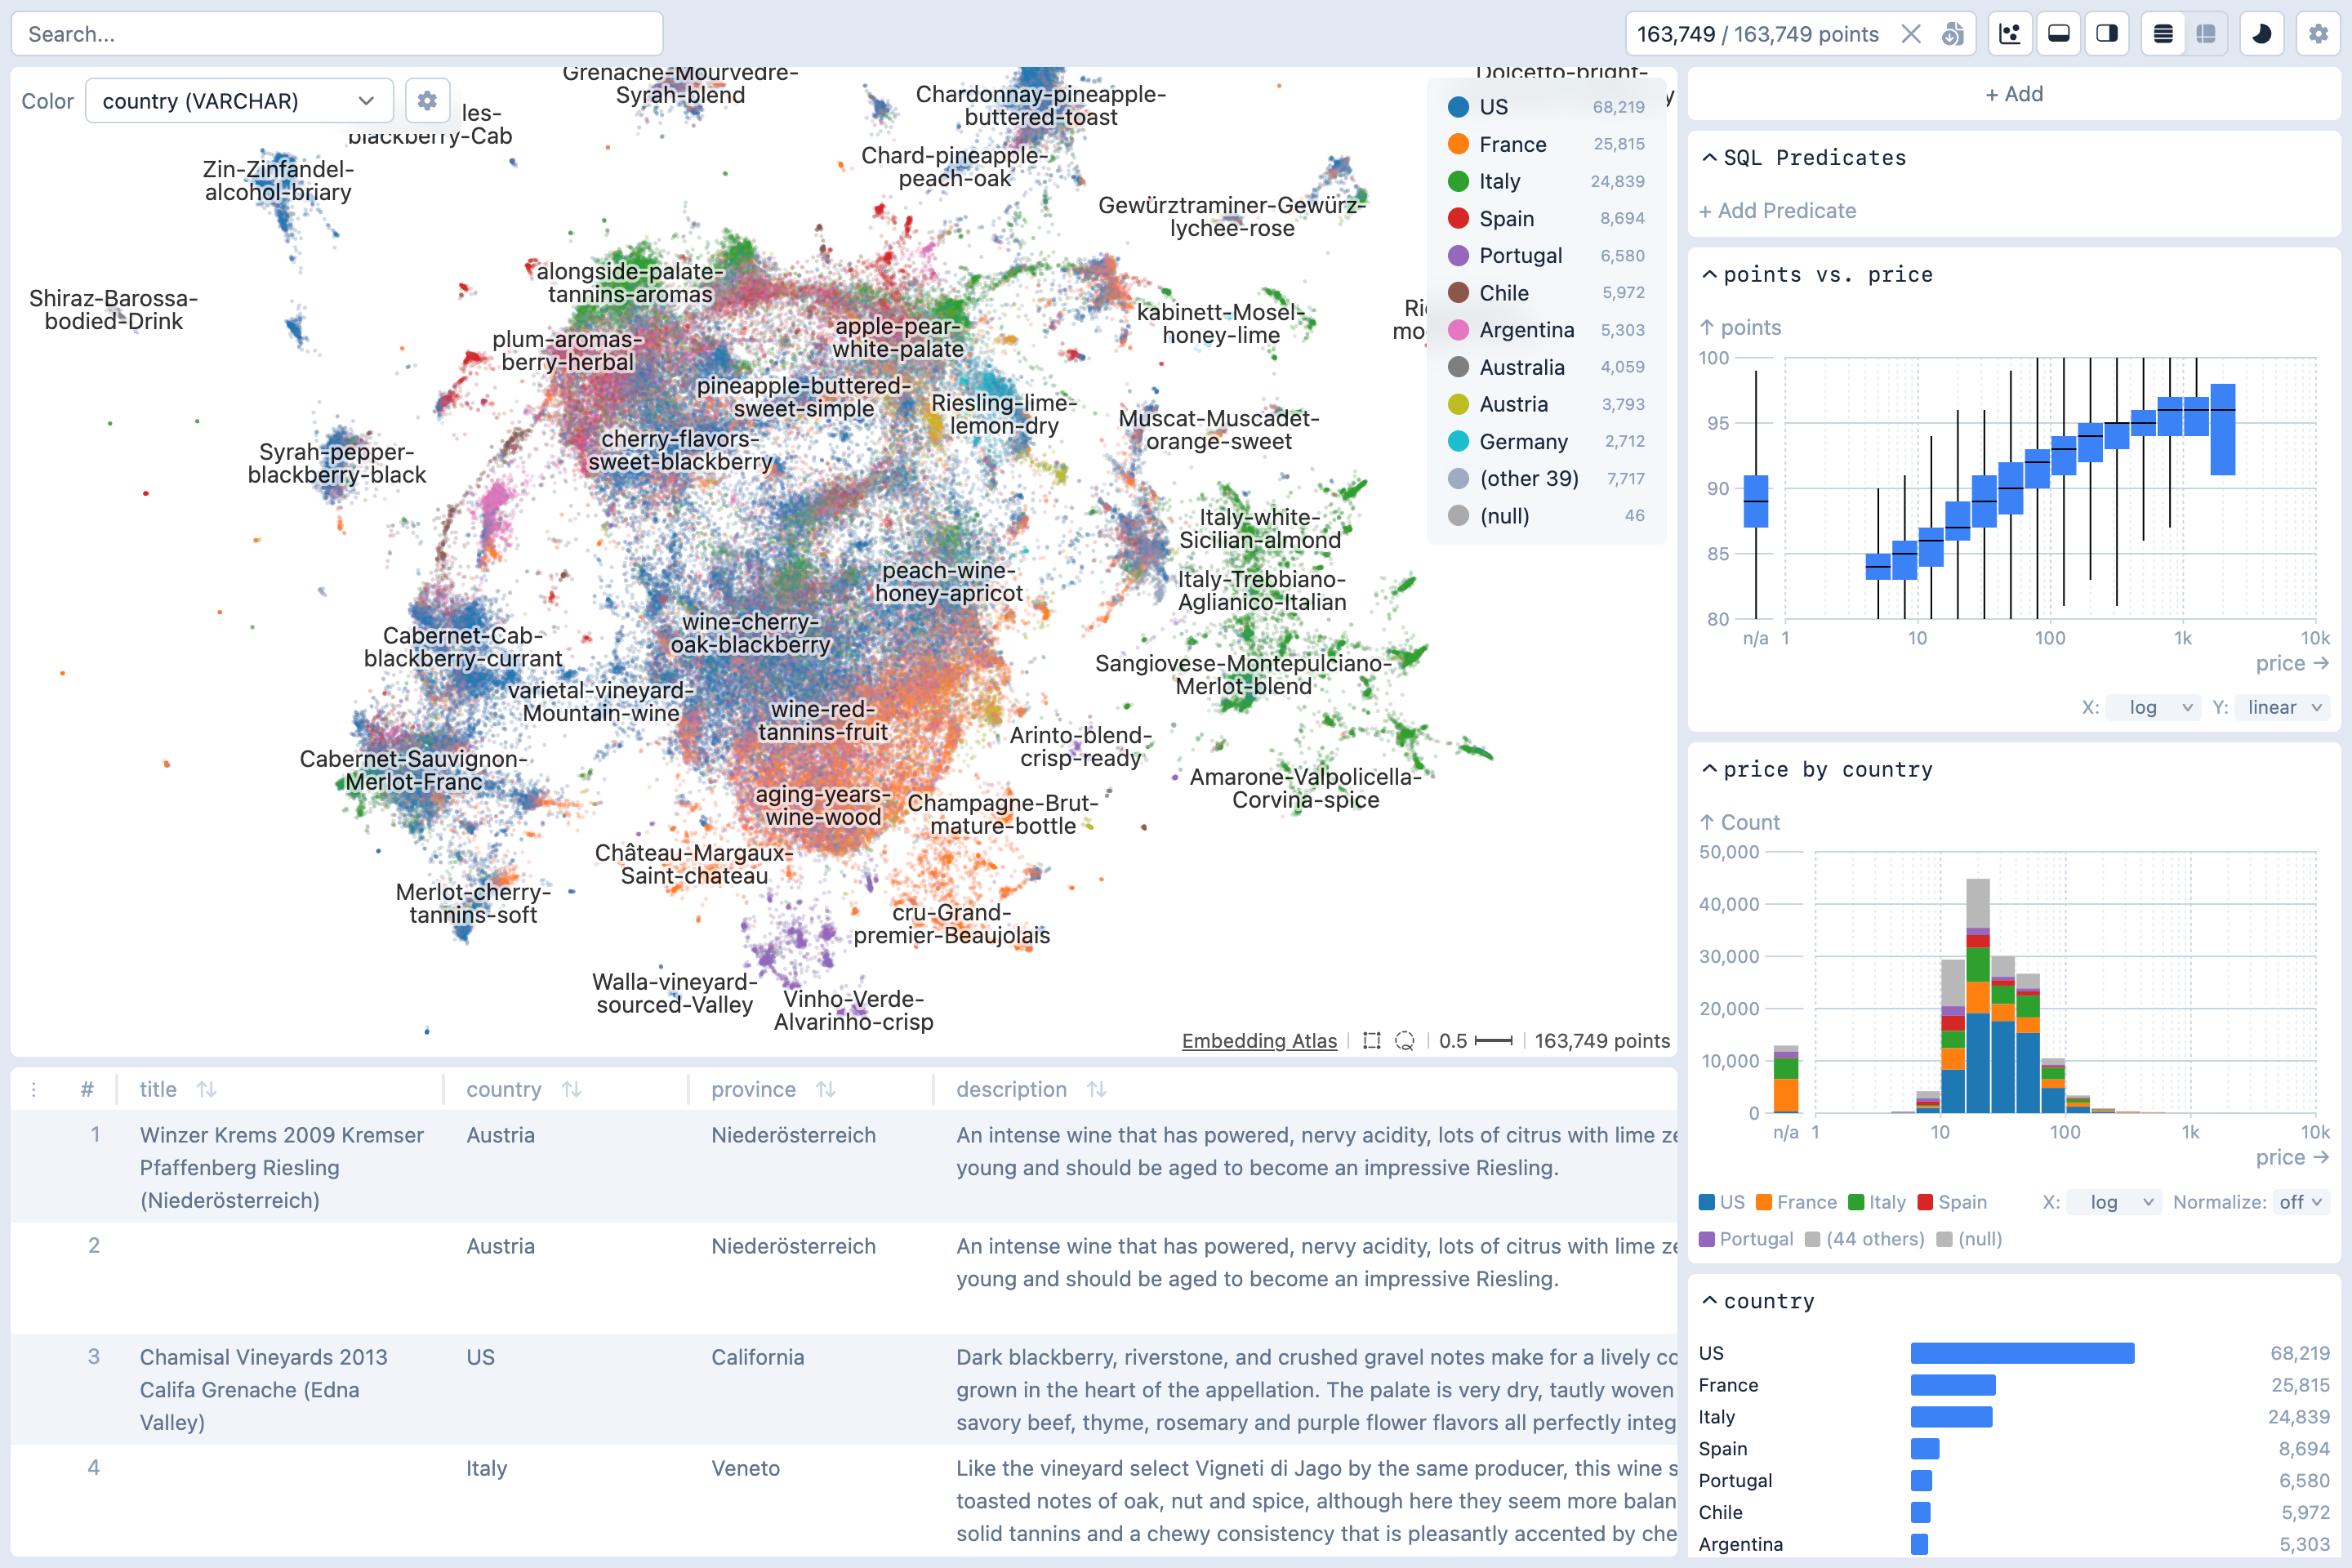
Interactively visualize and navigate overall data structure.
Visualize, cross-filter, and search embeddings and metadata.
🏷️
Interactively visualize and navigate overall data structure.
🔍
Find similar data to a given query or existing data point.
🚀
Render up to a few million points with density contours, powered by WebGPU.
📊
Arrange charts and configure cross-filtering between them. Compose custom charts via a chart spec.
🧩
Built-in viewers for text, image, audio, numeric, categorical, and time columns.
🤖
AI agents can query, chart, and explore your data via Model Context Protocol.