Every issue of The American Healthcare Conundrum identifies one fixable, quantifiable problem in the US healthcare system, builds the data case, and recommends a specific policy fix. All code and data are open-source.
SAVINGS TRACKER
Target: ~$3T US-Japan per-capita gap
Japan: highest life expectancy, lowest
infant mortality in OECD, ~half US cost

Full scale: $0 ──────────────── $3T
            █████░░░░░░░░░░░░░  11.9%
            ↑ $356.6B identified

Zoomed (first $500B):
 #1  ░        $0.6B   OTC Drug Overspending
 #2  ███      +$25.0B  Drug Pricing
 #3  ██████████  +$73.0B  Hospitals
 #4  ████      +$30.0B  PBM Reform
 #5  ████████████████████████████  +$200.0B  Admin Waste
 #6  ████      +$28.0B  Supply Waste
     ─────────────────────────────────────────────
     Total: $356.6B · $2,643.4B remaining
A cargo container full of IV tubing, surgical gloves, and patient monitors leaves a Houston hospital loading dock on a Tuesday morning. The supplies are unopened. Many are new. The container is headed to Bolivia.
This scene plays out in every major US city, every week. American hospitals systematically generate millions of dollars in excess inventory. Some of it gets shipped overseas. Some gets landfilled. Hospitals discard it all the same way because the cost of warehousing or reselling is higher than the cost of the supplies themselves.
The math is broken. And it is getting worse. Hospital supply spending hit $177.6 billion in FY2024, up 4.1 percent from $170.9 billion in FY2023, while total discharges fell 1.8 percent. Per-discharge supply costs rose 10.4 percent in a single year. With medical device tariffs projected to raise costs another 15 percent in 2026 (82 percent of healthcare experts surveyed by IQVIA and the UNC Kenan Institute expect increases of that magnitude), hospitals that have not addressed supply efficiency are running out of time.
We downloaded the raw CMS Hospital Cost Report (HCRIS) data for fiscal year 2023 and computed, for every hospital in the country, the per-discharge cost of medical supplies, implantable devices, and drugs charged to patients. No published study has done this at national scale with case-mix adjustment. The dataset covers 5,480 hospitals and 142.3 million discharges. The analysis code is open-source on our GitHub.
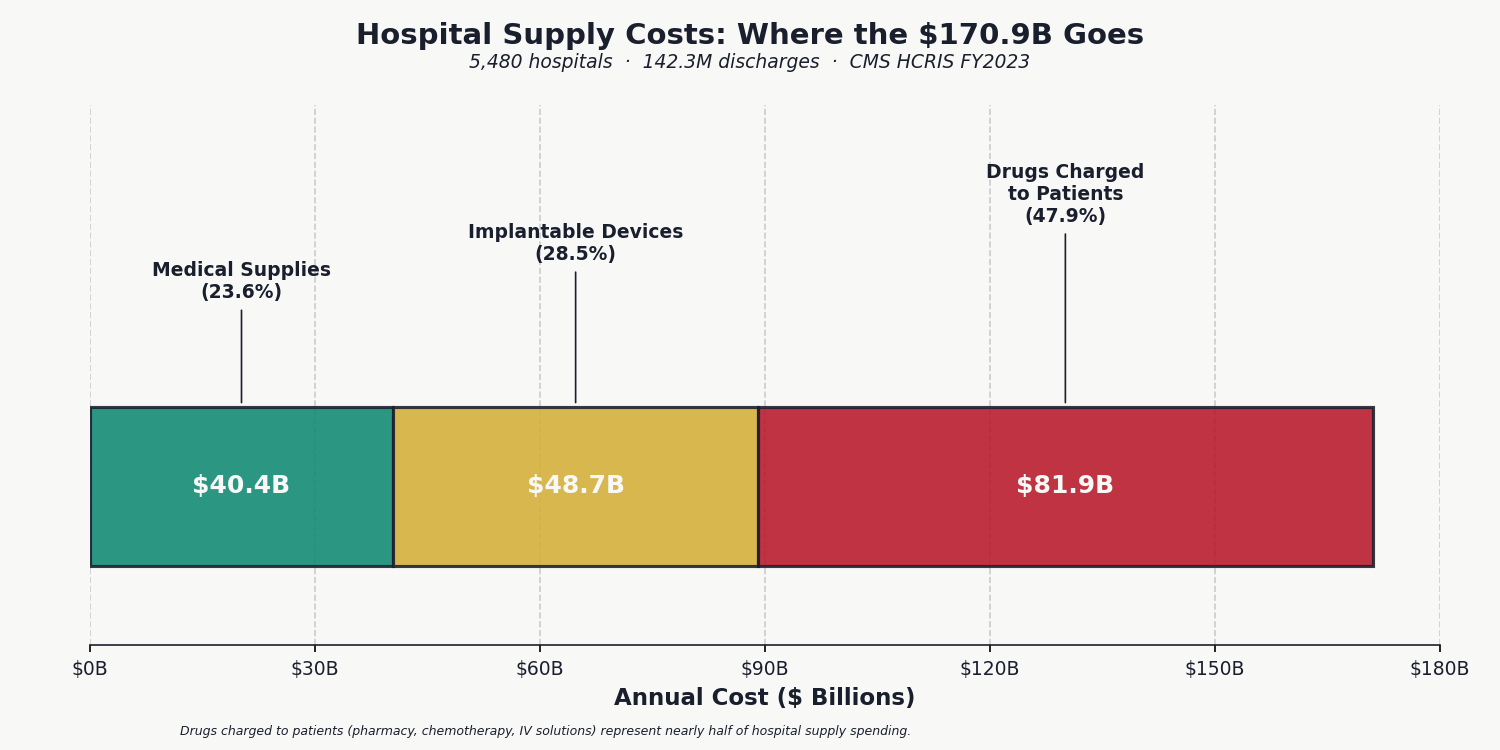
The national total: $170.9 billion, split across medical supplies ($40.4 billion), implantable devices ($48.7 billion), and drugs charged directly to patients ($81.9 billion). The national average is $1,941 per discharge. But the average conceals the real finding: massive, unexplained variance.
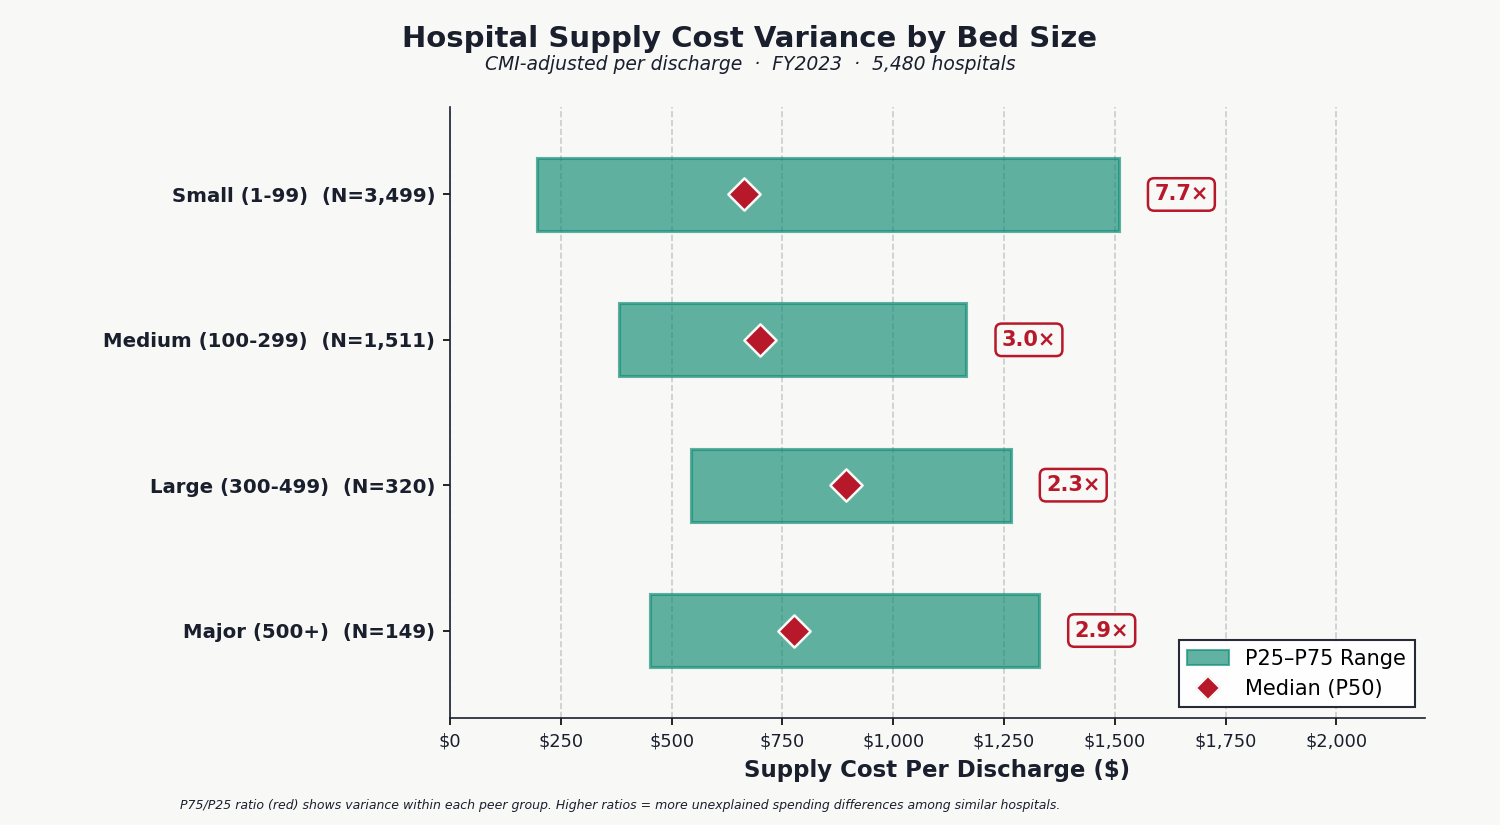
We adjusted every hospital's per-discharge supply cost for case-mix index (so a trauma center treating complex cases isn't penalized for higher supply use) and stratified by bed size (so community hospitals are compared to community hospitals, not academic medical centers). The result: two medium-sized hospitals treating patients of similar complexity spend $382 versus $1,165 per discharge, a 3.0x difference at the 25th and 75th percentiles. For small hospitals under 100 beds, the gap widens to 7.7x.
This variance is not explained by patient acuity (the data is CMI-adjusted), geography, or hospital ownership. It is not correlated with better quality metrics or patient outcomes: high-spending hospitals do not show systematically better surgical complication rates, readmission rates, or patient satisfaction scores. It is unexplained waste.
Teaching status is not the explanation either. We identified 1,110 teaching hospitals (those reporting intern/resident FTEs on CMS Form 2552-10) and compared them to 4,370 non-teaching hospitals within each bed-size group. Among medium-sized hospitals (100 to 299 beds), teaching facilities spend only 10 percent more per CMI-adjusted discharge than non-teaching peers. Among the largest hospitals (500 or more beds), teaching hospitals actually spend 8 percent less. The variance exists within every category, not between them. Even among teaching hospitals alone, the P75/P25 ratio is 12.2x, with $10.2 billion in addressable waste internal to that group.
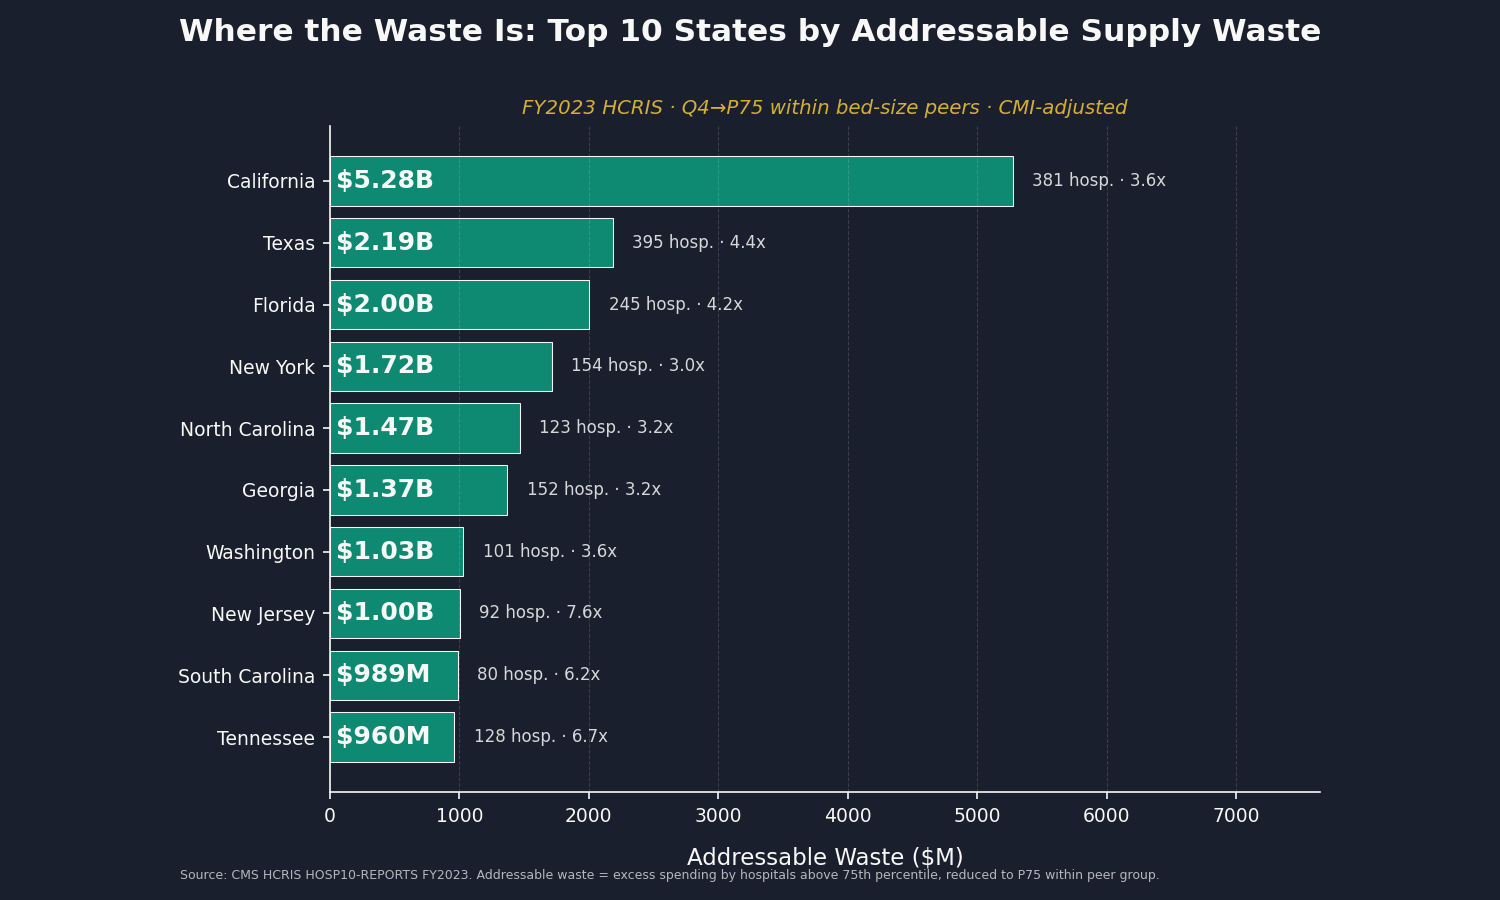
No published source ranks states by hospital supply cost variance. We computed one. California's hospitals account for $5.3 billion of the $28 billion in addressable waste, followed by Texas ($2.2 billion), Florida ($2.0 billion), and New York ($1.7 billion). The widest per-discharge variance is in Louisiana (20.6x between the 25th and 75th percentile hospitals) and Arizona (14.0x), suggesting acute procurement inefficiency in those states.
The top ten states by total addressable waste account for $17.0 billion, or 60 percent of the national total. The full 50-state ranking, with hospital counts, variance ratios, and waste estimates, is published on our GitHub.
We downloaded the newly released FY2024 HCRIS data and ran the identical analysis. The results: 5,261 hospitals, $177.6 billion in total supply spending, and a mean per-discharge cost of $2,144 (up from $1,941 in FY2023). The P75/P25 variance ratio was essentially unchanged at 4.9x, down from 5.0x. The gap between efficient and inefficient hospitals has not closed. Updated addressable savings: $28.9 billion (FY2024 Q4 to P75 by state).
Florida's addressable waste grew by $675 million in a single year (from $2.0 billion to $2.7 billion). Ohio's grew by $345 million. The variance is not self-correcting.
Layer One: Procurement Inefficiency
Group Purchasing Organizations (GPOs) negotiate supply contracts on behalf of hospitals in exchange for administrative fees. The business model is simple: GPOs earn 1 to 3 percent of contracted volume. This creates a perverse incentive: GPO revenue is higher when contracted prices are higher.
Research from 2025 shows that 14 to 50 percent of spending inefficiency exists within GPO tier structures. Hospitals often fail to achieve their negotiated best prices, even after the GPO has secured them. And physician preference items (specific implants, sutures, or devices that surgeons demand) bypass GPO contracts entirely. Surgeons override price negotiation in the operating room, 40 to 60 percent of the time.
Layer Two: Operating Room Waste
Surgical suites generate waste at industrial scale. Studies of preference card bloat and over-ordering show that 13 to 20 percent of surgical supply costs are pure waste. A standardization program at UCSF reduced supply costs 6.5 percent in a single year through cost awareness alone. When hospitals mandate standardized preference cards for common procedures, costs fall 16 to 20 percent without affecting patient outcomes.
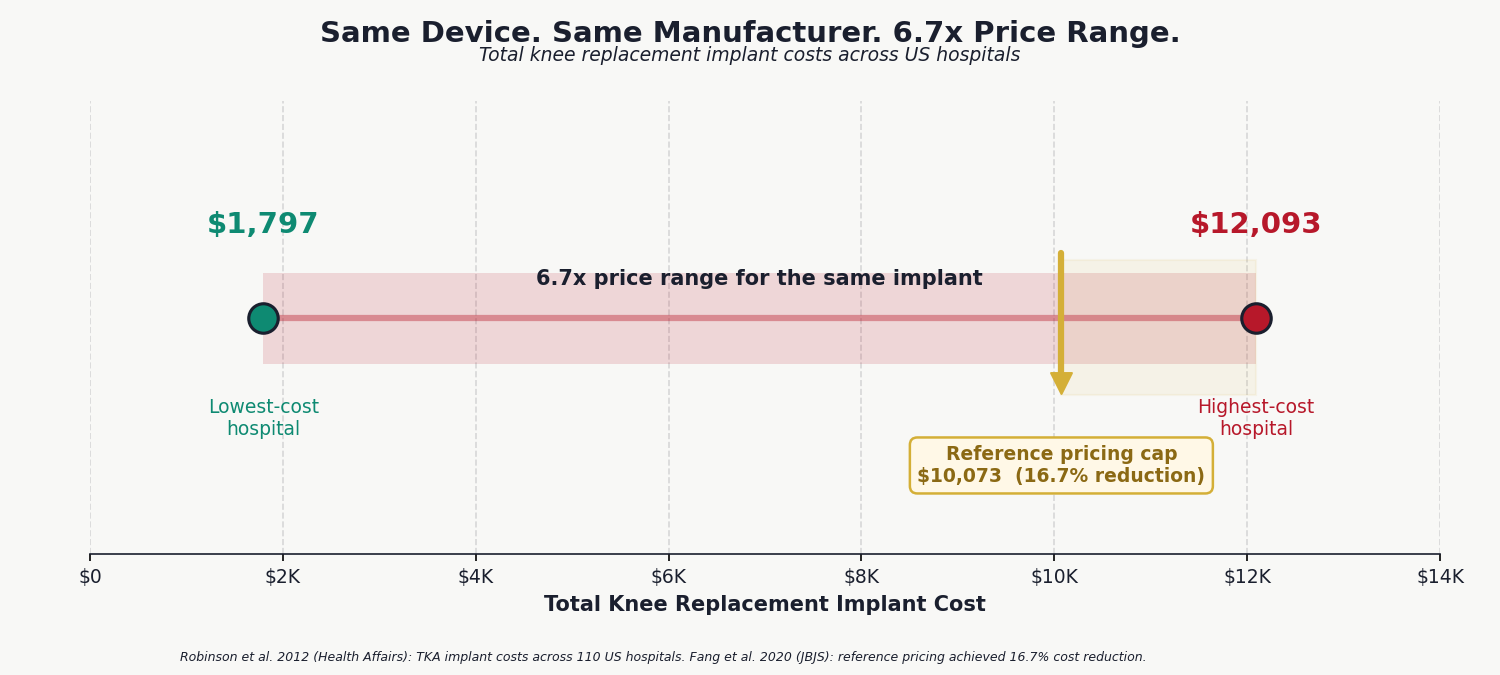
Implant pricing creates an additional layer of waste. The same total knee replacement implant costs $1,797 at one hospital and $12,093 at another. That is a 6.7× price variance for an identical device from an identical manufacturer. Hospitals with reference pricing programs for implants achieve 16.7 percent cost reductions.
Layer Three: Expiration and Disposal
The FDA's Shelf Life Extension Program (SLEP) found that 90 percent of medications remain stable and effective 5.5 or more years beyond their labeled expiration date. The military uses this data to extend drug expiration dates, saving approximately $2.1 billion per year. Hospitals do not.
US expiration dating regulations are rigid. When a medication's labeled expiration date arrives, hospitals dispose of it regardless of remaining stability. A drug worth $100 per unit, sitting on a shelf and fully functional, becomes waste because of a calendar date. The same goes for all supplies: they are removed because of a calendar date and because the hospital may lose a certification if expired items are found on site.
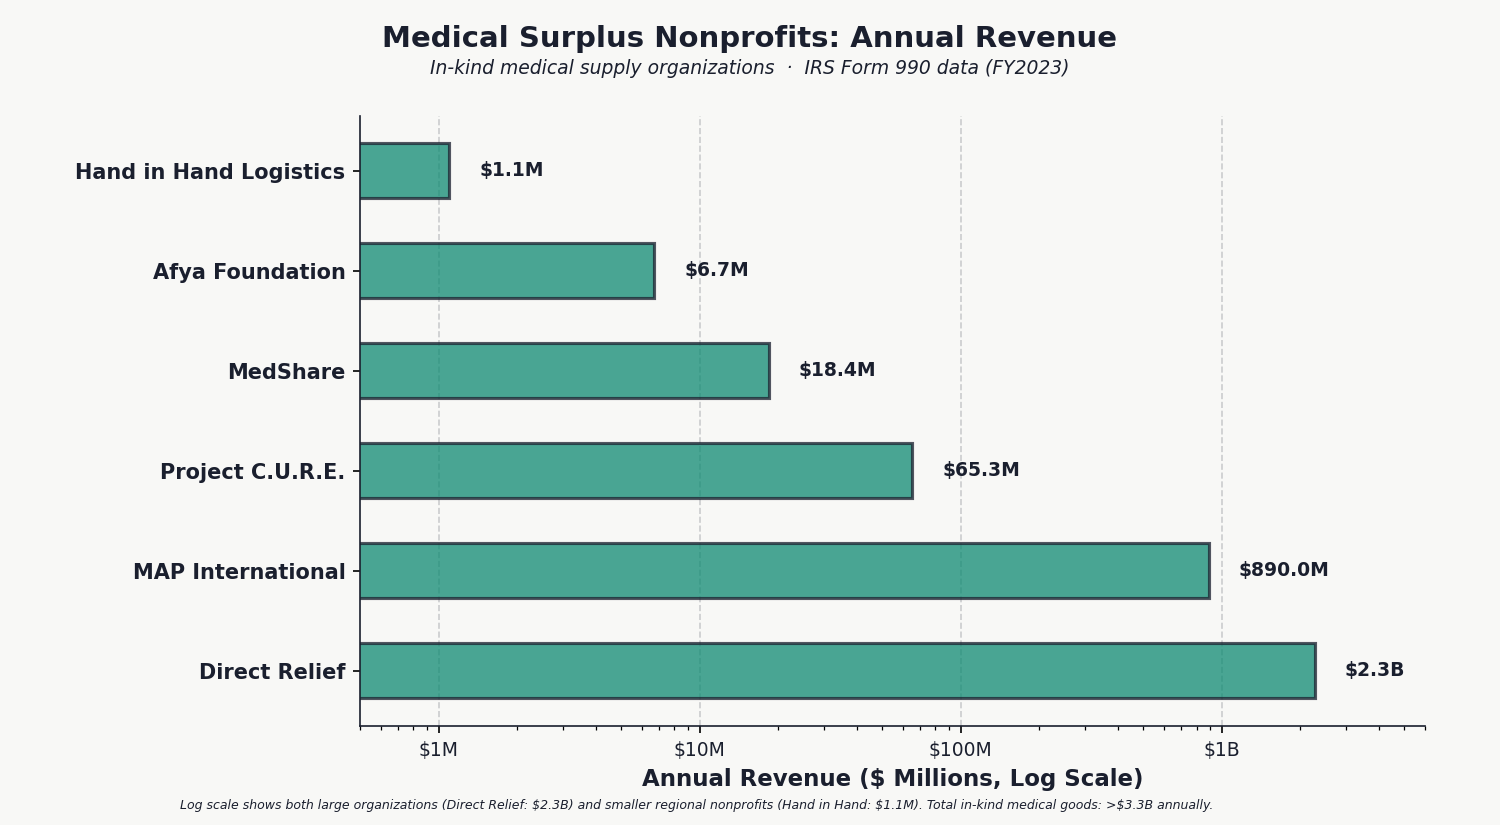
That waste feeds into a massive ecosystem of medical surplus nonprofits that collect donations from hospitals and ship them overseas. Direct Relief, a Santa Barbara nonprofit, receives $2.1 billion in donated medical goods annually. Project C.U.R.E., in Denver, ships 200 or more containers per year to 135 countries. Afya Foundation in New York processes thousands of pounds of hospital surplus weekly. Functional, usable inventory that hospitals have decided to discard rather than store or resell.
Medical surplus nonprofits process over $3.3 billion per year in hospital supply donations. We built a second original dataset by parsing IRS e-filed Form 990 XML bulk downloads and extracting Schedule M data (Line 20: Drugs & Medical Supplies) for every nonprofit in the country. No published source aggregates this data nationally. In just four months of filings, we identified 620 organizations receiving $1.4 billion in donated medical supplies. Extrapolating to a full year and including Direct Relief's $2.14 billion pharmaceutical channel, the total is in the range of $3.5 to $5 billion annually.
This is the visible tip of a much larger waste iceberg. If hospitals are donating $3 billion in excess supplies annually, it means they are purchasing and discarding $3 billion more than they use. And that is only what gets funneled into formal nonprofit channels. More goes directly to landfills.
Dean Buckner, who works with multiple medical repurposing nonprofit groups in the United States, including Afya Foundation, Mano a Mano, Stand With Ukraine MN, and Hand in Hand Logistics, reports: "Organizations taking in donated medical supplies exist in almost every large US city. Hospitals donate truckloads of supplies that are perfectly good. The supply never runs out."
The question is not whether hospitals have excess. The question is whether they should be generating that excess in the first place.
The companies profiting from hospital supply waste are not the hospitals themselves. They are the intermediaries: group purchasing organizations that collect percentage-of-sales fees on every contract, and distributors that move volume at thin margins across an inflated price base. Their revenue grows when prices stay high.
Who Profits: Premier Inc. (PINC, private since November 2025)
FY2024 Revenue: $1.0B | Gross Margin: 73% | Member Hospitals: 4,250+ | Contracted Purchasing Volume: $87B
This issue's mechanism: Premier's GPO model collects administrative fees of 1 to 3 percent on $87 billion in contracted purchasing volume. Revenue is higher when contracted prices are higher, creating a structural conflict of interest: the organization negotiating prices on behalf of hospitals is paid a percentage of the prices it negotiates. Premier was taken private by Patient Square Capital in November 2025 for $2.6 billion, reducing public financial transparency.Who Profits: Cardinal Health (CAH)
FY2025 Revenue: $222.6B | Medical Products Segment: $12.6B | Net Margin: 0.68% | CEO Comp (Jason Hollar): $18.98M
This issue's mechanism: Cardinal Health distributes medical supplies and equipment to hospitals at thin margins on massive volume. The company's $12.6 billion medical products segment moves supplies through a distribution chain where prices are set by GPO contracts. Thin margins on high volume means Cardinal benefits from volume growth, not price reduction. The company has no financial incentive to help hospitals reduce supply consumption.Who Profits: Owens & Minor (OMI)
FY2024 Revenue: $10.7B | CEO Comp (Edward Pesicka): $10.7M | Status: Actively divesting hospital supply segment
This issue's mechanism: Owens & Minor distributes medical supplies and provides supply chain management services to hospitals. The company is actively divesting its hospital supply segment due to structural margin pressure, an implicit acknowledgment that the economics of hospital supply distribution are unsustainable at current efficiency levels. The divestiture does not reduce hospital supply costs; it transfers the distribution function to other intermediaries.
Sources: Premier Inc. 10-K FY2024 (last public filing before privatization); Cardinal Health 10-K FY2025 (SEC EDGAR); Owens & Minor 10-K FY2024 (SEC EDGAR); Patient Square Capital acquisition announcement, November 2025.
The policy interventions are proven and known.
Reference Pricing for Implantable Devices: Hospitals using reference pricing programs for joint replacements, cardiac devices, and stents achieve 16.7 percent cost reductions without affecting clinical outcomes. A reference price sets the maximum reimbursement for a device category. Surgeons retain choice within the category, but cost overages come from the hospital's margin, not the patient's pocket. This should be standard Medicare practice, not optional.
GPO Fee Transparency: Require GPOs to disclose administrative fees as a percentage of contracted volume, publish them on their websites, and allow hospitals to audit whether they are achieving negotiated best prices. Sunlight is the first disinfectant. Right now, hospital CFOs often do not know what their GPO is charging them.
Operating Room Supply Standardization: Require hospitals to standardize preference cards for the 50 most common surgical procedures. Clinical evidence shows this reduces costs 16 to 20 percent without compromising outcomes. Large hospital systems like Kaiser have already done this internally. It should be a baseline expectation.
Expiration Date Reform: Allow hospitals to extend expiration dates on medications for which FDA SLEP data shows continued stability. A regulatory pathway already exists. Hospitals are simply not using it because the cultural norm is to discard on the labeled date. A single CMS guidance document could shift that practice. For disposable supplies, a parallel standard for expiration should be developed, along with minimum packaging standards ensuring that supplies remain sterile and functional for at least five years.
National Supply Cost Benchmarking: Make the detailed HCRIS supply cost data publicly accessible in user-friendly format. When hospitals can see how their supply spending compares to peer institutions, the variance narrows. Transparency is not a panacea, but it is a proven starting point.
These fixes require action from multiple authorities: CMS (reference pricing, SLEP reform, benchmarking), the FTC (GPO market conduct review), state legislatures (hospital supply transparency laws), and individual hospital boards (preference card standardization).
The savings come directly from our HCRIS analysis. We computed, for each bed-size group, how much national spending would decline if every hospital above the 75th percentile were brought down to that benchmark within its peer group. The answer: $28.5 billion per year. If above-median hospitals were brought to the median: $58.9 billion. These are conservative estimates because they only compare hospitals to their own peers, not to an external benchmark. The full dataset (5,480 hospitals, 22 columns) is published on our GitHub for independent verification.
Issue #7: The GLP-1 Gold Rush. Ozempic, Wegovy, Mounjaro, and Zepbound are the fastest-growing drug class in history. US spending reached $71.7 billion in 2023 and is projected to exceed $100 billion by 2028. US prices are 3 to 5 times higher than international peers. The Medicare GENEROUS Model launches April 1, 2026, covering GLP-1s for obesity in beneficiaries. We will model the cost impact and identify the quantitative edge that differentiates this analysis from the saturated coverage of weight loss drugs.
All analysis is published openly on GitHub (https://github.com/rexrodeo/american-healthcare-conundrum). If you find errors, or if you have data or sources we should consider, submit an issue or a pull request. This series only works if the numbers are right.
Forward this to a colleague who works in hospital administration, healthcare finance, or supply chain management. They will recognize the waste immediately.
Sources: CMS HCRIS HOSP10-REPORTS FY2023 and FY2024 (Worksheets A, S-2, S-3); IQVIA/UNC Kenan Institute 2026 (medical device tariff hospital cost impact survey); Zygourakis et al. 2017, UCSF (operating room supply waste and cost awareness intervention, J Neurosurg); Chasseigne et al. 2018 (surgical supply waste meta-review, World J Surg); Guzman et al. 2015 (laparoscopic cholecystectomy preference card standardization, JACS); Koyle et al. 2017 (pediatric urology OR standardization, J Pediatr Urol); Robinson et al. 2012 (implant cost variance analysis, Health Affairs); Fang et al. 2020 (reference pricing for total knee arthroplasty, JBJS); Letchford et al. 2014 (physician preference items and surgical supply costs); Kim et al. 2024 (hospital bargaining power and GPO savings, Management Science); Yang et al. 2025 (GPO tier structure spending inefficiency, Production & Operations Management); Burns & Lee 2008 (GPO administrative fee conflict of interest); FDA Shelf Life Extension Program (SLEP) / Lyon et al. 2006 (medication stability testing); Cantrell et al. 2012 (decades-past-expiration drug potency, Arch Intern Med); Cohen 2005 (device manufacturer forced obsolescence, BMJ); Direct Relief Form 990 FY2023 (IRS TEOS); Project C.U.R.E. Form 990 FY2023; MedShare Form 990 FY2023; Afya Foundation Form 990 FY2023; IRS Schedule M Drug & Medical Supplies data extraction (nonprofit e-file XML, 620 organizations identified, 4-month sample = $1.4B); Premier Inc. investor relations 10-K filings; Cardinal Health 10-K FY2025; Owens & Minor 10-K FY2024.
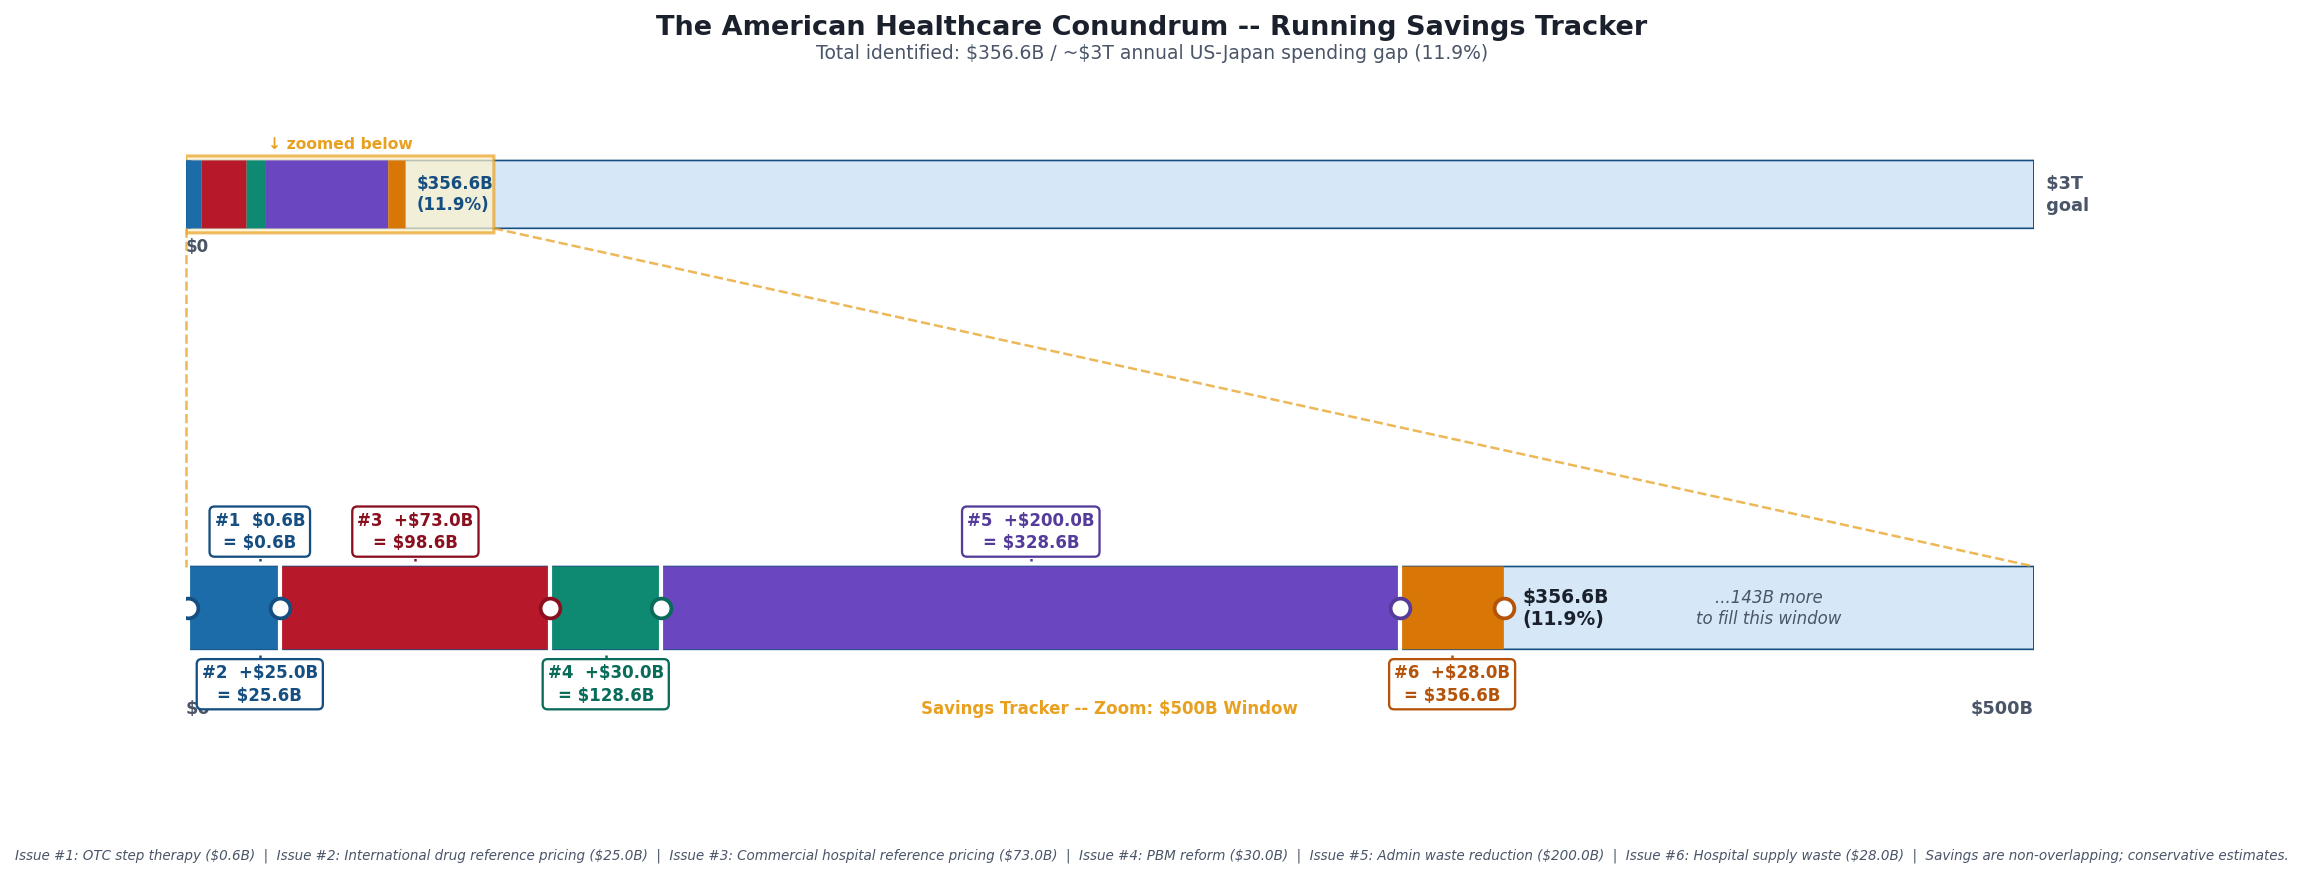
Savings Tracker: $356.6 Billion and Counting
Six issues. Six distinct mechanisms generating excess spending in the US healthcare system.
Issue #1 — OTC Drug Overspending: $0.6B/year
Issue #2 — Drug Reference Pricing (brand-name drugs vs. international peers): $25.0B/year
Issue #3 — Hospital Commercial Reference Pricing: $73.0B/year
Issue #4 — PBM Reform: $30.0B/year
Issue #5 — Administrative Waste (hospital operational variance + multi-payer billing complexity + prior authorization compliance): $200.0B/year
Issue #6 — Hospital Supply Waste (within-peer procurement variance, CMI-adjusted): $28.0B/year
Running total: $356.6 billion per year, 11.9% of the $3 trillion annual gap between US and Japanese per-capita healthcare spending.
The $28 billion for Issue #6 is the conservative scenario: moving every hospital above the 75th percentile down to the 75th percentile within its bed-size peer group, after adjusting for case-mix index. The aggressive scenario (above-median to median) yields $58.9 billion. Both estimates use only within-peer comparisons, not external benchmarks, and do not overlap with the administrative waste in Issue #5 (which measures overhead cost centers, not supply line items) or the GPO fee extraction planned for Issue #11 (which measures intermediary markup, not hospital-level procurement variance).
The American Healthcare Conundrum publishes when the data is ready. All analysis uses publicly available data. Code is open-source. Figures are validated before publication.