I have a weakness for local LLM experiments that sound slightly unreasonable when said out loud.
This one was: can GLM-5.2, a very large sparse MoE model, be made to run on a 64GB Apple Silicon Mac without turning the machine into a swap-powered space heater?
Not run well. Not run like a proper inference server. Just run in a way that is measurable, repeatable, and not based on pretending that a 244GB quantized model somehow fits into 64GB of unified memory.
The current answer is:
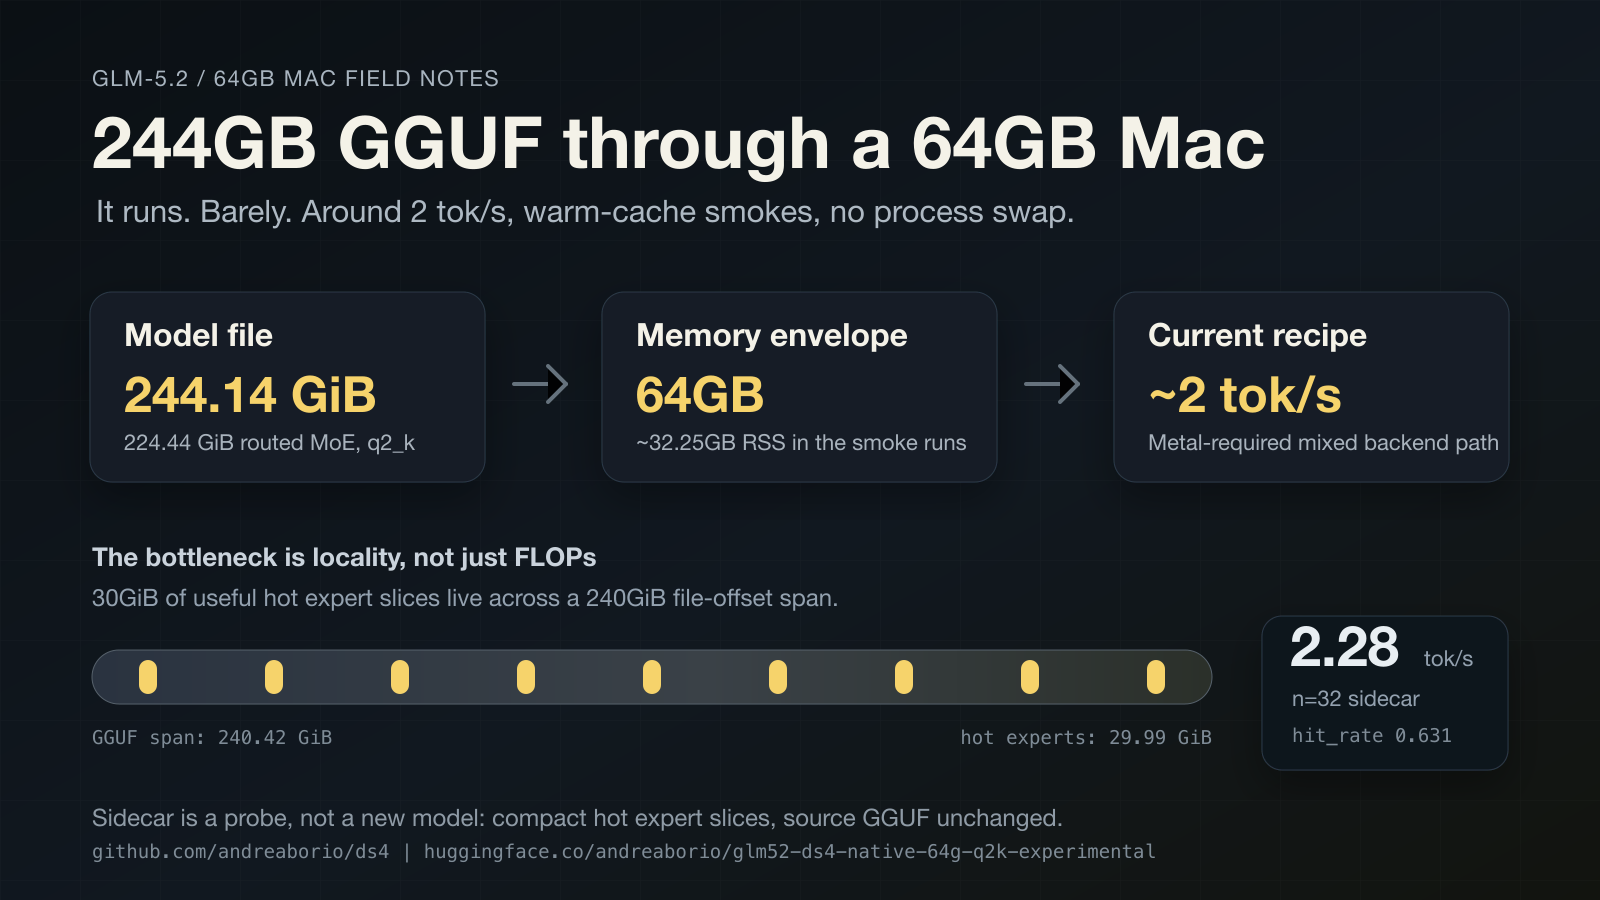
It runs. Barely. Around 2 tokens/s in my warm-cache smokes, with no process swap.
That is not a product experience. It is also not nothing.
The more interesting result is not the speed. The interesting result is where the bottleneck moved once the model stopped immediately falling over.
The runtime is based on antirez/ds4, but this GLM-5.2 work is in my experimental fork and branch: andreaborio/ds4, wip/glm52-metal64-strict-probe.
The model artifact is here: andreaborio/glm52-ds4-native-64g-q2k-experimental. The base model is zai-org/GLM-5.2.
The GGUF was produced by our glm-dsa quantization path on AWS from the public GLM-5.2 safetensors. It is ds4-native. I do not expect this file to be a generic GGUF that llama.cpp or other runtimes can just load.
The machine was a 64GB Apple Silicon MacBook Pro. The model file is about 244 GiB. The routed MoE part alone is about 224 GiB.
So the whole experiment is basically: keep the parts that must be resident in memory, stream the routed experts carefully, and try not to make macOS angry.
First: when I say “Metal-required mixed backend path”, I do not mean “every operation is a pure GPU kernel”.
The measured command uses Metal and an internal strict guard that refuses the run if the required Metal-backed path is not active. But the branch still has host-side scheduling, cache management, and file reads. This is not an upstream-ready “all GLM ops are GPU-backed” implementation.
Second: when I report “0 block I/O”, that is the time(1) process counter on these warm runs. It is not a cold-cache, device-level SSD traffic measurement.
The runtime logs also report miss_pread, which is logical data requested through the expert-loader pread path. Logical pread bytes are not the same thing as “the SSD physically read exactly this many bytes from NAND”.
That distinction matters. This experiment is about file layout, cache policy, and runtime scheduling. It is not yet a storage benchmark.
Sparse MoE models are easy to describe in the happy version.
For each token, you do not use all the experts. You route to a subset. Less compute. Great.
But a file-backed runtime has a different problem: are the things you need near each other on disk, or are you constantly jumping around?
For this GLM-5.2 GGUF, the answer is: the useful expert data is scattered in a pretty annoying way.
The selected hot expert set I tested contains about 30 GiB of useful expert slices. In the source GGUF, those slices span about 240 GiB of file offsets.
The cartoon version is even simpler:
An expert triplet is about 11.8 MiB of useful data, but its gate/up/down tensors can be spread across about 2 GiB of file span.
That is the sentence that made the experiment click for me.
GLM-5.2 is computationally sparse, but from the point of view of this streaming path it is also I/O-diffuse. You save arithmetic, then pay in locality.
The best current recipe is boring in a good way: a flat selected-id hotlist.
Record the experts the model actually selects. Keep a bounded hot set resident. Stream misses narrowly. Do not get clever too early.
The best numbers below also use an optional sidecar pack. This sidecar is not a new model and not a reordered GGUF. It is a compact copy of the hottest expert slices for this experimental ds4 path.
Think of it as a locality probe: “what happens if the hot expert slices are packed in a friendlier shape?”
The answer is: it helps, but not dramatically.
On my machine, with the sidecar:
n=8: 2.52 tokens/s
n=32: 2.28 tokens/s
n=64: 2.01 tokens/s
All three warm runs stayed around 32.25GB max RSS and reported 0 process swaps.
Again, this is not “fast”. This is “alive”.
The cleanest paired comparison is at n=32, using the same binary and the same flat selected-id hotlist.
Without the sidecar, generation was 2.18 tokens/s.
With the sidecar, generation was 2.28 tokens/s.
The cache hit rate stayed the same. The logical pread bytes stayed the same. The gain came from reducing some loader locality overhead, especially begin_load_total.
So I would not headline this as a heroic 1.98 -> 2.28 improvement, even though an earlier run shape did produce a 1.98 tokens/s baseline.
The fair paired headline is smaller and more boring:
2.18 -> 2.28 tokens/s at n=32.
That smallness is actually useful. It says the sidecar confirms the locality hypothesis, but it does not solve the runtime.
At n=64, the sidecar barely moved throughput: 1.99 -> 2.01 tokens/s.
So if you were hoping for “just pack the hot experts and the whole thing gets fast”, this run does not support that. I wish it did. It would have made for a cleaner blog post.
Several plausible ideas lost against the flat selected-id hotlist.
Grouped and co-occurrence hotlists sounded reasonable. They lost.
Preview-generated hotlists sounded reasonable. They lost.
The one I liked most was the packed triplet idea. Since gate/up/down tensors for an expert are scattered, why not read them as one contiguous packed triplet?
It sounds obvious. It was slower in the first variant.
The lesson, at least for this branch, is that fewer reads is not automatically faster. Larger reads can disturb the rest of the runtime schedule enough to lose the advantage.
That is the part I find useful. The failure is pointing at a more specific problem than “SSD streaming is slow”.
I do not think the next useful step is a prettier hotlist.
The next useful step is probably cache policy.
The runtime needs small local metadata that helps it avoid expensive work before the expensive work starts. Per-layer expert priority. Less eviction of experts that are predictably hot. A better bias toward the flat hotlist. Better decisions around mixed layers where the loader begins work that may not pay off.
The direction is less:
group everything harder
and more:
make cheap local decisions before the expensive jump
That is also the part that reminded me of Antirez’s framing around doing less unnecessary expensive work. The hard part is not only “where are the bytes?” It is “can we avoid asking for the wrong bytes in the first place?”
Maybe, if this is your kind of fun.
What would be genuinely useful is not another screenshot of text slowly appearing. The useful test would be the same branch on larger unified-memory Macs, or on machines with stronger cold-cache storage behavior.
I am especially curious about 128GB/192GB Apple Silicon machines and M Ultra systems.
If the same branch jumps materially there, the 64GB result is a constrained-machine story. If it does not, the bottleneck is probably deeper in the scheduling/cache policy path.
Both outcomes are useful.
The code branch and model artifact are public. I would keep exact commands, checksums, and reporting checklist in a separate appendix rather than pasting them into the middle of the article. They are important, but they are not the story.
The satisfying version of the story would be:
We made GLM-5.2 fast on a 64GB Mac.
The true version is more useful:
We made GLM-5.2 run on a 64GB Mac without process swap, found a mixed Metal-required streaming recipe around 2 tokens/s, and learned that the hard part is not just keeping enough experts hot. The hard part is deciding which expensive expert work to avoid before the file-backed loader gets involved.
It runs. Barely, honestly, and with the bottleneck now visible.