The only report with sub-category breakdowns for pricing, LTV, conversion, and paywalls – benchmarked against 16,000 apps with $3B in subscription revenue. Filter by category, region, and country.
Get your benchmarks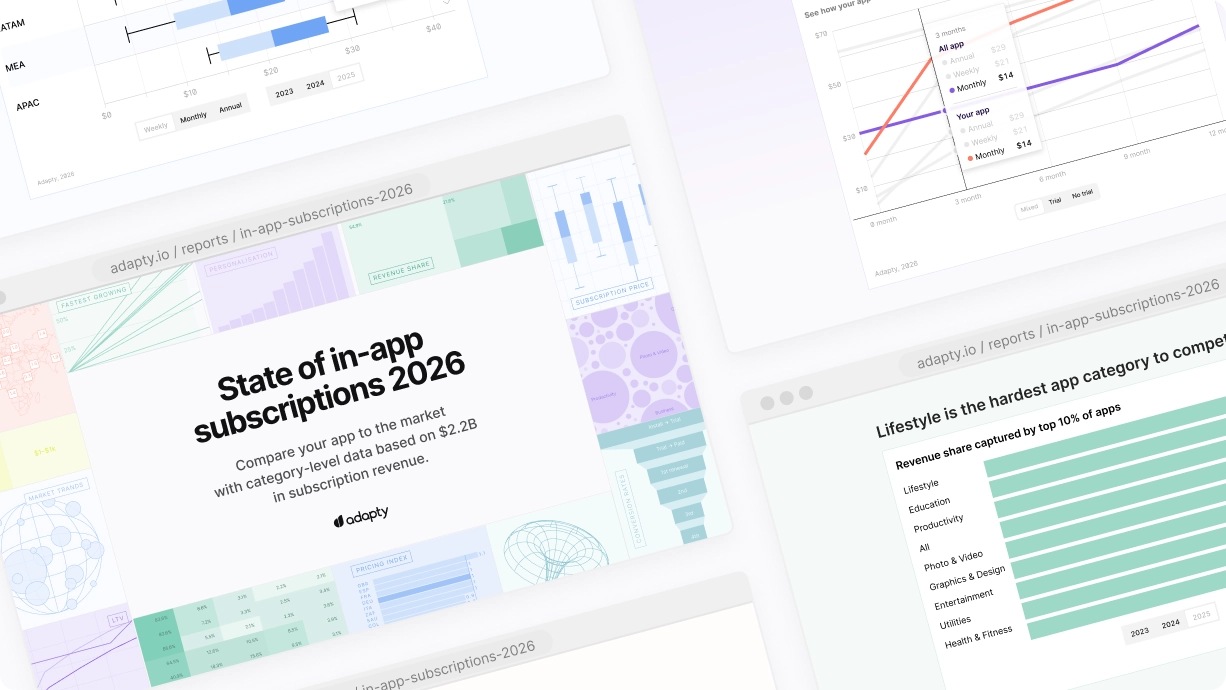
Most subscription reports give you industry averages.
This one gives you category-specific data
What 16,000 apps revealed about subscriptions in 2026
Get your benchmarksExactly what you need to benchmark your app
Market trends
Fastest-growing regions where revenue is shifting
State of AI apps
How AI apps price, convert, and retain subscribers
LTV insights
by category, region, and country
Web paywalls
How web paywalls compare to in-app paywalls
Paywall rankings
105K paywalls analyzed for experiment impact
iOS vs. Android
Benchmark breakdown by platform
Conversion benchmarks
What drives conversion — and what doesn't

FAQ
Which app categories make the most subscription revenue in 2026?
Utilities, Entertainment, and Productivity lead in weekly subscription revenue share — with Utilities at 73.6%. Health & Fitness is the exception: the only category where annual plans dominate (60.6%). For per-subscriber value, Utilities trial users generate the highest LTV at $68.90 over 12 months. Full category breakdowns are in the report.
How much should I charge for a subscription app?
In 2025, global median prices are $7.48/week, $12.99/month, and $38.42/year. But pricing varies dramatically by category and region. European apps charge 29-39% more than North American ones. Higher prices don’t kill conversion: high-tier weekly plans generate 5.2x more revenue per install than low-tier ones. The report breaks down pricing by category, region, and percentile so you can benchmark against your segment.
What's a "good" conversion rate for a subscription app in 2026?
It depends on your plan type. Weekly plans convert 1.7–7.4x better than annual across all price tiers. For trial funnels, the global average is 10.9% install-to-trial and 25.6% trial-to-paid. Health & Fitness leads trial-to-paid at 35.0%, while Entertainment trails at 19.1%. The report includes conversion benchmarks by category, region, plan type, and price tier.
Weekly, monthly, or annual — which subscription plan performs best?
Weekly plans win on conversion and revenue share — they now generate 55.5% of all app revenue, up from 43.3% in 2023. Weekly+trial is the highest-LTV paywall configuration at $49.27 over 12 months. Monthly plans consistently underperform both weekly and annual at every price tier. The exception is Health & Fitness, where annual dominates with 60.6% of revenue. The right answer depends on your category — the report shows exactly where each plan type wins.
How much money does a subscription app make?
The median app earns $492/month, and 59.3% of subscription apps make less than $1,000 total. Only 7.2% cross $100K. The top 10% capture 94.5% of all subscription revenue — and that concentration is increasing. Apps that run experiments earn 40x more than those that don’t. The report covers revenue distribution, concentration by category, and what separates top-performing apps from the rest.
What should I put on my paywall to maximize conversions?
89.4% of trial starts happen on Day 0 — your first-session paywall is your highest-leverage surface. Weekly plans with a free trial produce the highest 12-month LTV ($49.27), despite starting with the lowest Day 0 LTV. Onboarding paywalls without trials convert at 37.45% but produce the lowest long-term value. Hard paywalls generate 21% higher LTV per subscriber than soft paywalls. The report breaks down placement, trial availability, plan type, and pricing tier to show what works best for your setup.
What is a normal churn rate for a subscription app?
It varies by plan type more than anything else. At Day 380, annual trial subscribers retain at 19.9%, monthly at 14.2%, and weekly at 5.5%. Trial subscribers retain 1.4-1.7x better than direct buyers across all plan types. By category, Utilities leads with 58.1% first-renewal retention while Health & Fitness is last at 30.3%. Region matters less than you’d think — the gap between best and worst region (4.1pp) is dwarfed by the gap between plan types (15pp+). The report includes retention benchmarks by category, region, and billing period.