![Timeline: The March to a Billion Users [Chart]](https://www.visualcapitalist.com/wp-content/uploads/2016/02/the-race-to-1-billion-users-chart.png)
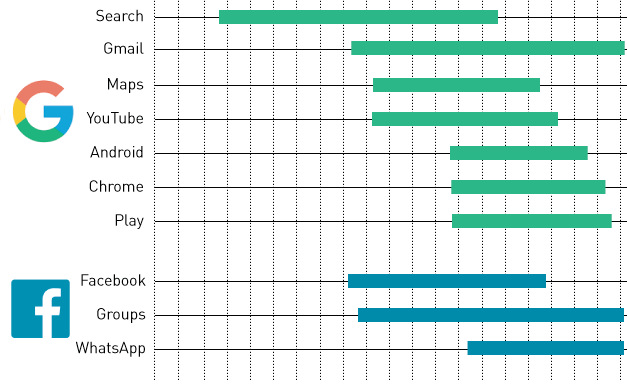
The March to a Billion Users
How long did it take for each app to hit the 1B mark?
The Chart of the Week is a weekly Visual Capitalist feature on Fridays.
With approximately 3.3 billion people now using the internet, how hard can it possibly be to reach one billion of them each month?
It turns out that it’s quite a challenge.
Apple, the largest company by market capitalization, doesn’t have a single product with that kind of penetration.
WeChat, which is the most popular mobile messaging app in China, couldn’t reach one billion active users even if it was used by every single person with a smartphone in China. That’s why the app “only” has 650 million active users right now.
Meanwhile, names such as Reddit, Twitter, Pinterest, and Instagram all boast hundreds of millions of users. However, none of these are able to yet have the global market penetration to reach the coveted billion mark.
The Big Three
So far, the only companies in possession of apps or programs with more than one billion active users are Google, Facebook, and Microsoft.
Amazingly, Google alone has seven of them: Search, Gmail, Maps, YouTube, Android, Chrome, and Play. The last of these to reach the one billion mark was Gmail, as per Alphabet’s announcement earlier this month during an earnings call.
Google also has the app that reached one billion users the quickest: Android did it in only 5.8 years.
Facebook also has three apps that can make the billion user claim. Facebook itself has the largest audience out of all of these apps, with 1.59 billion monthly active users. WhatsApp, which Facebook bought for $22 billion in October 2014, has also recently announced on its blog that it also surpassed the one billion user mark. This now fulfills a promise that Mark Zuckerberg made to Facebook shareholders at the deal’s outset.
Lastly, there’s Microsoft’s Windows and Office products, which are the only paid products that could crack the list. They took the longest to get there: 25.8 years and 21.7 years respectively.
Misc
Ranked: The World’s Most Surveilled Cities
Here are the world’s most surveilled cities ranked by CCTV cameras per 1,000 people.
Published
12 hours ago
on
March 28, 2026

Ranked: The World’s Most Surveilled Cities
See visuals like this from many other data creators on our Voronoi app. Download it for free on iOS or Android and discover incredible data-driven charts from a variety of trusted sources.
Key Takeaways
- Indian cities dominate the rankings, with Hyderabad (79 cameras per 1,000 people) leading globally.
- Eight of the top 10 cities are Asian. The other two most surveilled cities are in Russia.
- China has 700 million cameras (494 per 1,000 people), though per-city data is unavailable.
Surveillance is becoming a defining feature of modern cities, but the level of monitoring varies significantly from one urban center to the next.
In Los Angeles, the number of cameras exceeds 46,000. Hyderabad, India has around 900,000. This visualization ranks major global cities by the number of CCTV cameras per 1,000 people using data from Comparitech, showing where surveillance is most concentrated.
As governments and municipalities expand surveillance for security and smart city initiatives, these rankings offer a snapshot of where camera density—and public surveillance—is highest today.
Cities With the Most Cameras Per Capita
At the top of the list, Hyderabad, India leads globally with 79 cameras per 1,000 people, followed by Indore (72) and Bangalore (41). Collectively, they hold over 1.7 million cameras.
It’s worth noting that data for specific cities in China is unavailable owing to government secrecy. However, it’s estimated to have 494 cameras per capita, or nearly one camera for every two people.
The table below shows the number of CCTV cameras per capita, highlighting the scale of public surveillance around the world.
| Rank | City | Country | Cameras Per 1,000 People | Number of CCTV Cameras |
|---|---|---|---|---|
| 1 | Hyderabad | 🇮🇳 India | 79 | 900,000 |
| 2 | Indore | 🇮🇳 India | 72 | 251,500 |
| 3 | Bangalore | 🇮🇳 India | 41 | 585,300 |
| 4 | Lahore | 🇵🇰 Pakistan | 28 | 410,300 |
| 5 | Seoul | 🇰🇷 South Korea | 24 | 243,400 |
| 6 | Moscow | 🇷🇺 Russia | 20 | 250,000 |
| 7 | Kabul | 🇦🇫 Afghanistan | 18 | 90,000 |
| 8 | Singapore | 🇸🇬 Singapore | 18 | 113,000 |
| 9 | Saint Petersburg | 🇷🇺 Russia | 18 | 102,000 |
| 10 | Baghdad | 🇮🇶 Iraq | 15 | 120,000 |
| 11 | London | 🇬🇧 United Kingdom | 13 | 131,900 |
| 12 | Los Angeles | 🇺🇸 United States | 12 | 46,800 |
| 13 | Busan | 🇰🇷 South Korea | 12 | 42,800 |
| 14 | Istanbul | 🇹🇷 Turkey | 11 | 179,000 |
| 15 | New York City | 🇺🇸 United States | 10 | 80,300 |
| 16 | Delhi | 🇮🇳 India | 9 | 313,300 |
| 17 | Chennai | 🇮🇳 India | 9 | 106,600 |
| 18 | Ho Chi Minh City | 🇻🇳 Vietnam | 8 | 79,100 |
| 19 | Kuwait City | 🇰🇼 Kuwait | 7 | 24,900 |
| 20 | Bangkok | 🇹🇭 Thailand | 7 | 81,100 |
| 21 | Pune | 🇮🇳 India | 7 | 52,100 |
| 22 | Kochi | 🇮🇳 India | 7 | 24,000 |
| 23 | Lucknow | 🇮🇳 India | 7 | 27,200 |
| 24 | Hong Kong | 🇭🇰 Hong Kong | 6 | 48,000 |
| 25 | Mexico City | 🇲🇽 Mexico | 6 | 136,900 |
| 26 | New Taipei | 🇹🇼 Taiwan | 6 | 27,200 |
| 27 | Ankara | 🇹🇷 Turkey | 6 | 31,400 |
| 28 | Rome | 🇮🇹 Italy | 5 | 22,500 |
| 29 | Sydney | 🇦🇺 Australia | 5 | 26,200 |
Pakistan’s capital, Lahore, ranks fourth globally at 28 cameras per 1,000 people. With 410,300 cameras in total, facial recognition is often linked to national databases in real time.
Moscow, Russia ranks in sixth globally, with 20 cameras per capita. As one of the most pervasive surveillance systems worldwide, Moscow is blanketed in 250,000 cameras, which use facial recognition to identify protestors, journalists, and dissidents.
Across the West, London is the most highly surveilled cities, ranking in 11th overall. Following next in line is Los Angeles, with the number of cameras increasing by roughly 34% since 2022.
The Rise of Surveillance Infrastructure
Beyond Los Angeles, several cities have mirrored this expansion of surveillance systems in public spaces.
Notably, the number of cameras jumped 104% in Hyderabad, 17% in Moscow, and 3.6% in London since 2022. At the same time, these systems are increasingly using machine learning algorithms to identify patterns, automate profiles, and detect “suspicious activity”.
Not only do vast networks of cameras allow government authorities to detect traffic or parking violations, they provide access to people’s movements, raising questions of privacy and data accumulation in an age of AI-powered monitoring.
Learn More on the Voronoi App 
To learn more about this topic, check out this graphic on the countries that have banned ChatGPT.
Technology
Ranked: Countries With the Most Patents
China leads the world in patents, far ahead of the U.S. and Japan. See how global innovation is concentrated among a handful of countries.
Published
3 days ago
on
March 25, 2026

Ranked: Countries With the Most Patents
See visuals like this from many other data creators on our Voronoi app. Download it for free on iOS or Android and discover incredible data-driven charts from a variety of trusted sources.
Key Takeaways
- China leads the world with 5.7 million active patents, far ahead of any other country.
- The U.S. (3.5M) and Japan (2.1M) rank second and third, respectively.
- Together, the top three countries hold more patents than the rest of the world combined.
A handful of countries dominate global patent activity, with a steep drop-off after the top ranks. China alone accounts for a massive share, holding millions more active patents than any other country.
This visualization ranks countries by total active patents using the latest available data from the World Intellectual Property Organization for 2024.
China Is Miles Ahead on Active Patents
China leads with 5.7 million active patents, followed by the United States and Japan, and together the top three exceed the rest of the world combined.
| Country | Number of Active Patents |
|---|---|
| 🇨🇳 China | 5,688,867 |
| 🇺🇸 United States | 3,519,879 |
| 🇯🇵 Japan | 2,085,215 |
| 🇰🇷 South Korea | 1,312,294 |
| 🇩🇪 Germany | 963,941 |
| 🇫🇷 France | 757,026 |
| 🇬🇧 United Kingdom | 744,130 |
| 🇮🇹 Italy | 382,444 |
| 🇨🇭 Switzerland | 268,054 |
| 🇳🇱 The Netherlands | 246,254 |
| 🇷🇺 Russia | 243,943 |
| 🇮🇳 India | 228,402 |
| 🇪🇸 Spain | 217,849 |
| 🇨🇦 Canada | 201,063 |
| 🇮🇪 Ireland | 198,100 |
| 🇧🇪 Belgium | 187,149 |
| 🇱🇺 Luxembourg | 163,418 |
| 🇦🇺 Australia | 163,069 |
| 🇸🇪 Sweden | 152,158 |
| 🇦🇹 Austria | 134,163 |
| 🇲🇨 Monaco | 120,437 |
| 🇵🇱 Poland | 111,782 |
| 🇲🇽 Mexico | 111,190 |
| 🇩🇰 Denmark | 109,551 |
| 🇧🇷 Brazil | 106,827 |
| 🇿🇦 South Africa | 104,012 |
| 🇫🇮 Finland | 96,416 |
| 🇹🇷 Türkiye | 89,401 |
| 🇮🇩 Indonesia | 84,540 |
| 🇵🇹 Portugal | 81,509 |
| 🇭🇰 Hong Kong | 73,249 |
| 🇳🇴 Norway | 55,349 |
| 🇨🇿 Czechia | 50,433 |
| 🇸🇬 Singapore | 49,667 |
| 🇮🇷 Iran | 44,453 |
| 🇮🇱 Israel | 41,001 |
| 🇲🇾 Malaysia | 38,168 |
| 🇭🇺 Hungary | 35,950 |
| 🇬🇷 Greece | 27,510 |
| 🇷🇴 Romania | 27,474 |
| 🇹🇭 Thailand | 24,635 |
| 🇳🇿 New Zealand | 23,867 |
| 🇻🇳 Viet Nam | 23,291 |
| 🇸🇰 Slovakia | 21,189 |
| 🇨🇱 Chile | 21,079 |
| 🇺🇦 Ukraine | 20,445 |
| 🇸🇮 Slovenia | 18,517 |
| 🇵🇭 Philippines | 15,463 |
| 🇸🇦 Saudi Arabia | 14,739 |
| 🇭🇷 Croatia | 13,431 |
| 🇧🇬 Bulgaria | 13,311 |
| 🇦🇷 Argentina | 13,053 |
| 🇱🇹 Lithuania | 12,414 |
| 🇪🇪 Estonia | 10,684 |
| 🇱🇻 Latvia | 10,493 |
| 🇮🇸 Iceland | 9,501 |
| 🇷🇸 Serbia | 9,368 |
| 🇨🇴 Colombia | 9,009 |
| 🇿🇲 Zambia | 8,562 |
| 🇲🇹 Malta | 7,385 |
| 🇩🇿 Algeria | 7,039 |
| 🇲🇴 Macao | 5,777 |
| 🇲🇰 North Macedonia | 5,528 |
| 🇮🇶 Iraq | 5,141 |
| 🇪🇬 Egypt | 5,107 |
| 🇲🇦 Morocco | 4,917 |
| 🇦🇪 United Arab Emirates | 4,587 |
| 🇵🇪 Peru | 4,539 |
| 🇬🇭 Ghana | 3,326 |
| 🇰🇿 Kazakhstan | 2,837 |
| 🇧🇩 Bangladesh | 2,203 |
| 🇵🇰 Pakistan | 2,157 |
| 🇵🇦 Panama | 2,076 |
| 🇲🇳 Mongolia | 1,656 |
| 🇨🇷 Costa Rica | 1,462 |
| 🇧🇾 Belarus | 1,371 |
| 🇺🇿 Uzbekistan | 1,255 |
| 🇩🇴 Dominican Republic | 1,194 |
| 🇺🇾 Uruguay | 1,138 |
| 🇱🇰 Sri Lanka | 1,007 |
| 🇸🇻 El Salvador | 918 |
| 🇬🇪 Georgia | 836 |
| 🇹🇹 Trinidad and Tobago | 830 |
| 🇸🇾 Syria | 666 |
| 🇧🇭 Bahrain | 571 |
| 🇶🇦 Qatar | 569 |
| 🇯🇲 Jamaica | 451 |
| 🇭🇳 Honduras | 446 |
| 🇨🇺 Cuba | 421 |
| 🇳🇦 Namibia | 415 |
| 🇦🇿 Azerbaijan | 403 |
| 🇿🇼 Zimbabwe | 403 |
| 🇴🇲 Oman | 355 |
| 🇪🇹 Ethiopia | 322 |
| 🇵🇾 Paraguay | 257 |
| 🇲🇩 Moldova | 255 |
| 🇲🇬 Madagascar | 232 |
| 🇬🇹 Guatemala | 218 |
| 🇪🇨 Ecuador | 215 |
| 🇻🇪 Venezuela | 208 |
| 🇰🇬 Kyrgyzstan | 186 |
| 🇸🇹 Sao Tome and Principe | 153 |
| 🇰🇼 Kuwait | 74 |
| 🇧🇦 Bosnia and Herzegovina | 69 |
| 🇧🇧 Barbados | 63 |
| 🇦🇩 Andorra | 48 |
| 🇻🇨 Saint Vincent and the Grenadines | 20 |
| 🇦🇲 Armenia | 17 |
| 🇺🇬 Uganda | 17 |
| 🇨🇾 Cyprus | 10 |
| 🇧🇹 Bhutan | 6 |
| 🇲🇲 Myanmar | 4 |
South Korea takes the fourth spot for most active patents, with 1.3 million. It underscores Asia’s strong presence among the world’s leading innovation hubs.
It’s unsurprising to see these countries in the top ranks, given the size of their economies and populations, though South Korea becomes an outlier through this lens.
Germany is the top European country, at 963,941, but active patents dip significantly from there to 757,026 for France.
Myanmar, which brought in its first ever law dedicated to patent protection and innovation in 2024, sits at the bottom of the dataset with four patents. It is only one of two — the other being Bhutan, which has six active patents — to have fewer than 10 active patents.
Most Countries Contribute Little to Global Innovation
Global patent ownership is highly concentrated, with a small number of countries accounting for the majority of innovation output.
While countries like China, the U.S., and Japan dominate the landscape, most nations contribute relatively small numbers of active patents. This gap highlights differences in research capacity, industrial scale, and investment in innovation.
Learn More on the Voronoi App
To learn more about innovation, check out this graphic which ranks top startup hubs.