This graphic was created by information designer Anna Vital, read her full article here.

Copyright Funders and Founders.
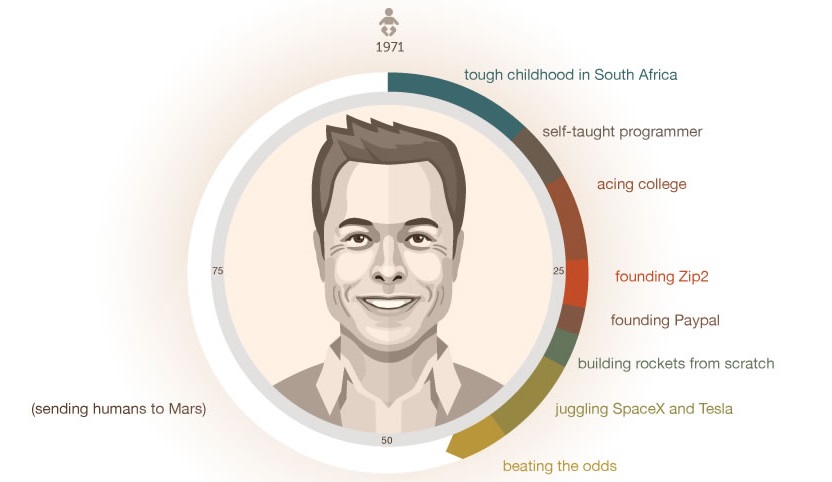
Step by Step: How Elon Musk Built His Empire
“The next Bill Gates will not build an operating system. The next Larry Page or Sergey Brin won’t make a search engine. Tomorrow’s champions will not win by competing ruthlessly in today’s marketplace. They will escape competition altogether, because their businesses will be unique.”
– Peter Thiel in “Zero to One”
In the book Zero to One, prominent entrepreneur and investor Peter Thiel shares his vision on what it takes to create an extraordinary company.
Specifically, Thiel believes that instead of making incremental upgrades to an existing product or service, a company must aim to do something completely new to avoid ruthless competition. While Thiel has worked with many impressive people over the years, Thiel points to Elon Musk as a particularly successful member of the Paypal Mafia that has gone “zero to one” many times.
The Résumé
At only the age of 44, just “some” of Musk’s successes include building the world’s first global online payments company (Paypal) and landing re-usable rockets on ocean platforms (SpaceX). He also co-founded SolarCity, which just closed a $338 million round for providing commercial solar and energy storage, and his electric car company Tesla now has 325,000 pre-orders for the Tesla Model 3, which is good for $14 billion in future revenues.
Meanwhile, in his spare time, Musk draws up plans for revolutionary transport systems, such as the Hyperloop and VTOL supersonic jet aircraft known as the Musk electric jet.
That’s going from zero to one at least a few separate times, with many years in his career left to come. How does Elon do it?
The Life of Elon Musk
In the infographic and article from Funders and Founders, Vital highlights key circumstances, decisions, and results in Elon Musk’s life. Here are some of the key inflection points that helped him to build his massive empire.
- Elon was born in South Africa to an engineer father and model mother on June 28, 1971.
- Elon read 10 hours a day as a kid, and even read the entire Encyclopedia Britannica.
- At age 12, Elon sold his first video game that he coded for $500.
- After being inspired by Hitchhiker’s Guide to the Galaxy, Elon decided that his new life mission would be to save humanity.
- Leaves Stanford PhD program after two days to help found Zip2, which he started with a $28,000 loan from his father.
- He later received proceeds of $22 million from the sale of Zip2 to Compaq, which he used to start X.com.
- X.com merges with another online bank (Confinity) to form Paypal.
- Elon gets ousted as CEO from Paypal while on his honeymoon, yet still invests more money in the company regardless.
- He discovers that space rockets are artificially overpriced, and starts SpaceX to build his own rockets.
- Elon gets $250 million from the sale of Paypal to Ebay.
- Meets Tesla founders Marc Tarpenning and Martin Eberhard, and introduces them to JB Straubel. Elon invests in Tesla.
- After having three SpaceX rockets explode while approaching bankruptcy with Tesla, Elon takes action. He takes over as CEO of Tesla and raises an emergency fifth round of financing. Meanwhile, his fourth rocket launch with SpaceX succeeds and a $1.6B contract with NASA is signed.
- Tesla goes public at $17 per share (it trades for ~$250/share today)
- Elon announces reusable rockets that could make space flight 100x cheaper, and promises to also send humans to Mars by 2021-2031.
- Elon publishes the Hyperloop design, starts building the Gigafactory, unveils the Powerwall, and eventually lands a rocket on an ocean platform.
What’s next?
Launching the Falcon Heavy rocket, starting Gigafactory production, selling the Model 3 electric car, and potentially landing on Mars are just some of the things on his future laundry list.
What Musk can actually accomplish in the future is anybody’s guess. We certainly won’t be betting against him.
Energy
Ranked: The World’s Biggest Natural Gas Producers
The U.S. produced 37.8 trillion cubic feet of dry natural gas in 2024, more than Russia and Iran combined.
Published
2 days ago
on
April 16, 2026

Ranked: The World’s Biggest Natural Gas Producers
See visuals like this from many other data creators on our Voronoi app. Download it for free on iOS or Android and discover incredible data-driven charts from a variety of trusted sources.
Key Takeaways
- The U.S. produces 25% of global natural gas, far ahead of any other country.
- Its output is nearly equal to Iran and China combined.
- Global supply is concentrated among a small group of producers, shaping energy markets and LNG trade.
The U.S. has pulled far ahead as the world’s largest natural gas producer, accounting for a quarter of global supply in 2024.
This chart ranks the top gas-producing countries using the latest available data from the U.S. Energy Information Administration, showing how output is concentrated among a handful of players that anchor global energy markets.
That dominance is becoming more important as disruptions in the Middle East tighten supply and shift trade flows toward large, stable producers like the United States.
The U.S. is the World’s Largest Natural Gas Producer
The U.S. isn’t just the top producer. It operates at a completely different scale.
In 2024, it produced 37,751 billion cubic feet of natural gas, more than 1.6x Russia and nearly equal to the combined output of Iran and China. No other country comes close. The gap between the U.S. and Russia alone is larger than the total output of most top-10 producers.
The data table below shows the ranking of natural gas production by country in 2024 in billion cubic feet:
| Rank | Country | Natural Gas Production in 2024 (billion cubic feet) |
|---|---|---|
| 1 | 🇺🇸 United States | 37,751 |
| 2 | 🇷🇺 Russia | 22,672 |
| 3 | 🇮🇷 Iran | 9,853 |
| 4 | 🇨🇳 China | 9,111 |
| 5 | 🇨🇦 Canada | 7,028 |
| 6 | 🇶🇦 Qatar | 6,003 |
| 7 | 🇦🇺 Australia | 5,368 |
| 8 | 🇳🇴 Norway | 4,626 |
| 9 | 🇸🇦 Saudi Arabia | 4,344 |
| 10 | 🇩🇿 Algeria | 3,496 |
| 11 | 🇲🇾 Malaysia | 2,860 |
| 12 | 🇹🇲 Turkmenistan | 2,755 |
| 13 | 🇮🇩 Indonesia | 2,472 |
| 14 | 🇦🇪 United Arab Emirates | 2,084 |
| 15 | 🇦🇷 Argentina | 1,660 |
| 16 | 🇪🇬 Egypt | 1,660 |
| 17 | 🇺🇿 Uzbekistan | 1,624 |
| 18 | 🇴🇲 Oman | 1,554 |
| 19 | 🇳🇬 Nigeria | 1,377 |
| 20 | 🇦🇿 Azerbaijan | 1,342 |
| 21 | 🇮🇳 India | 1,271 |
| 22 | 🇬🇧 United Kingdom | 1,095 |
| 23 | 🇲🇽 Mexico | 1,095 |
| 24 | 🇰🇿 Kazakhstan | 1,024 |
| 25 | 🇹🇭 Thailand | 953 |
| 26 | 🇮🇱 Israel | 953 |
| 27 | 🇹🇹 Trinidad and Tobago | 883 |
| 28 | 🇻🇪 Venezuela | 883 |
| 29 | 🇵🇰 Pakistan | 848 |
| 30 | 🇧🇷 Brazil | 777 |
| 31 | 🇧🇩 Bangladesh | 706 |
| 32 | 🇰🇼 Kuwait | 706 |
| 33 | 🇧🇭 Bahrain | 671 |
| 34 | 🇺🇦 Ukraine | 636 |
| 35 | 🇵🇪 Peru | 494 |
| 36 | 🇲🇲 Myanmar | 459 |
| 37 | 🇱🇾 Libya | 424 |
| 38 | 🇧🇴 Bolivia | 388 |
| 39 | 🇧🇳 Brunei | 388 |
| 40 | 🇵🇬 Papua New Guinea | 388 |
| 41 | 🇨🇴 Colombia | 353 |
| 42 | 🇮🇶 Iraq | 353 |
| 43 | 🇳🇱 Netherlands | 343 |
| 44 | 🇷🇴 Romania | 325 |
| 45 | 🇬🇶 Equatorial Guinea | 237 |
| 46 | 🇻🇳 Vietnam | 226 |
| 47 | 🇦🇴 Angola | 205 |
| 48 | 🇵🇱 Poland | 184 |
| 49 | 🇩🇪 Germany | 145 |
| 50 | 🇸🇾 Syria | 131 |
| 51 | 🇬🇭 Ghana | 120 |
| 52 | 🇳🇿 New Zealand | 117 |
| 53 | 🇨🇮 Ivory Coast | 95 |
| 54 | 🇮🇹 Italy | 92 |
| 55 | 🇨🇲 Cameroon | 88 |
| 56 | 🇹🇷 Turkey | 81 |
| 57 | 🇩🇰 Denmark | 78 |
| 58 | 🇹🇿 Tanzania | 71 |
| 59 | 🇯🇵 Japan | 67 |
| 60 | 🇨🇬 Congo | 64 |
| 61 | 🇭🇺 Hungary | 60 |
| 62 | 🇵🇭 Philippines | 60 |
| 63 | 🇹🇳 Tunisia | 42 |
| 64 | 🇲🇿 Mozambique | 42 |
| 65 | 🇨🇱 Chile | 39 |
| 66 | 🇮🇪 Ireland | 39 |
| 67 | 🇨🇺 Cuba | 35 |
| 68 | 🇭🇷 Croatia | 25 |
| 69 | 🇬🇦 Gabon | 18 |
| 70 | 🇦🇹 Austria | 18 |
| 71 | 🇷🇸 Serbia | 11 |
| 72 | 🇪🇨 Ecuador | 11 |
| 73 | 🇨🇿 Czechia | 7 |
| 74 | 🇯🇴 Jordan | 7 |
After the top four, production drops off sharply, with no country exceeding 7,500 billion cubic feet. Canada and Qatar lead the second tier, followed by a mix of LNG exporters and regional suppliers. This steep decline underscores how concentrated global supply is at the very top.
Together, those countries form the core of the global gas supply system, spanning North America, Eurasia, the Middle East, and key LNG-exporting hubs.
America’s Shale Helped Redraw the Production Map
U.S. natural gas output has roughly tripled since 2005 as hydraulic fracturing unlocked shale formations that were previously uneconomical. This surge helps explain why the U.S. stands so far ahead of other producers and why it has become central to both pipeline and LNG flows.
Recent tensions in the Middle East have disrupted natural gas infrastructure and shipping routes, particularly around the Strait of Hormuz, a key chokepoint for global energy trade.
With flows constrained, global markets are leaning more heavily on large, stable producers. This dynamic further amplifies the role of the U.S., which leads both in natural gas output and LNG export capacity.
As supply risks persist, this concentration is becoming more consequential. Countries with large, stable production, especially the U.S., are playing a growing role in balancing global energy markets and meeting LNG demand.
Learn More on the Voronoi App 
If you enjoyed today’s post, check out U.S. Natural Gas Trade with North America (1985-2024) on Voronoi.
Energy
Charted: The Rise of Silicon in EV Batteries
By 2035, silicon could make up 20% of EV battery anode capacity, helping cars go farther on a single charge.
Published
3 days ago
on
April 16, 2026

Charted: The Rise of Silicon in EV Batteries
See visuals like this from many other data creators on our Voronoi app. Download it for free on iOS or Android and discover incredible data-driven charts from a variety of trusted sources.
Key Takeaways
- Silicon-based anodes are expected to grow from about 5% share in 2022 to roughly 20% of lithium-ion battery capacity by 2035.
- Because silicon stores far more lithium than graphite, it could enable longer EV range, smaller batteries, and lower costs per kilometer.
Electric vehicles rely heavily on lithium-ion batteries, and the materials used inside them are evolving rapidly. For years, graphite has dominated battery anodes—the negative electrode that stores lithium during charging.
However, silicon is emerging as a powerful alternative. This infographic charts the projected rise of silicon-containing anodes in EV batteries through 2035.
The data for this visualization comes from Benchmark Mineral Intelligence. It tracks the weighted supply of anode materials in gigawatt-hours (GWh) of battery capacity, representing the amount of EV battery use supported by each material type.
Graphite Still Dominates Today
Graphite remains the backbone of lithium-ion battery anodes. In 2022, synthetic graphite alone accounted for roughly 76% of global anode capacity, while natural graphite made up another 18.6%.
This dominance stems from graphite’s stability, relatively low cost, and established supply chains. Manufacturers have spent decades optimizing graphite-based batteries, making them reliable for mass EV production.
However, graphite has a major limitation: it stores relatively little lithium compared to emerging alternatives.
Why Silicon Is So Promising
Silicon can theoretically store about 10 times more lithium than graphite. This property allows batteries with silicon-enhanced anodes to pack more energy into the same physical space.
In practical terms, this could significantly extend EV range without increasing battery size. For example, an EV that previously covered 480 km on a single charge could reach 640 km—or even 800 km—using a battery pack of the same size and weight.
| Year/Weighted supply in GWh | Nat. Graphite | Synth. Graphite | Graphite-silicon | Silicon-engineered | Other |
|---|---|---|---|---|---|
| 2022 | 268.17 | 1098.90 | 71.97 | 0.07 | 6.20 |
| 2023 | 312.03 | 1369.18 | 82.28 | 0.26 | 9.83 |
| 2024 | 292.83 | 1558.32 | 118.60 | 0.78 | 15.96 |
| 2025 | 325.58 | 2198.77 | 165.20 | 0.87 | 18.56 |
| 2026P | 365.58 | 2498.28 | 257.08 | 0.91 | 22.03 |
| 2027P | 459.66 | 2814.68 | 393.16 | 0.98 | 27.77 |
| 2028P | 488.39 | 3379.84 | 574.61 | 1.00 | 34.81 |
| 2029P | 571.14 | 4066.84 | 942.08 | 46.18 | 40.70 |
| 2030P | 587.15 | 4325.93 | 1372.61 | 44.88 | 45.11 |
| 2031P | 636.84 | 4541.82 | 1366.96 | 63.62 | 57.93 |
| 2032P | 700.18 | 4745.79 | 1383.97 | 96.52 | 60.58 |
| 2033P | 822.91 | 4895.03 | 1243.78 | 213.86 | 61.68 |
| 2034P | 900.65 | 4911.50 | 1273.32 | 214.94 | 83.73 |
| 2035P | 939.88 | 4920.50 | 1304.03 | 214.09 | 86.69 |
Because silicon expands significantly during charging cycles, engineers are developing hybrid approaches. These include graphite–silicon composites and engineered silicon materials that balance higher capacity with structural stability.
Silicon’s Share Could Reach 20% by 2035
Forecasts suggest silicon will steadily gain traction over the next decade. Graphite–silicon composite anodes are projected to rise from 5% of battery capacity in 2022 to 17.5% by 2035.
| Material | 2022 | 2035P | Share Shift (pp) |
|---|---|---|---|
| Natural Graphite | 18.6% | 12.6% | -6 |
| Synthetic Graphite | 76.0% | 65.9% | -10.1 |
| Graphite-silicon composite | 5.0% | 17.5% | 12.5 |
| Silicon-engineered | 0.0% | 2.9% | 2.9 |
| Other | 0.4% | 1.2% | 0.8 |
| Total | 100.0% | 100.0% | — |
Meanwhile, fully engineered silicon anodes could expand from almost zero share to about 3% over the same period.
Learn More on the Voronoi App
To learn more about this topic, check out this graphic on the projected battery mineral deficit by 2034.