How Gender Diversity Leads to a Bigger Bottom Line
Despite making up half of the population and 47% of the labor force, women remain highly underrepresented in the top echelons of business.
- 5% of the richest billionaires are women
- 6% of S&P 500 companies have women CEOs
- 20% of Fortune 500 board members are women
There are many arguments that can be made for closing this gender gap, but the most compelling one is very simple: there’s a growing body of research that shows that gender diverse companies make more money.
Women and Profit
Today’s infographic comes to us from Evolve ETFs, a company that has launched an ETF focused on gender diversity, and it shows that companies with more women in senior roles are making better decisions and ultimately higher profits.
Better Decisions
The more diverse a team is, the more likely it is to make the best business decision. Logically, this makes sense, since multiple perspectives are considered this way – and groupthink can be avoided.
There have been various studies on decision-making that show this, but one compelling example highlighted by Forbes covers 600 business decisions made by 200 different teams over a two year span. This research found that more diverse and inclusive teams made better decisions up to 87% of the time, took less time to make the decision, and delivered 60% better results.
Better Bottom Line
Not surprisingly, making better business decisions leads to bigger returns, as well. Credit Suisse, for example, found that boards with more women had a 36% higher return on equity.
Meanwhile, research from Morgan Stanley found that the top-third of companies (that hire the most women) had 2% higher equity returns than average.
A final study worth noting is from The Peterson Institute for International Economics, a Washington, D.C. think tank, which shows that companies with at least 30% female leaders end up raking in 6% higher net margins.
Future Growth
On the company level, gender diversity means more profit and better decisions – but what could this mean in aggregate?
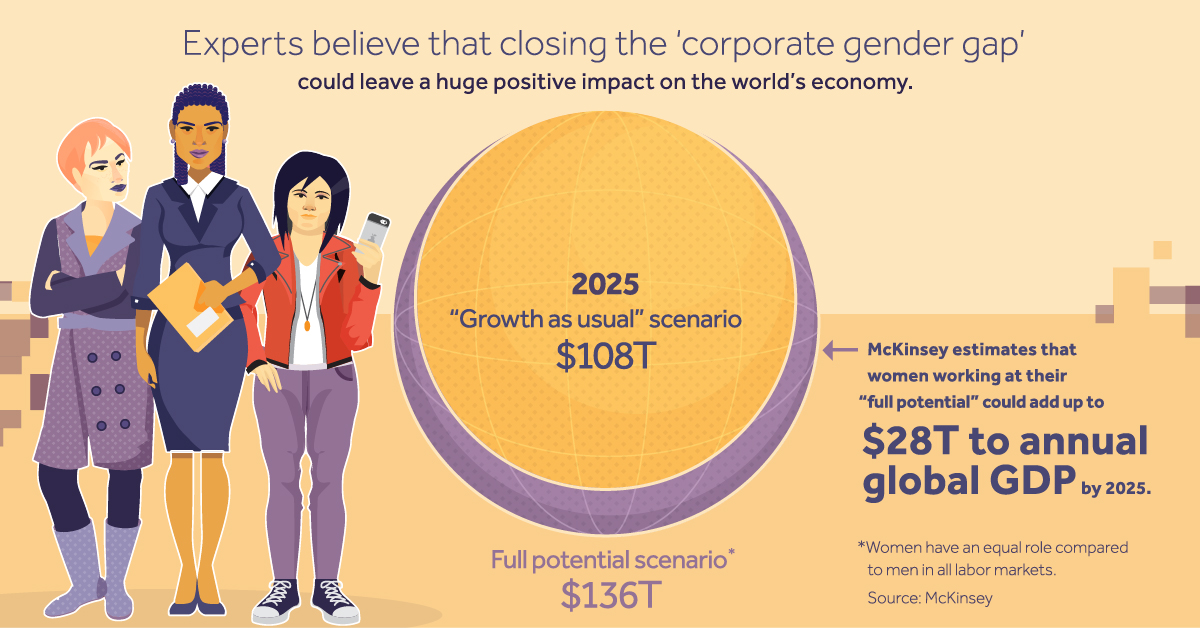
Global management consultancy firm McKinsey & Company offers up a rosy picture: they figure that if the gender gap is closed in their “full potential” scenario, up to $28 trillion extra could be added to global GDP growth by 2025.
Markets
The World’s $160 Trillion Debt Market in One Chart
Over $160 trillion in debt securities were on the market in 2025. Over half were found in just the U.S. and European Union.

Published
19 hours ago
on
August 28, 2026

The World’s $160 Trillion Debt Market in One Chart
Key Takeaways
- The U.S. has the world’s largest debt securities market at $61.2 trillion.
- The U.S., EU, and China together account for 75.4% of the global market.
- China’s debt securities market has grown roughly 3.7-fold since 2015.
The global market for bonds and other tradable debt reached $160.7 trillion in 2025, spanning securities issued by governments, financial institutions, and nonfinancial corporations.
This visualization ranks the world’s major debt markets by the value of outstanding debt securities in 2025. Data has been sourced from the Bank for International Settlements via SIFMA.
The graphic excludes loans and other nonsecuritized debt.
America’s Debt Market Dominance
At $61.2 trillion, the U.S. debt securities market is almost twice the size of the European Union’s ($31.1 trillion). It is also about $1.4 trillion larger than the EU and China ($28.7 trillion) combined.
The table below lists the world’s major debt markets as of the end of 2025.
| Country | Market cap in 2025 ($T) | Share of global market (%) |
|---|---|---|
| 🇺🇸 United States | 61.2 | 38.1 |
| 🇪🇺 EU | 31.1 | 19.4 |
| 🇨🇳 China | 28.7 | 17.9 |
| 🇯🇵 Japan | 10.8 | 6.7 |
| 🇬🇧 United Kingdom | 6.9 | 4.3 |
| 🇨🇦 Canada | 4.6 | 2.9 |
| 🇦🇺 Australia | 2.6 | 1.6 |
| 🇸🇬 Singapore | 0.9 | 0.6 |
| 🇨🇭 Switzerland | 1.0 | 0.6 |
| 🇭🇰 Hong Kong | 0.2 | 0.2 |
| Other Emerging Markets | 8.4 | 5.2 |
| Other Developed Markets | 4.1 | 2.6 |
| 🌐 Total | 160.7 | 100.0 |
The $61 trillion figure reflects more than simply the massive U.S. government debt. The source measurement also includes securities issued by financial and nonfinancial corporations.
America is also unusually reliant on securities markets for corporate financing. Debt securities account for over three-quarters of U.S. nonfinancial corporate debt financing, whereas bank lending averages 85% across China, Japan, the United Kingdom, and the euro area.
China’s Massive Debt Market
China has the world’s second-largest national debt securities market at $28.7 trillion, nearly triple the size of Japan’s $10.8 trillion market.
Its rise over the past decade has been substantial. China’s market has grown from $7.8 trillion in 2015 to $28.7 trillion in 2025, while its share of the global total has increased from 9.2% to 17.9%.
For more context on this growth, see this earlier visualization.
The Concentration of Global Debt Markets
The global debt securities market is highly concentrated: the U.S., EU, and China together account for 75.4% of the total. Adding Japan brings the share to 82.1%.
However, the balance shifted in 2025. Despite U.S. outstanding securities rising 5.2%, the country’s global share fell from 40.0% to 38.1%. China’s share increased from 17.2% to 17.9%, while the EU’s rose from 18.2% to 19.4%.
While developed markets still dominate overall, these figures suggest the composition of the global market is gradually shifting.
Since these figures are reported in U.S. dollars, exchange-rate movements can also affect year-to-year comparisons.
Learn More on the Voronoi App
To learn more about the debt profiles of different markets, check out Visualized: All The Debts In the World on Voronoi.
Revenue
Ranked: The World’s Largest Companies by Revenue (2020-2026)
Walmart was the world’s largest company by revenue for over 15 years. In 2026, Amazon finally surpassed it.
Published
2 days ago
on
August 27, 2026

Ranked: The World’s Largest Companies by Revenue (2020-2026)
Key Takeaways
- Amazon rose from ninth place in 2020 to become the world’s largest company by revenue in 2026.
- Walmart fell to second place after a 15-year run atop the Fortune Global 500.
- UnitedHealth Group climbed from 10th place in 2023 to fourth in 2026, reaching $448 billion in annual revenue.
The composition of the world’s largest companies has shifted considerably since 2020, as energy giants have given way to a growing mix of retail, technology, and healthcare firms.
This visualization ranks the world’s 10 largest companies by annual revenue between 2020 and 2026, using the latest available data from the Fortune Global 500. Revenue figures are for fiscal years ending on or before March of a given year.
The Top Firms of 2020
In 2020, five of the world’s 10 largest companies by annual revenue were energy companies, led by Chinese oil refiner Sinopec ($407 billion).
Walmart ($524 billion) was the only company to generate more revenue than Sinopec that year. The table below ranks the world’s top-revenue companies in 2020.
| Rank | Company | 2020 Revenue (billions $) |
|---|---|---|
| 1 | 🇺🇸 Walmart | 524 |
| 2 | 🇨🇳 Sinopec | 407 |
| 3 | 🇨🇳 State Grid | 384 |
| 4 | 🇨🇳 PetroChina | 379 |
| 5 | 🇬🇧 Shell | 352 |
| 6 | 🇸🇦 Saudi Aramco | 330 |
| 7 | 🇩🇪 Volkswagen | 283 |
| 8 | 🇬🇧 BP | 283 |
| 9 | 🇺🇸 Amazon | 281 |
| 10 | 🇯🇵 Toyota | 275 |
Chinese state-owned companies occupied three of the top four spots, while Saudi Aramco ($330 billion) and BP ($283 billion) also made the top 10.
However, the effects of the pandemic led to a decline in energy demand. As a result, all non-Chinese energy companies fell off the world’s top 10 list in 2021.
Amazon’s Rise to the Top
By 2026, no privately owned energy companies remained among the world’s 10 largest firms by revenue. Retail led the ranking, with Amazon ($717 billion) narrowly surpassing Walmart ($713 billion).
Amazon’s ascent to become the world’s top-revenue firm has been dramatic. In 2020, the company ranked ninth worldwide with $281 billion in revenue.
Sales surged in 2020 and 2021 as consumers stayed home and ordered more online. Amazon climbed to third place in 2021 and ranked second in 2022, 2024, and 2025. In 2026, it edged out Walmart by just $4 billion for the top spot.
| Rank | Company | 2026 Revenue (billions $) |
|---|---|---|
| 1 | 🇺🇸 Amazon | 717 |
| 2 | 🇺🇸 Walmart | 713 |
| 3 | 🇨🇳 State Grid | 555 |
| 4 | 🇺🇸 UnitedHealth Group | 448 |
| 5 | 🇸🇦 Saudi Aramco | 446 |
| 6 | 🇺🇸 Apple | 416 |
| 7 | 🇺🇸 McKesson | 403 |
| 8 | 🇺🇸 Alphabet | 403 |
| 9 | 🇺🇸 CVS Health | 402 |
| 10 | 🇨🇳 PetroChina | 402 |
The Growing Heft of Healthcare
Healthcare companies also gained significant ground over the period.
Healthcare has become one of the largest economic sectors in major markets such as the U.S. and Europe, partly due to aging populations.
Neither UnitedHealth Group nor CVS Health ranked among the world’s top 10 companies by revenue in 2020. By 2026, UnitedHealth had climbed to fourth place with $448 billion in revenue, while CVS Health ranked ninth at $402 billion.
Learn More on the Voronoi App
To zoom in on the consumer goods sector specifically, check out Top 10 Consumer Goods & Services Companies Globally By Revenue (2024) on Voronoi.